
Morgan Stanley “BAUSE5X Step-Up Jump” Market-Linked CDs (Auto-Callable) — Evaluation
Headline Simulation Results
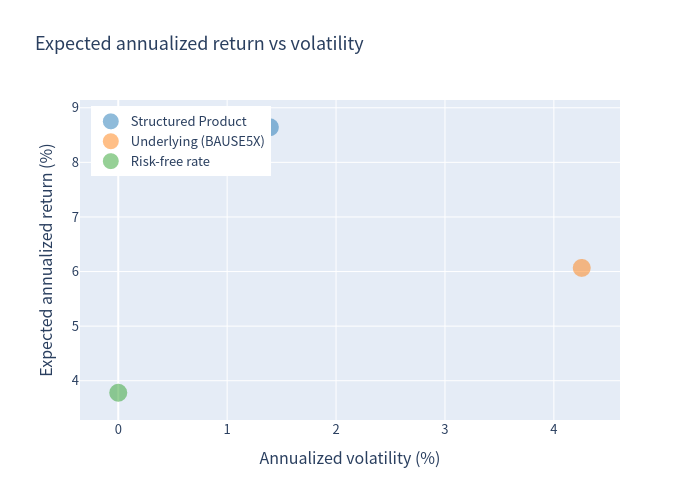
Over 10,000 simulated scenarios the CD is auto-called in ~97% of cases and delivers an expected annualized return of 8.64% with a 1.39% annualized volatility. Because the CDs are principal-protected at maturity on a nominal basis, the modelled probability of a nominal loss is 0%; the 99% (1-year) VaR is a small positive number (0.34%) because the worst outcomes are a return of principal (0%) plus a handful of tiny-positive maturity payoffs, never an outright loss. The trade-off is that returns are highly concentrated and the upside is capped by the auto-call.
| Metric | Structured Product |
|---|---|
| Expected annualized return | 8.64% |
| Probability of a negative return | 0.00% |
| 99% confidence VaR (1 year) | 0.34% (essentially no downside — the weakest outcomes are a return of principal, not a loss) |
| Expected holding period | 17.2 months (1.4 years) |
| Expected total return over the realized holding period | 11.65% |
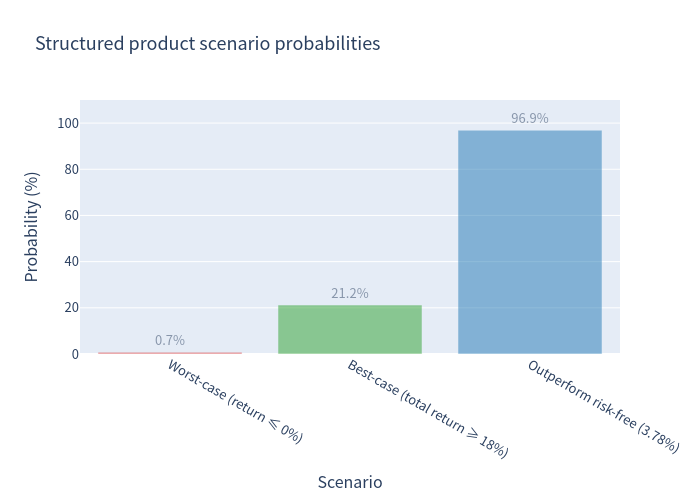
| Probability of being auto-called before maturity | 96.90% |
| Probability of outperforming the risk-free rate (3.78%) | 96.92% |
Basic Product Information
| Field | Value |
|---|---|
| Issuer | Morgan Stanley Bank, N.A. |
| Reference asset | BlackRock Adaptive U.S. Equity 5% Index (BAUSE5X) — a single, volatility-targeted (5% target) U.S. equity index |
| Product type | Market-linked, auto-callable, principal-protected Certificate of Deposit (pays no interest) |
| Deposit amount | $1,000 per CD |
| Currency | USD |
| Term | Pricing 30 Jan 2026 → maturity 4 Feb 2031 (~5 years, observed annually) |
| Estimated value at issue | $974.80 per CD |
How it works (in plain terms)
- You deposit $1,000 per CD. The CD pays no interest and no coupons.
- Once a year (in January), the CD “looks” at the index.
- If the index is at or above a threshold that rises each year (101% in yr 1, 102% in yr 2, 103% in yr 3, 104% in yr 4), the CD is automatically redeemed and you receive the corresponding step-up payment: $1,090 / $1,180 / $1,270 / $1,360 — a 9% per-annum return.
- If the CD is never called, at maturity (Feb 2031) you receive:
$1,000 × max(1, index final / index initial)- i.e. 100% of any index gain (uncapped), or your $1,000 back if the index has fallen (principal protection).
So the investor gives up the index's upside above the 9% step-up in exchange for a fixed 9% per-annum “lock-in” whenever the index is up even slightly, plus downside protection at maturity. (Protection is subject to the issuer's credit risk.)
Key Statistics — Structured Product vs. Underlying
Total-return comparison over the matched holding period of each path (dividends are not distributed by this synthetic index, so no adjustment is applied):
| Metric (annualized) | Structured Product | Underlying (BAUSE5X) |
|---|---|---|
| Expected annualized return | 8.64% | 6.07% |
| Expected annualized volatility | 1.39% | 4.26% |
| Probability of loss (return < 0) | 0.00% | 0.74% |
| 99% confidence VaR (1 year) | 0.34% | 0.34% |
| Expected total return over holding period | 11.65% | 7.08% |
The reference index is a low-volatility strategy (5% target volatility; realised annualized volatility of roughly 5% and a modest, cash-like historical return). Note that the index has only a short live track record (launched March 2023). This low volatility is precisely what allows the 9% step-up to look attractive relative to the index's own expected return.
Charts
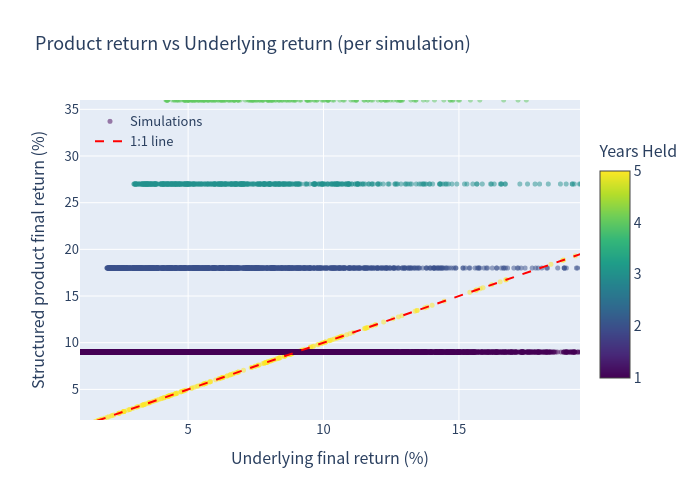
Simulation outcomes — product return vs. underlying return
Colour = years held; dashed line = 1:1.
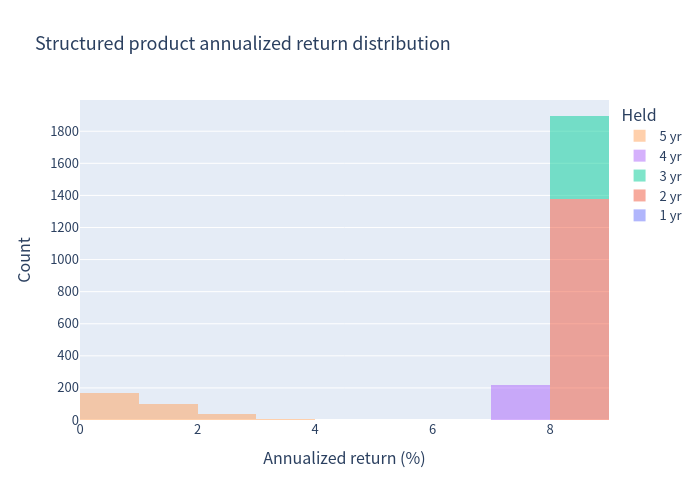
Distribution of annualized returns — Structured product
Stacked by years held.
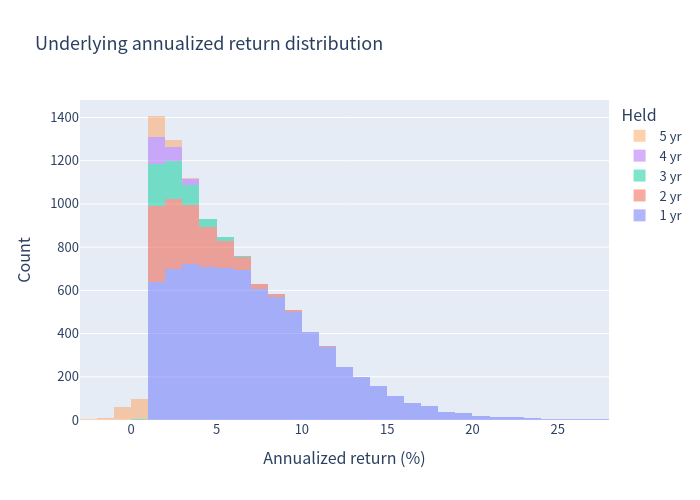
Distribution of annualized returns — Underlying index
Stacked by years held.
Scenario probabilities
Risk / return positioning
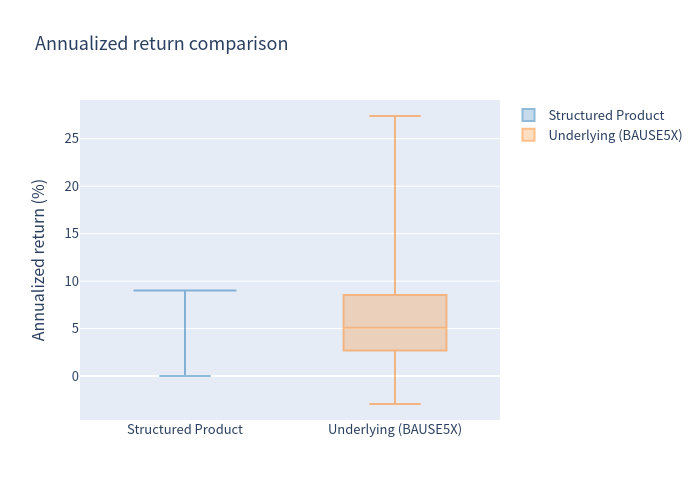
Annualized return comparison (box plot)
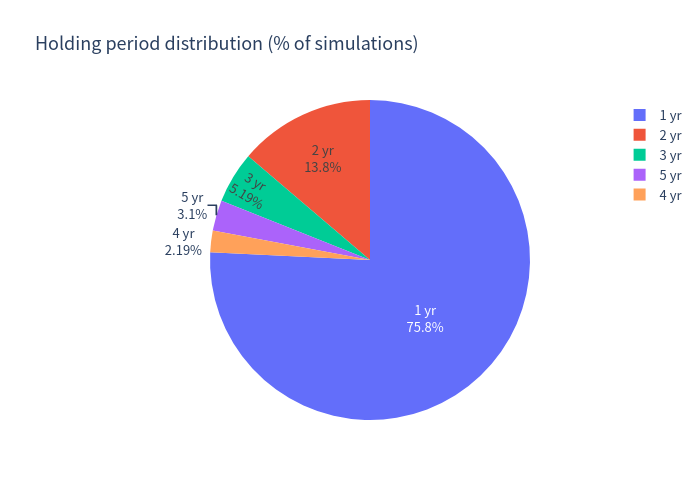
Holding-period distribution
Investment Commentary
- Principal protection. On a nominal basis the investor's deposit is returned at maturity whether the index rises or falls; the modelled probability of a nominal loss is 0% and the 1-year 99% VaR is ~0.3%.
- Attractive step-up vs. a low-volatility reference. A 9% per-annum return compares very favourably with the reference index, whose own expected return is modest (~5–6%) and whose realised volatility is only ~5%.
- Frequent early redemption. In ~97% of paths the CD is called (most often after year 1), converting a modest index gain into a locked 9% per-annum return; ~97% of paths beat the 3.78% risk-free rate.
- Favourable risk/return versus the underlying in this base case — a higher expected return (8.64% vs. 6.07%) at roughly one-third of the volatility.
- Capped upside / capped “lottery”. The auto-call limits the return to the fixed 9% per-annum step-up. If the index rallies strongly, the investor will under-perform a direct holding of the index.
- Concentrated outcome. ~76% of paths return exactly +9% (called after year 1). There is almost no positive tail — the return distribution is a spike at +9% with a small mass at 0% (principal) and a thin spread in between.
- The appeal rests on the step-up, not the index. The reference index is by design a low-return, decrementing, volatility-targeted strategy (0.5% per-annum decrement plus an interest-rate reduction drag). Its historical return has been roughly cash-like; the product is attractive relative to that index, not relative to a full equity allocation.
- Sensitivity to the index's expected return. The whole case is driven by whether the index's forward return is below the 9% step-up. If the index returned materially more than ~9% per annum, the cap would dominate and the product would lag the index.
- Costs, liquidity and credit. The estimated value at issue ($974.80 per $1,000) sits below the deposit amount, reflecting structuring/funding costs; the CD is not actively traded and early withdrawal is generally not available (except on death/adjudication). Returns are further subject to the issuer's credit risk and to FDIC insurance limits.
- Annualized figures and short holding periods. Because most paths are called after only ~1 year, annualized figures should be read together with the total return and holding period; with an expected holding period of ~1.4 years the headline annualized number over-states what many investors would actually experience over a full cycle.
Note: the analysis models the reference index as a 5%-target-volatility U.S. equity strategy with a 0.5% per-annum decrement, and assumes a forward expected excess return consistent with that low volatility. Results are sensitive to this assumption.