
11.20% p.a. Multi Barrier Reverse Convertible — Simulation & Risk Analysis
Headline Results
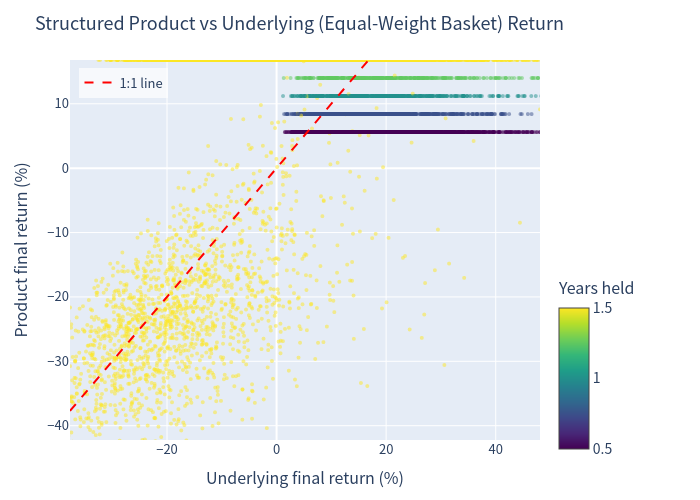
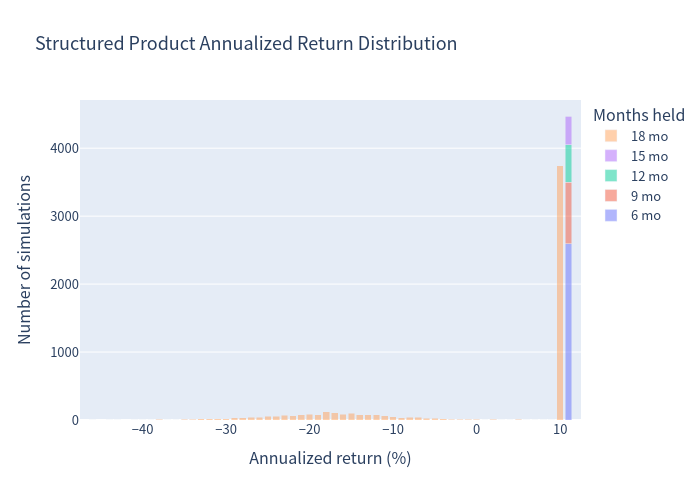
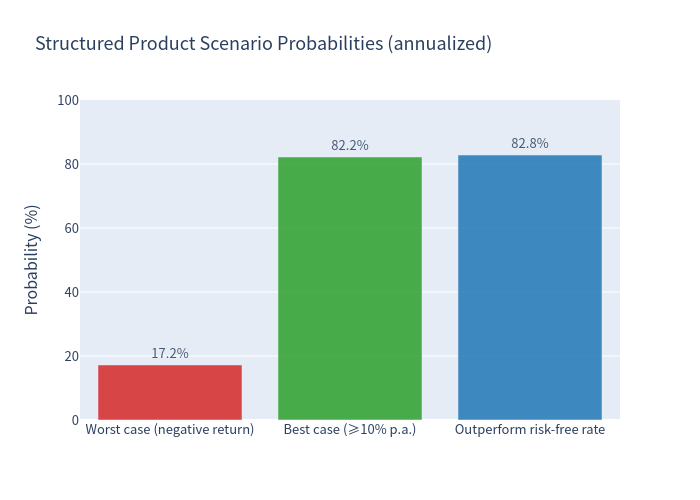
The product delivered a positive return in 82.80% of simulated scenarios and outperformed the risk-free rate in the same share of scenarios. In the favourable majority of cases the investor earned approximately the full 11.20% p.a. coupon, while in the adverse tail (barrier breached and worst-performing stock below strike at maturity) capital losses can be substantial (down to about -45% annualized in the extreme tail).
Basic Product Information
How it works (layman's explanation)
This is a reverse convertible on the three Swiss stocks Geberit, Stadler Rail and Sulzer (worst-of structure):
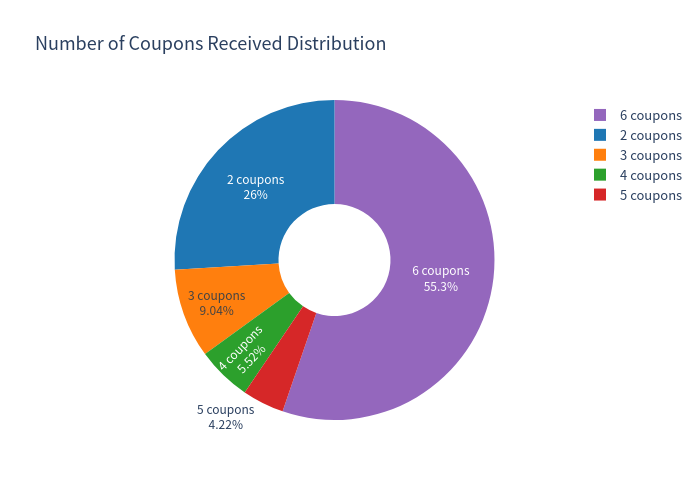
- Fixed coupon: The investor receives a quarterly coupon of 2.80% (CHF 28.00 per CHF 1,000, i.e. 11.20% p.a.) on 6 dates over the 18-month term, regardless of how the shares perform.
- Issuer call (callable): The Issuer may call (redeem early) at months 6, 9, 12 or 15. If called, the investor receives par + the coupon for that period and the product ends (no further coupons).
- Conditional capital protection: If no underlying has ever traded at or below 59% of its initial level during the observation period, the investor receives 100% of par at maturity plus all coupons — even if the shares fell moderately.
- Downside scenario: If at least one underlying breaches the 59% barrier and the worst-performing underlying finishes below its strike (100% of initial) at maturity, the investor receives physical delivery of that worst-performing stock (i.e. a loss equal to the share decline), plus all coupons paid.
- Capped upside: There is no participation in share price gains; the maximum payoff is par + the coupon stream.
Key product parameters
| Product type | Multi Barrier Reverse Convertible (SSPA 1230), Issuer-callable |
| Underlyings | Geberit, Stadler Rail, Sulzer (worst-of) |
| Currency / Denomination | CHF / CHF 1,000 |
| Term | 25/08/2026 – 25/02/2028 (18 months) |
| Coupon | 11.20% p.a., paid quarterly (2.80% per period) |
| Barrier | 59.00% of initial level (continuous observation) |
| Strike | 100.00% of initial level |
| Early redemption | Issuer call at months 6/9/12/15 → par + coupon |
| Upside cap | Yes (coupon + par) |
Key Statistics
| Metric (annualized) | Structured Product | Underlying (equal-weight basket, incl. dividends) |
|---|---|---|
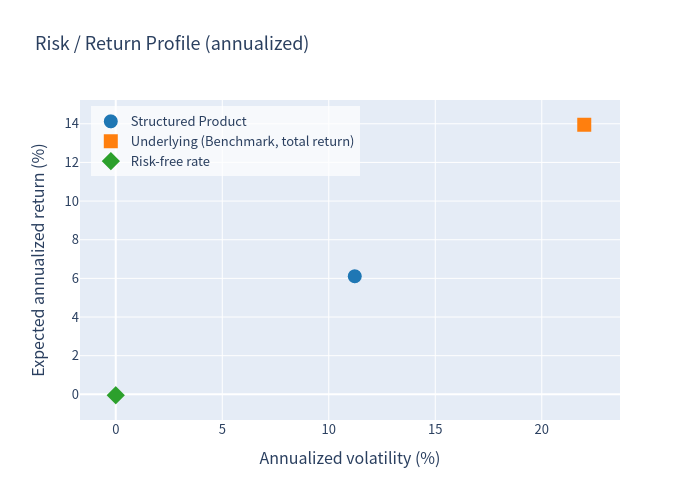
| Expected annualized return | 6.11% | 13.95% |
| Annualized volatility | 11.22% | 21.99% |
| Probability of loss | 17.20% | 29.33% |
| 99% VaR (1-year) | -30.63% | -24.55% |
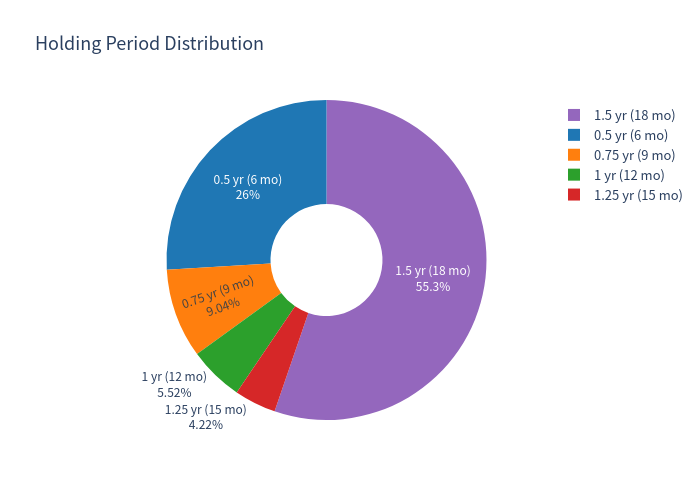
Notes on holding periods: the product has variable holding periods (6 to 18 months). The expected total return over the realized holding period is 5.49% (median 8.40%) over an average holding period of 13.61 months; the expected annualized figure is the mean of per-simulation annualized returns. The product was called early by the Issuer in 44.74% of simulations and ran to maturity in 55.26%. The barrier was breached in 19.35% of simulations, of which the subset with the worst stock below strike at maturity produced the losses.
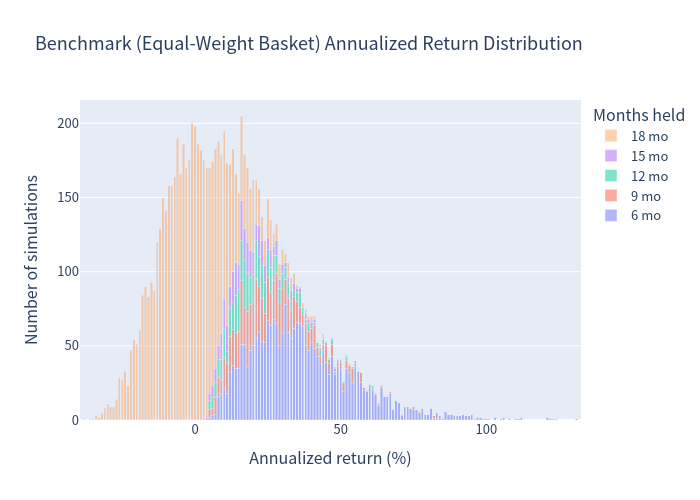
The underlying (equal-weight basket) comparison uses the same holding horizon as the product in each simulation; because the product is typically called early in favourable markets, the benchmark's measured average return is conditioned on those (good) stopping points and appears elevated relative to its unconditional long-term expectation.
Charts
Simulation Outcomes
Scatter of simulated product outcomes across scenarios.
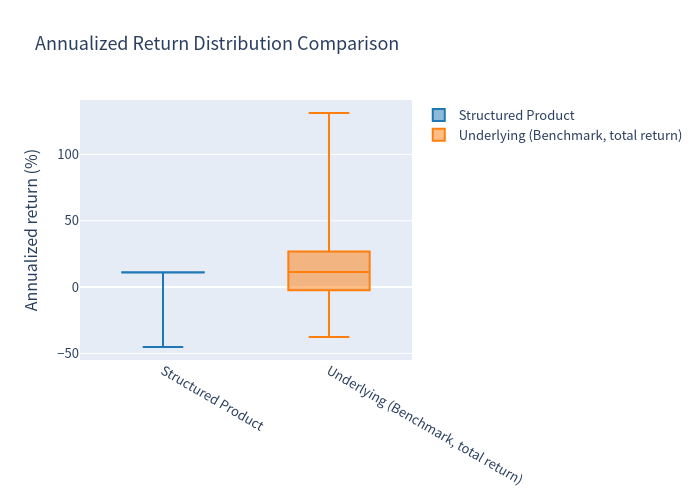
Annualized Return Distributions
Distribution of annualized returns for the structured product (top) and the underlying equal-weight basket (bottom).
Scenario Probabilities
Probability of the distinct payoff scenarios (called early, redemption at par, barrier breach with loss, etc.).
Risk / Return Profile
Annualized return versus risk (volatility) positioning of the structured product relative to the underlying basket.
Return Comparison Box Plot
Distribution comparison of annualized returns between the structured product and the underlying basket.
Holding Period & Coupon Distribution
Distribution of realized holding periods (top) and number of coupons received (bottom).
Investment Commentary
Positive features
- High, unconditional coupon: 11.20% p.a. (2.80% per quarter) paid regardless of underlying performance while the product is alive; in ~83% of scenarios the investor earned a positive return and beat the risk-free rate.
- Deep conditional protection: The 59% barrier (41% below initial) provides meaningful cushion; in ~81% of simulations no barrier event occurred and the product redeemed at par.
- Probability distribution is attractive: ~82% of scenarios cluster at roughly 10.9–11.2% annualized, with the P25–P95 range spanning 10.91%–11.20%. Losses are confined to the barrier-event tail.
- Moderate volatility of outcomes: Annualized volatility of 11.22% is roughly half that of the underlying basket (21.99%), reflecting the coupon-plus-par payoff profile.
Considerations (risk factors)
- Capital-at-risk tail: In the worst scenarios (barrier breached and worst stock below strike at maturity), the investor receives shares worth less than par; the 1% VaR is -30.63% annualized and the minimum simulated annualized return is about -45%.
- Worst-of exposure: Losses are driven by the worst-performing of the three stocks, so a single large decline among the three names is sufficient to trigger the loss scenario.
- Issuer call / reinvestment risk: The Issuer can terminate early (observed in ~45% of simulations); after being called the investor must reinvest at prevailing (currently near-zero CHF) rates.
- Capped upside: No participation in equity gains — maximum total return is the coupon stream.
- Credit risk: The product is an unsecured obligation of Leonteq Securities AG (issuer credit risk is not captured in the payoff simulation).
This analysis is for information only and does not constitute investment advice or a suitability assessment.