
10.40% p.a. Multi Barrier Reverse Convertible on Bayer AG & Merck KGaA (Callable)
Headline Simulation Results
This is a yield-enhancement note that pays an attractive 10.40% p.a. coupon and gives conditional capital protection. In roughly 84% of simulated paths it beats the risk-free rate, but its expected mean return is dragged lower by a ~16% probability of a meaningful loss when the barrier is breached and a stock finishes well below its starting level.
1. Product at a Glance
| Product | Multi Barrier Reverse Convertible (worst-of, continuous barrier), callable by the Issuer |
| Underlyings | Bayer AG (BAYN GY) and Merck KGaA (MRK GY), both Xetra/EUR |
| Coupon | 10.40% p.a. — EUR 26.00 per EUR 1,000 per period (6 payments = 15.60% total) |
| Barrier / Strike | 59.00% continuous (worst-of) / 100.00% strike |
| Upside | Capped — redemption at par (100%), no participation in gains |
| Denomination / Currency | EUR 1,000 / EUR (no FX feature) |
| Key dates | Issue 10/11/2026 · Call observations 04/05/2027, 04/08/2027, 04/11/2027, 04/02/2028 · Final Fixing 04/05/2028 |
2. How It Works (plain language)
- You are paid a fixed coupon of roughly 2.60% every three months (10.40% p.a.) no matter what the stocks do — even if the barrier is breached, the coupons keep coming while the note is alive.
- If neither stock ever falls to 59% of its starting level (a 41% cushion), you simply get your full EUR 1,000 back at maturity plus all six coupons.
- If either stock touches 59% at any time (continuous, worst-of observation), the protection is knocked out. At maturity you then receive the worse-performing stock's performance: if that stock has recovered to at or above its start you still get par; if it is below its start, you take the downside (you are effectively delivered the underperformer's loss).
- The Issuer can call the note early on any of the four call dates (at par plus that date's coupon). In our model the note is called once the worst-of recovery reaches 100%, which shortens the average life and caps the stream of coupons.
3. Key Statistics
Annualized metrics (per-simulation, over each path's realized holding period):
| Metric | Structured Product | Underlying EW Basket (total return) |
|---|---|---|
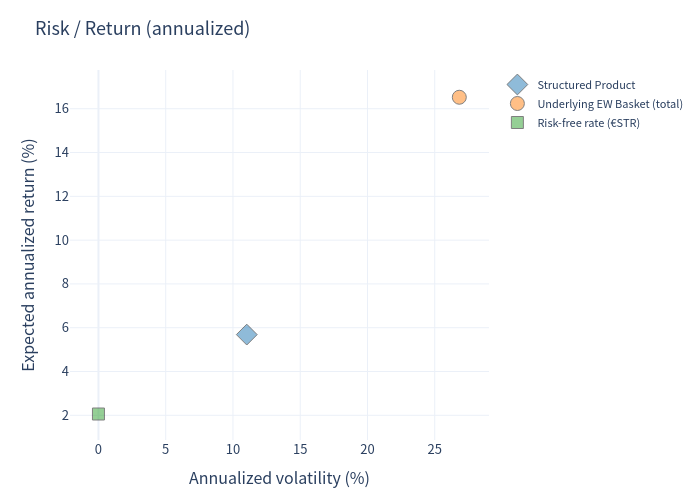
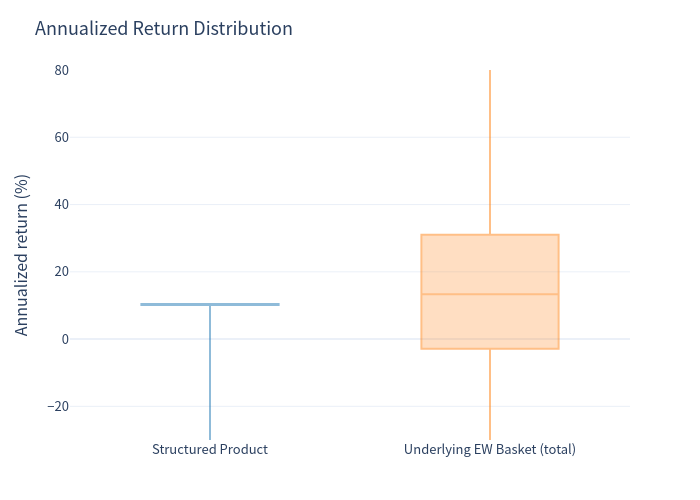
| Expected annualized return (mean) | 5.69% | 16.52%* |
| Median annualized return | 10.40% | 13.34% |
| Expected annualized volatility | 11.03% | 26.83% |
| Probability of loss | 16.05% | 28.55% |
| 99% confidence VaR (1 year) | −32.17% | −30.00% |
| Expect. total return over holding period | 4.07% | 7.70% |
| Expected holding period | 12.4 months | — |
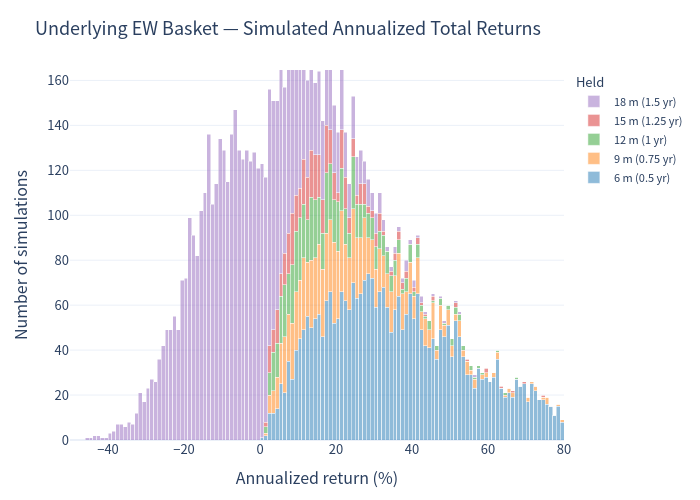
* The basket's mean annualized figure is inflated: early calls happen precisely when the stocks have rallied, so short holding windows are selectively "up," and linear annualization of those short windows overstates the return. A cleaner, fixed 18-month buy-and-hold of the equal-weight basket earns ≈ 7.16% p.a. with ≈ 27% volatility. The product deliberately trades this upside for far lower volatility (11%) and a lower loss probability.
Outcome dynamics
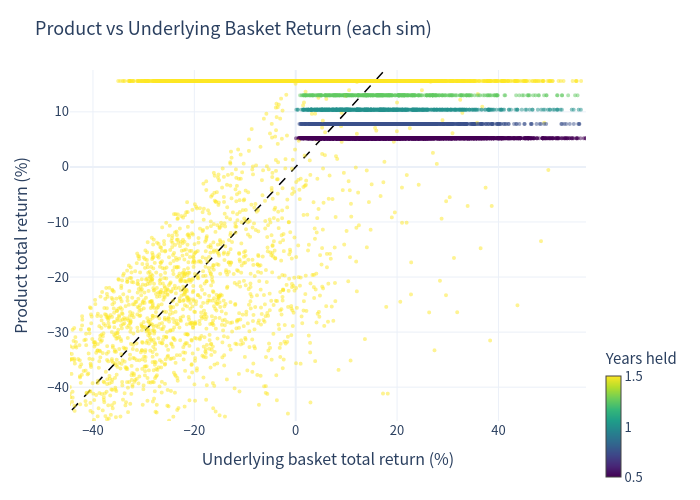
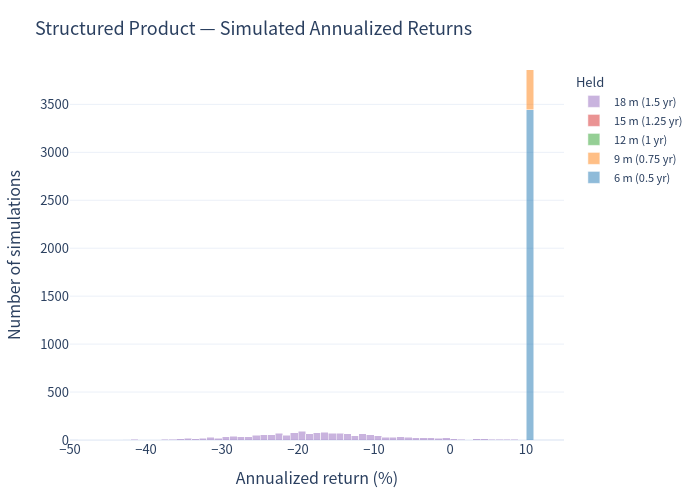
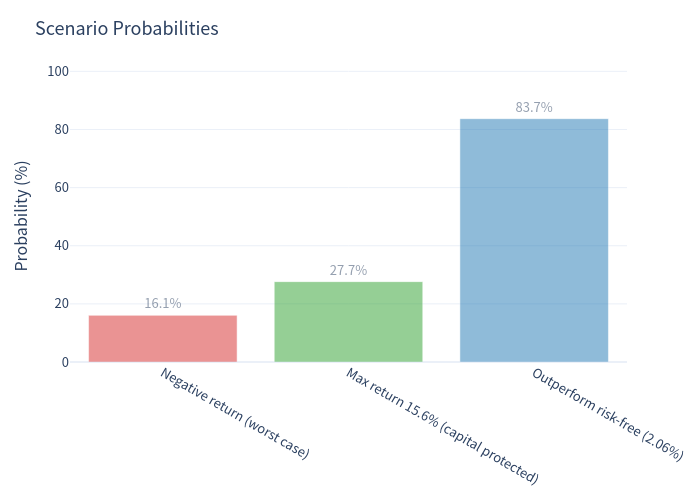
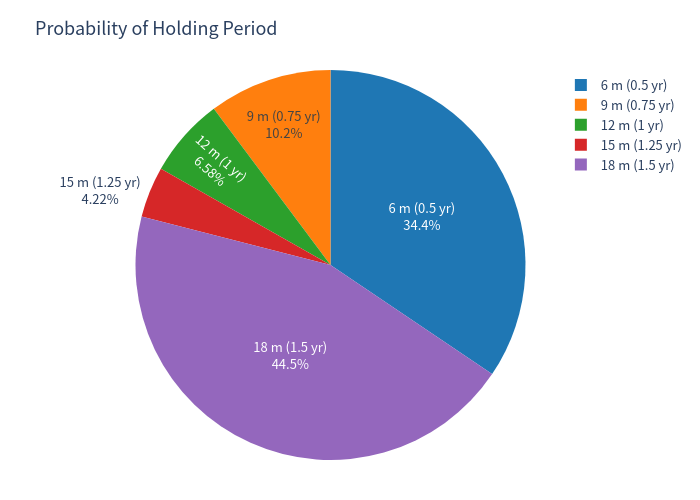
~34% of paths are called at month 6 (total return +5.2%), ~27.7% run to maturity fully protected (+15.6% total), and ~16% breach the barrier and lose money. The median total return is +5.2%, the mean +4.07%, with the 5th percentile at −31.4% and the worst case ≈ −63%.
4. Simulation Charts
Simulation outcomes — product vs underlying
Colour = years held, dashed = 1:1 line.
Distribution of the structured product's annualized returns
Stacked by holding period.
Distribution of the underlying basket's annualized total returns
Stacked by holding period.
Risk / Return trade-off (annualized)
Product versus underlying basket in annualized volatility / return space.
Annualized return box-plot comparison
Distribution comparison between the product and the underlying basket.
Scenario probabilities
Probability weights of the modelled outcome scenarios.
Probability of holding period
Distribution of realized holding periods until call or maturity.
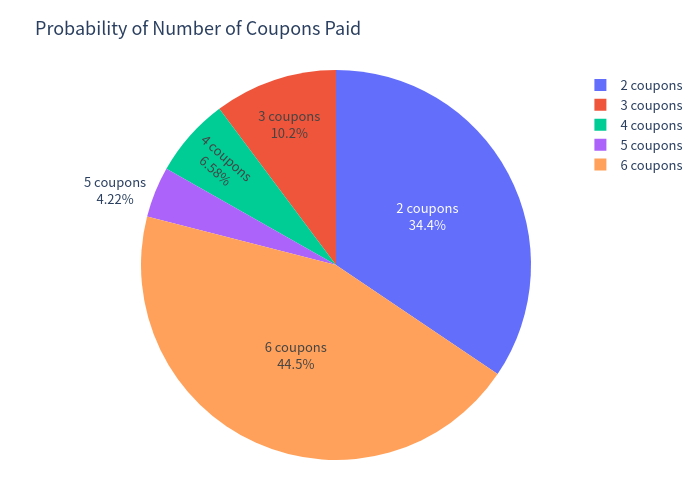
Probability of number of coupons paid
Distribution of how many of the six coupons are ultimately paid.
5. Investment Commentary
Favourable points
- High headline coupon (10.40% p.a.) with coupons paid regardless of performance while the note is alive — an attractive carry versus a ~2.06% euro risk-free rate; about 84% of paths beat the risk-free rate.
- A large 41% barrier cushion on the worst-of: the product returns principal at par in ~83% of paths (only ~17% incur any principal shortfall), and about 27.5% run to maturity completely untouched by either call or barrier, paying the full 15.6% total return.
- Materially lower risk than owning the two stocks directly: annualized volatility ≈ 11% vs ≈ 27%, and loss probability 16% vs ~29%.
Risks to weigh
- Upside is capped at par + coupons (15.6% total over the full 1.5-year life) — no participation in any rally.
- Worst-of + continuous barrier on two volatile pharma names: a single intraday dip of one stock to 59% knocks out protection, and the ~16% loss scenarios can be severe (VaR −32% annualized; worst path ≈ −63%).
- Call risk: the Issuer calls when the trade becomes a liability (modelled at worst-of ≥ 100%), so the strongest up-trends are cut short and the investor gives up the remaining coupons — the average life is only ~12 months.
This is a quantitative simulation-based evaluation for information only and does not constitute financial advice or a suitability assessment.