
Morgan Stanley SX5E Market-Linked Notes due June 30, 2031 — Simulation Analysis
Headline Simulation Results
The notes offer full principal protection at maturity with uncapped upside participation of 115.25% in the EURO STOXX 50® Index. Across 10,000 simulated 5-year scenarios, the notes produced a 0.00% probability of a negative annualized return, a 0.00% 99% confidence 1-year VaR (the 1st percentile of annualized returns for notes held to maturity; principal protection applies only at maturity), and a 49.04% chance of exceeding a 10% annualized return.
Basic Product Information
| Issuer | Morgan Stanley Finance LLC (guaranteed by Morgan Stanley) |
| Underlier | EURO STOXX 50® Index (SX5E), a European blue-chip equity index |
| Participation Rate | 115.25% (final rate set within a 115.25%–125.25% range) |
| Currency / Denomination | USD; $1,000 stated principal amount per note |
| Coupon | None (the notes do not pay interest) |
| Early redemption | None — notes are held to maturity (5 years) |
| Key Dates | Pricing Date: June 25, 2026 | Observation Date: June 25, 2031 | Maturity Date: June 30, 2031 |
How It Works (Layman Explanation)
- You invest $1,000 and hold the note for 5 years. Your final payment is determined only by the EURO STOXX 50 index level on the single observation date (June 25, 2031) compared with its initial level on the pricing date.
- If the index is up (e.g., +20%), you receive $1,000 × (1 + 115.25% × 20%) = $1,230.50 — you capture 115.25% of every percentage point the index gains, with no cap.
- If the index is flat or down (even −50% or −80%), you receive exactly $1,000 back — your principal is fully protected, and your return is 0%.
- There are no coupon payments and no early-exit features along the way; the outcome is known only at maturity.
Key Statistics (Annualized, over simulated 5-year horizon)
| Metric | Structured Product | Underlying (Total Return)* |
|---|---|---|
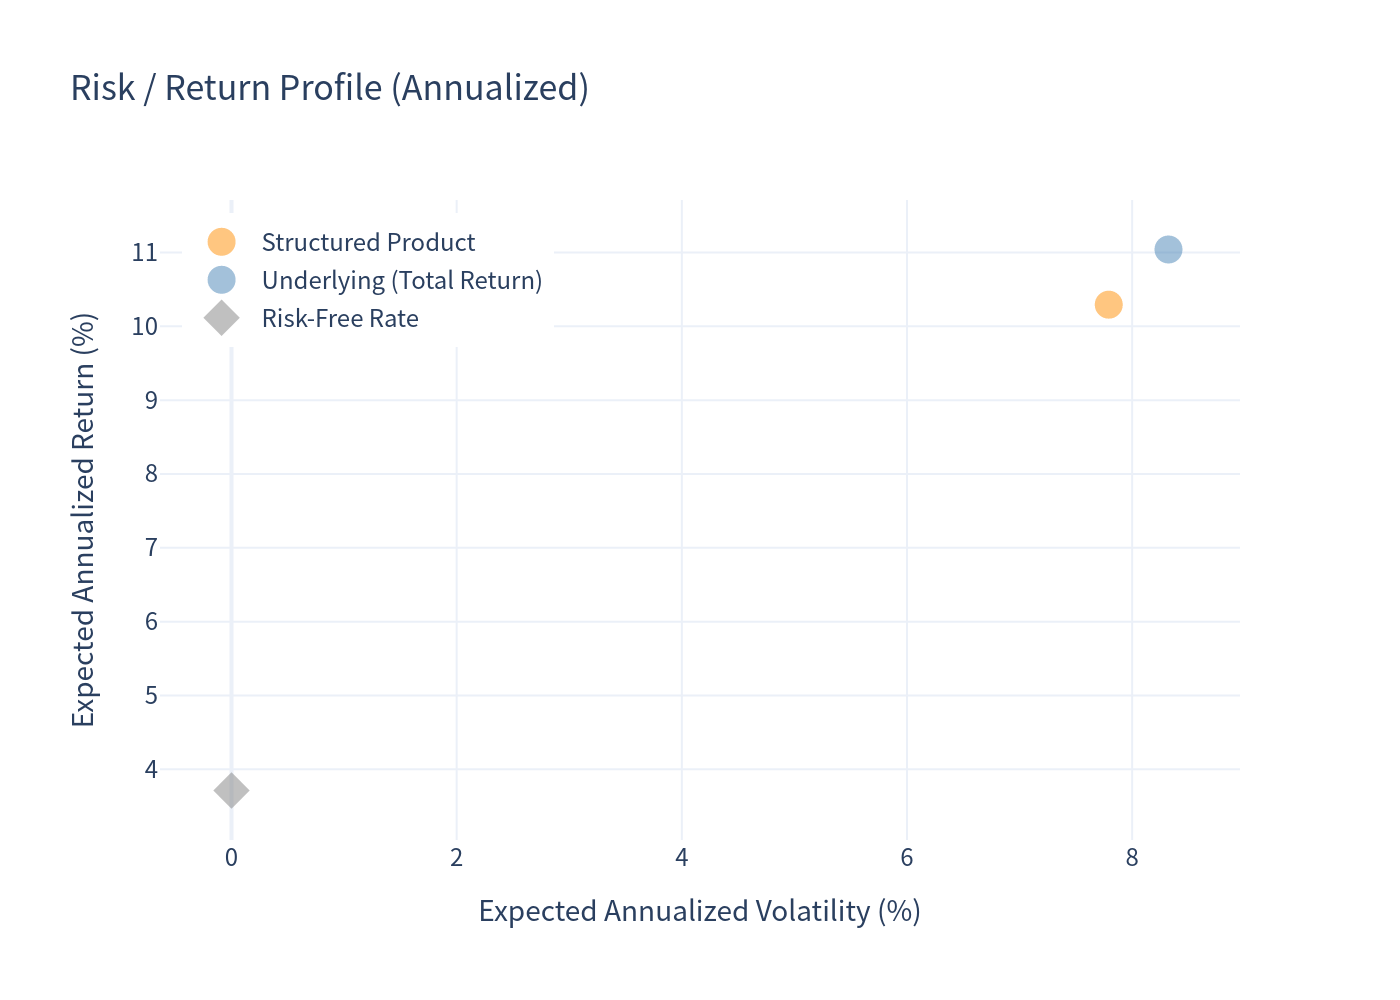
| Expected annualized return | 10.29% | 11.04% |
| Expected annualized volatility | 7.79% | 8.32% |
| Probability of loss | 0.00% | 9.47% |
| 99% confidence VaR (1 year) | 0.00% | -9.78% |
| Expected total return (5-year term) | 71.66% | 71.83% |
*Underlying total return includes an estimated dividend yield of 2.56%.
The structured product delivers a similar expected annualized return to the underlying (total-return basis) but with zero downside risk, lower return volatility (7.79% vs 8.32%), and no probability of loss. The trade-off is that the note captures only 115.25% of upside moves and does not pay dividends.
Charts
Simulation Outcomes (Scatter)
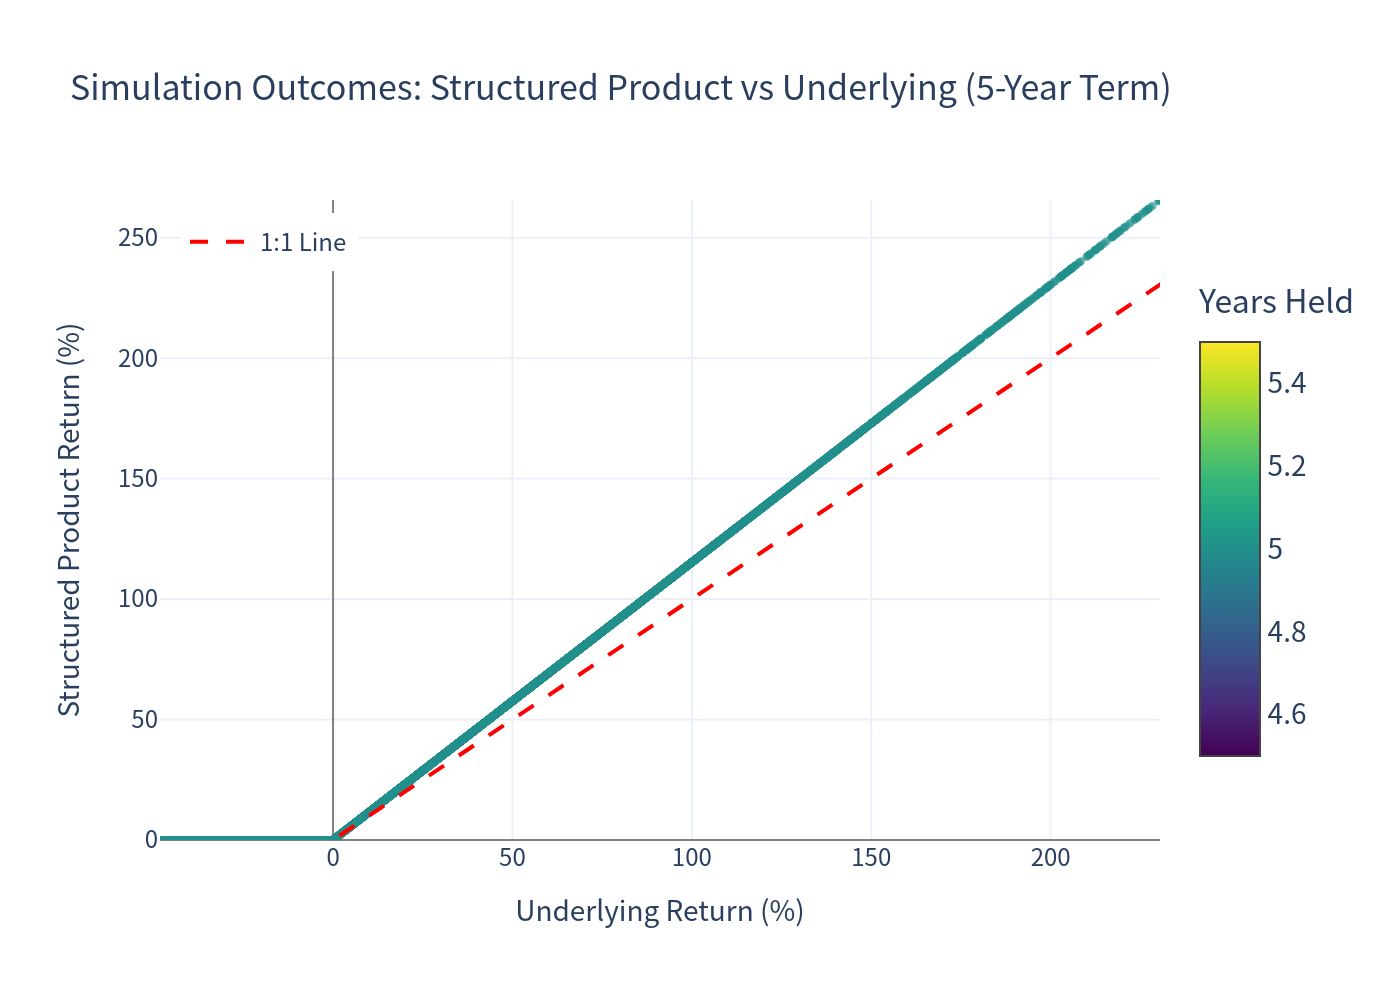
Each dot is one simulated 5-year scenario: the structured product's total return versus the EURO STOXX 50 index's total return. Points above the red 1:1 line show where the note outperformed the index. Note the floor at 0% product return — every scenario with a negative index return still pays 100% of principal.
Annualized Return Distributions (Histograms)
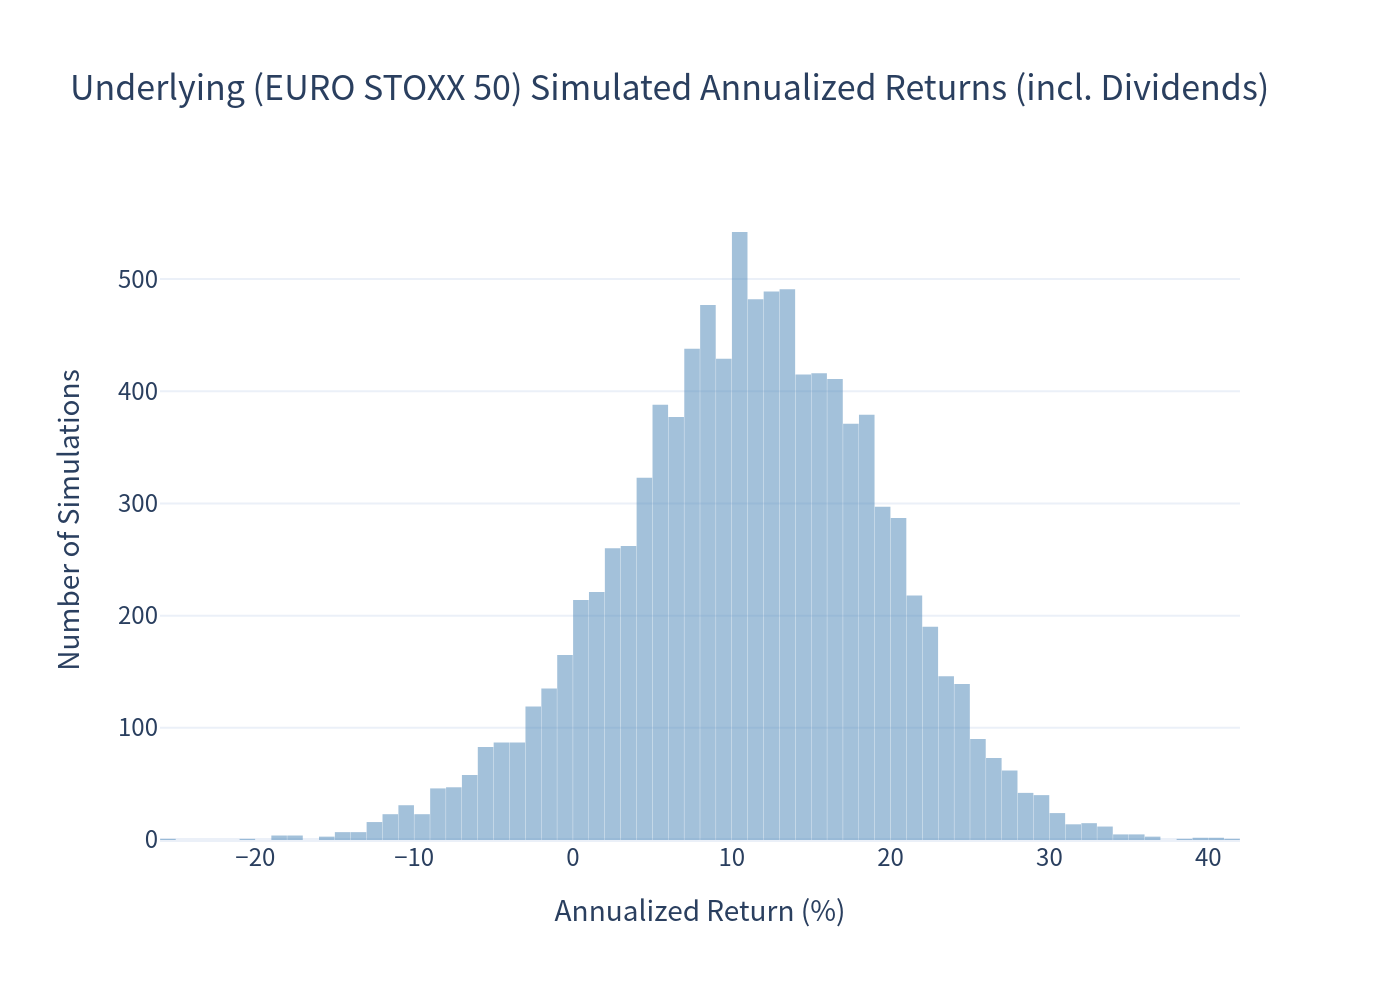
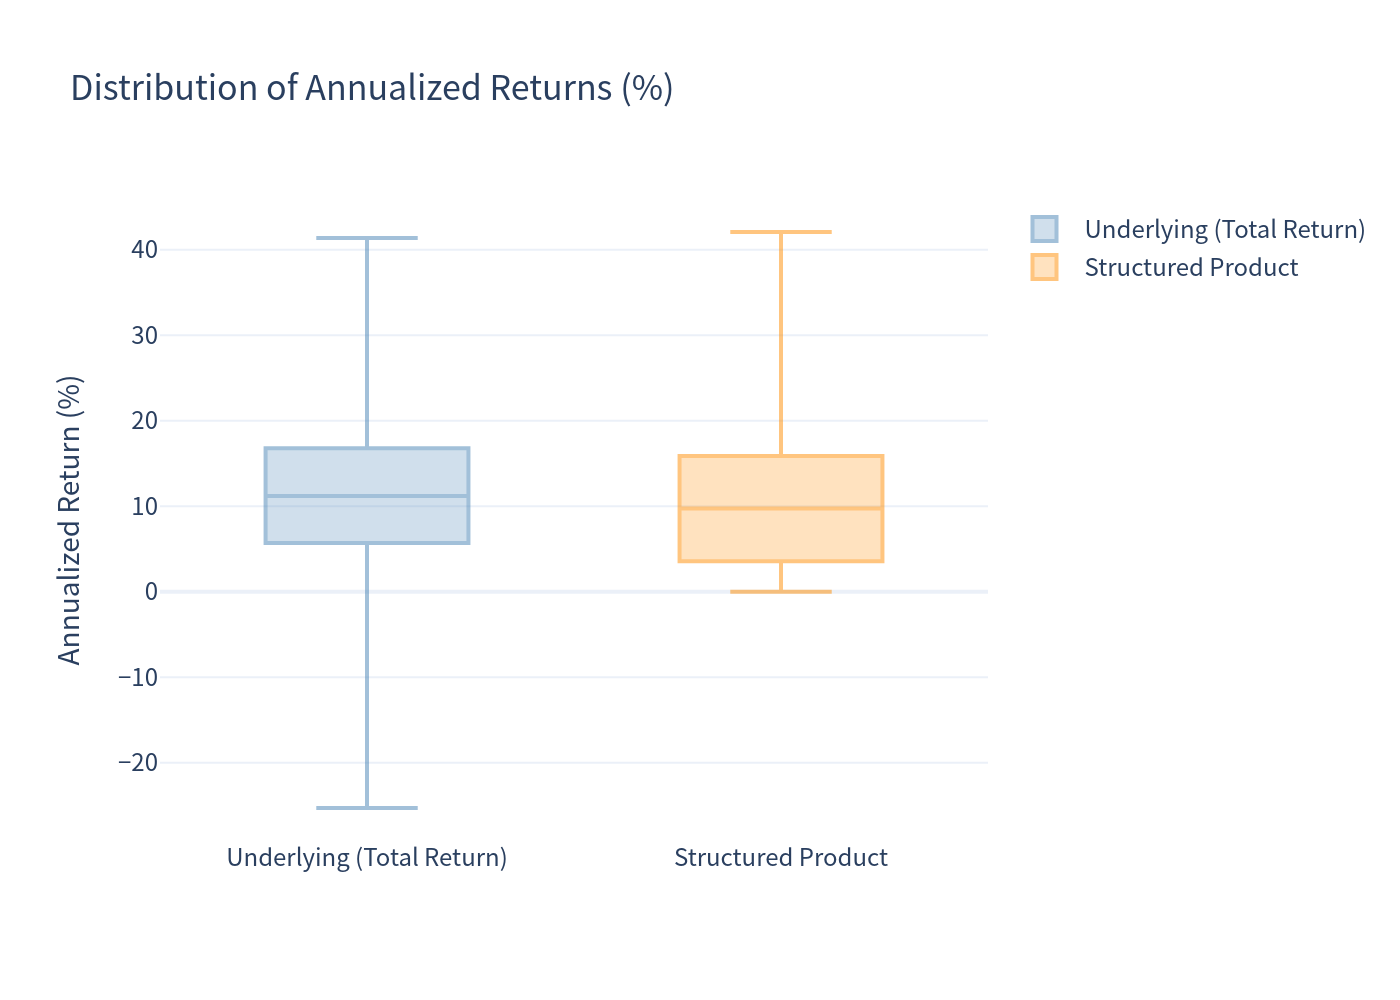
The underlying's simulated annualized returns (total return, incl. dividends) are broadly distributed, with a 99% 1-year VaR of -9.78% and a 9.47% probability of a loss.
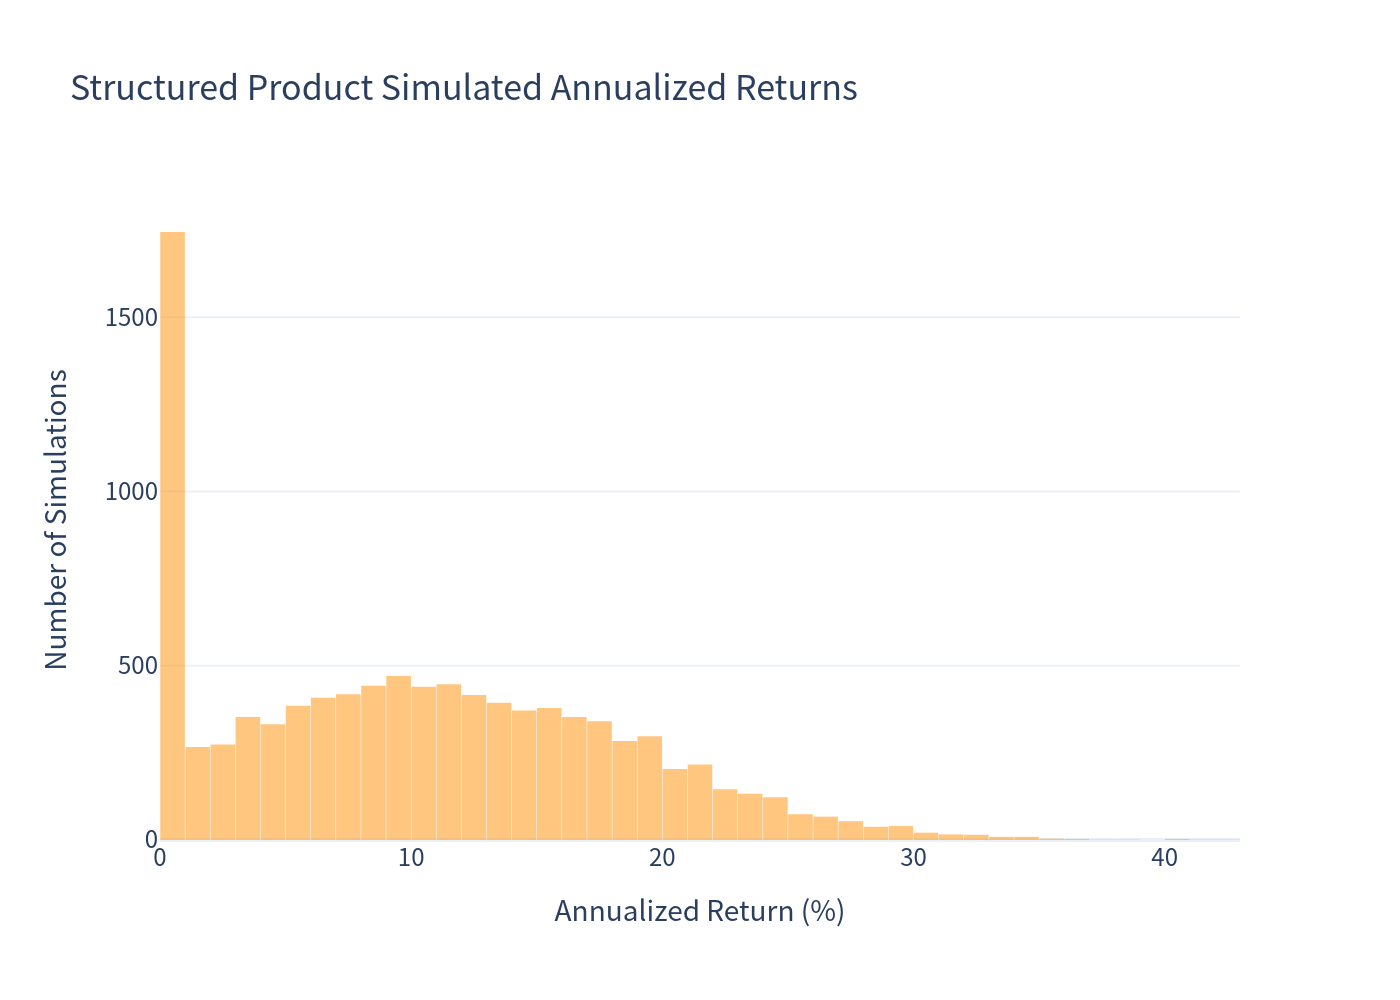
The structured product's annualized return distribution is truncated at 0% (no losses) with upside participation in index gains; the median annualized return is 9.74% and the 10th–90th percentile range is 0.00% to 20.87%.
Scenario Probabilities
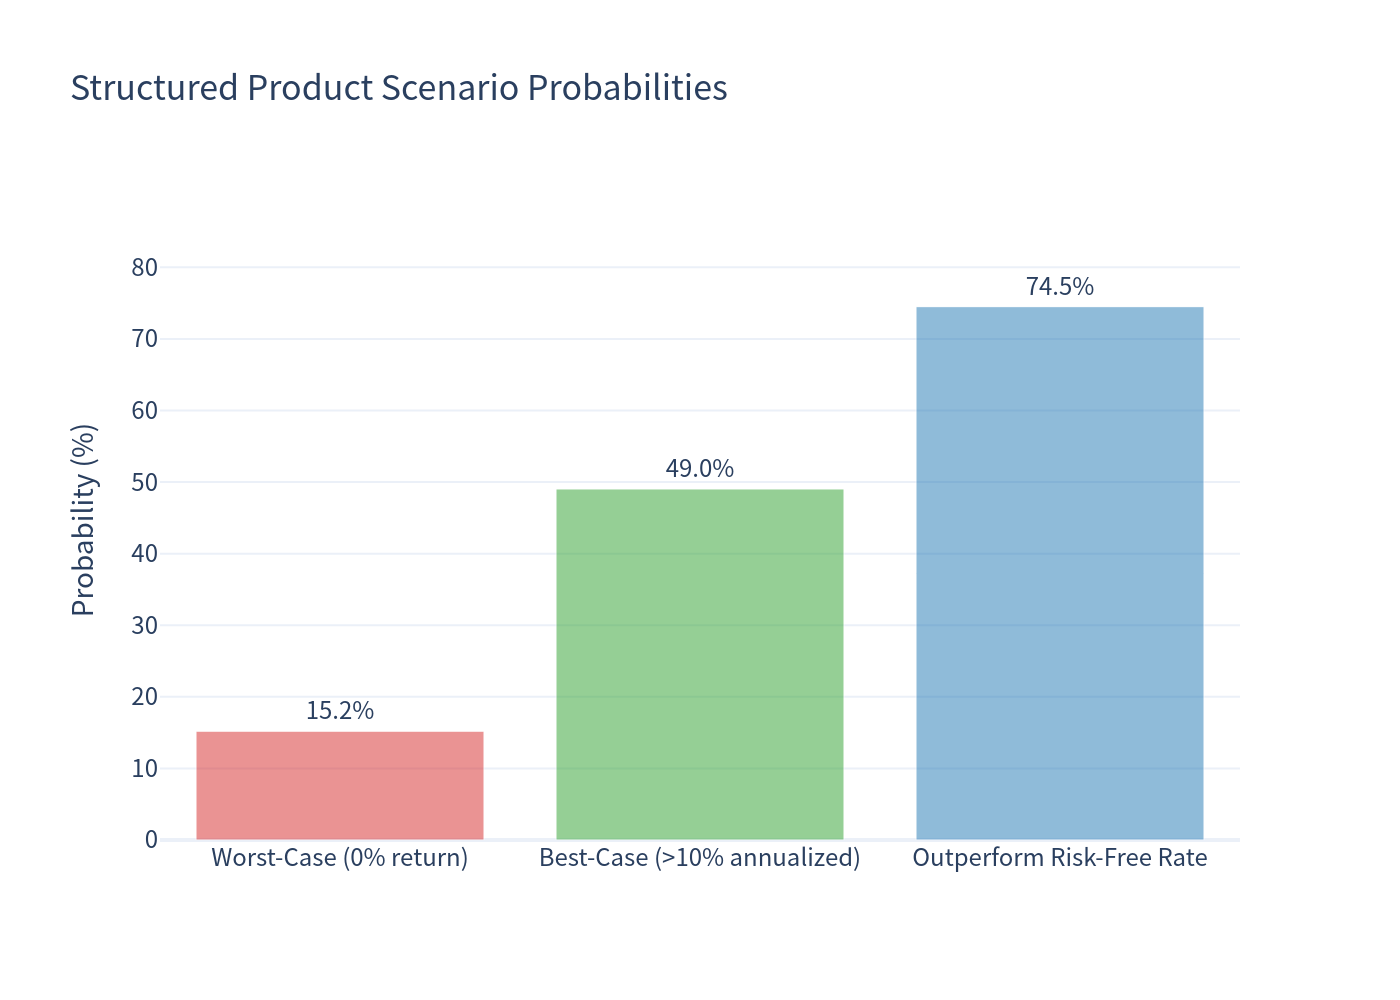
- Worst case (0% return): 15.20% chance — occurs when the index finishes at or below its initial level.
- Best case (>10% annualized): 49.04% chance.
- Outperforming the risk-free rate (3.71%): 74.51% chance.
Risk / Return Profile
The structured product offers a return/volatility profile comparable to direct index investment (total-return basis) but with the downside floor removed.
Return Distribution Comparison (Box Plot)
Investment Commentary
Strengths of this structure:
- Full downside protection: principal is returned in full at maturity regardless of how far the EURO STOXX 50 index falls — the simulated probability of a loss is 0.00%.
- Uncapped upside participation: 115.25% participation in index gains with no cap, giving the note a convex, call-like payoff profile.
- Favorable risk-adjusted profile: expected annualized return of 10.29% with an expected volatility of only 7.79%, and a 74.51% probability of beating the risk-free rate of 3.71%.
- Simple, transparent structure: a single observation date at maturity; no coupons or early-exit features to track.
Considerations:
- The note does not pay any income and returns 0% whenever the index is flat or lower at maturity — effectively the "cost" of the principal protection.
- The estimated value disclosed in the offering documents (about $941.80 per note) is below the $1,000 issue price, reflecting structuring and distribution costs that reduce the economic terms of the note.
- The payoff depends solely on the index level on the final observation date; interim index movements do not affect the payout.