
Morgan Stanley Jump Notes with Auto-Callable Feature — Simulation Analysis
Headline Simulation Results
| Metric | Value |
|---|---|
| Expected annualized return | 7.42% |
| Probability of negative return | 0.00% |
| 99% confidence VaR (1 year) | 0.00% |
| Expected total return (over realized holding period) | 10.46% |
| Expected holding period | 1.73 years |
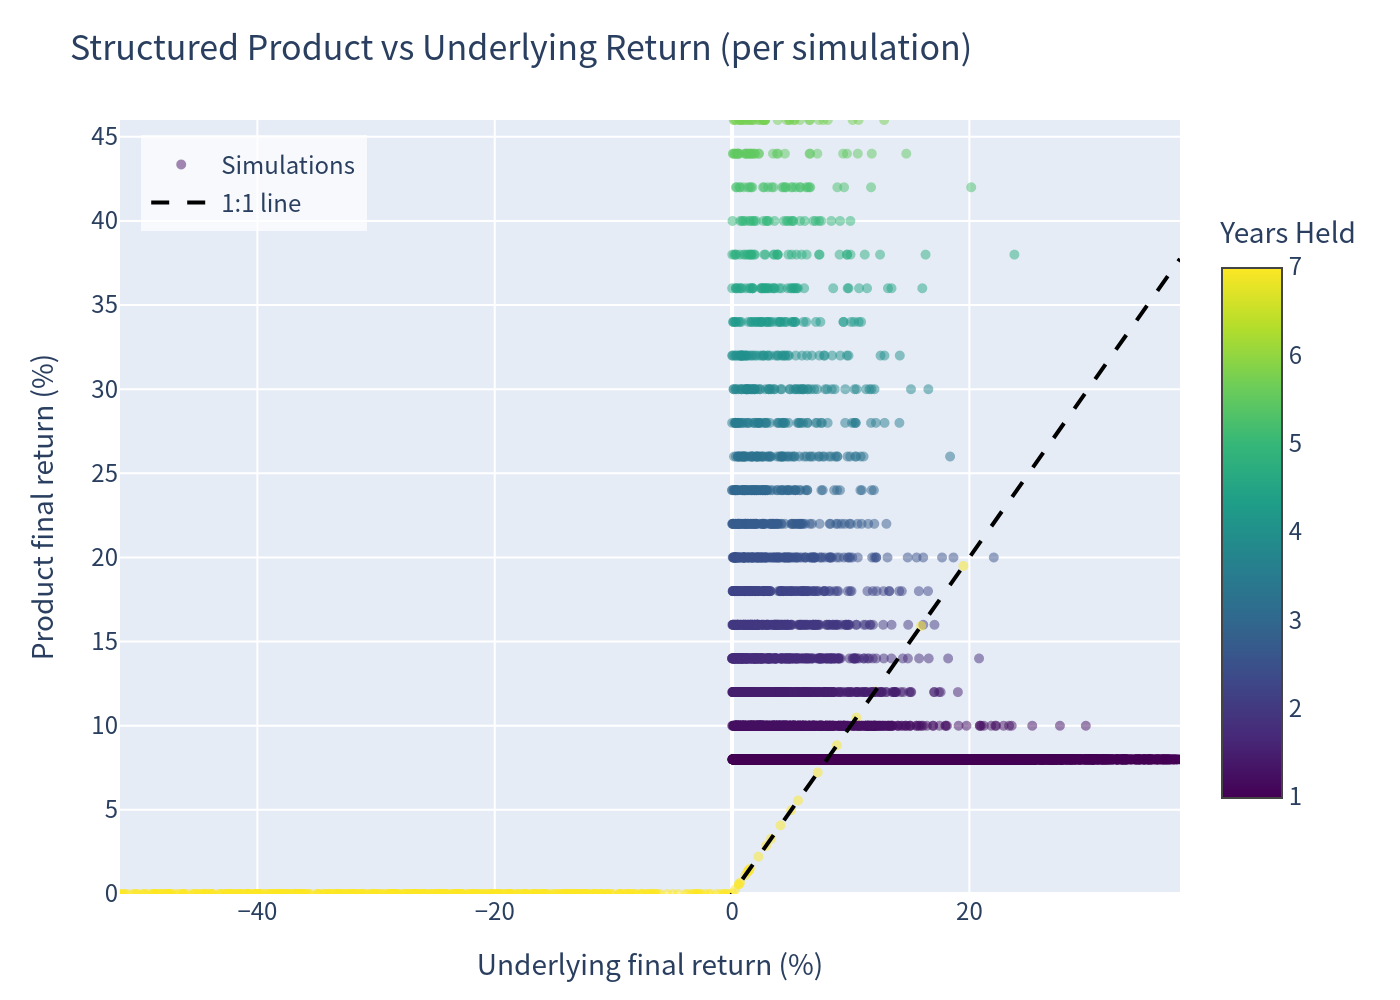
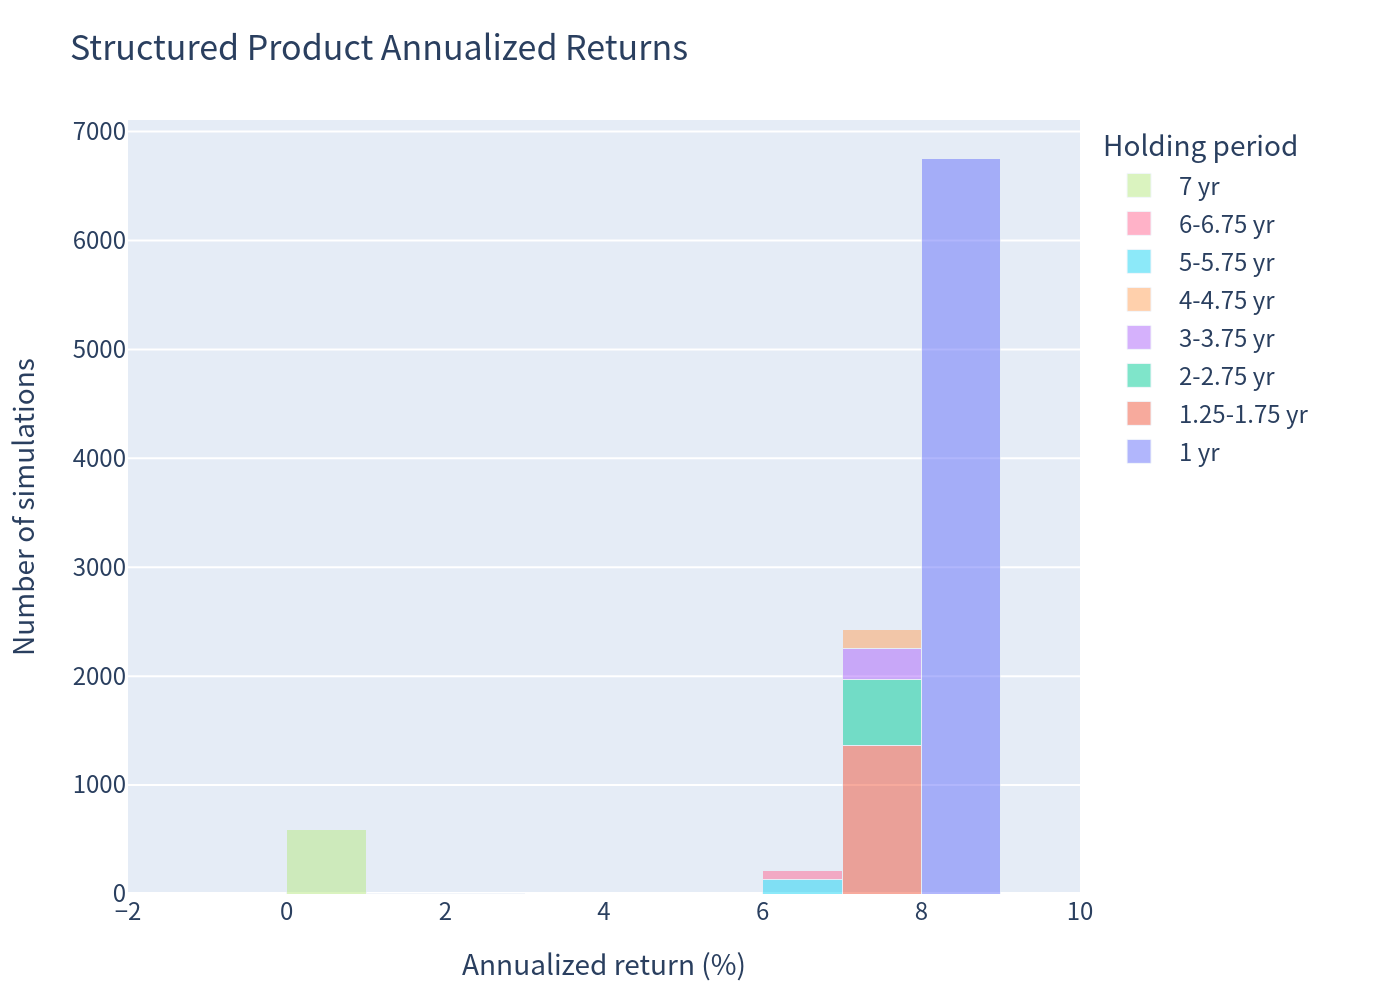
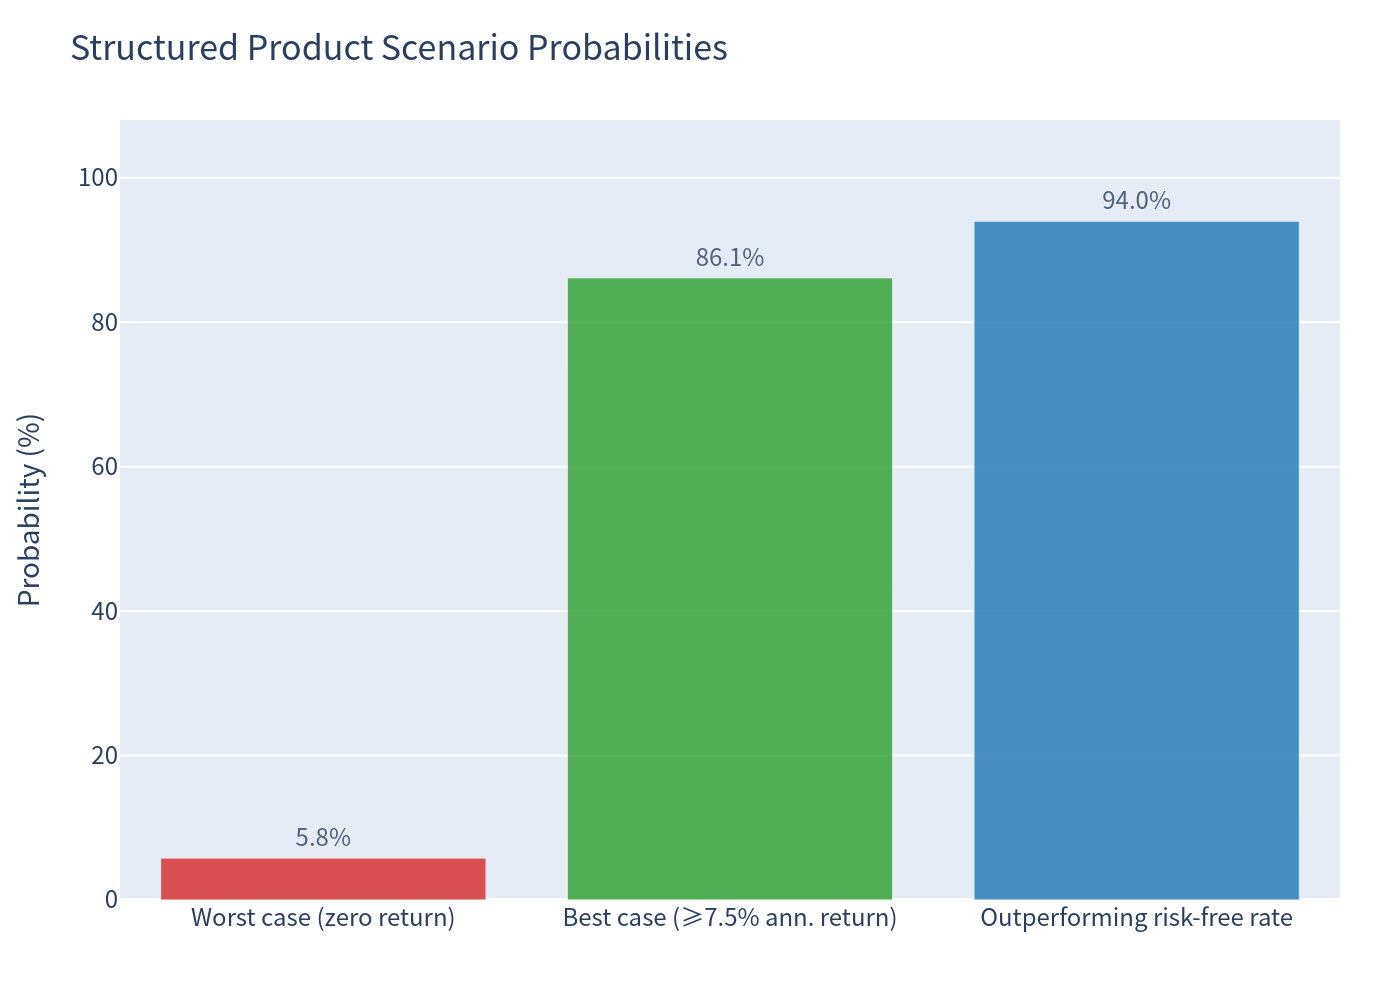
This is a principal-protected note — it never lost money in 10,000 simulated scenarios. The worst outcome is a 0% return (5.80% probability), which occurs when the note is never auto-called and the underlier finishes at or below its initial level at maturity. The best outcome observed in the simulations is an 8.00% annualized return, earned when the note is auto-called after one year.
Product Summary
How It Works (layman's explanation)
This is a "Jump Note" — a 7-year structured note linked to a single equity index (the S&P U.S. Equity Momentum 40% VT 4% Decrement Index).
- No coupons: the note pays no periodic interest.
- Automatic early redemption (auto-call): Starting 12 months after issue, if the underlier is at or above its initial level on any quarterly observation date, the note is redeemed early. The redemption payment grows over time at roughly 8.00% per annum (e.g., $1,080 per $1,000 note at year 1, rising by $20 every quarter to $1,540 by year 7).
- If never auto-called: at maturity (year 7), the investor receives the stated principal amount plus 100% of any index appreciation if the underlier finishes above its initial level; otherwise, only the principal amount is returned.
- Principal protection: the payment is never less than the stated principal amount ($1,000 per note) — there is no barrier, knock-in, or downside participation.
Because the redemption payments effectively cap the practical upside at ~8% per year whenever the note is called, the investor trades away participation in large index rallies in exchange for principal protection and a high-probability fixed-return stream.
Key Statistics — Structured Product vs Underlying
| Metric | Structured Product | Underlying (Decrement Index) |
|---|---|---|
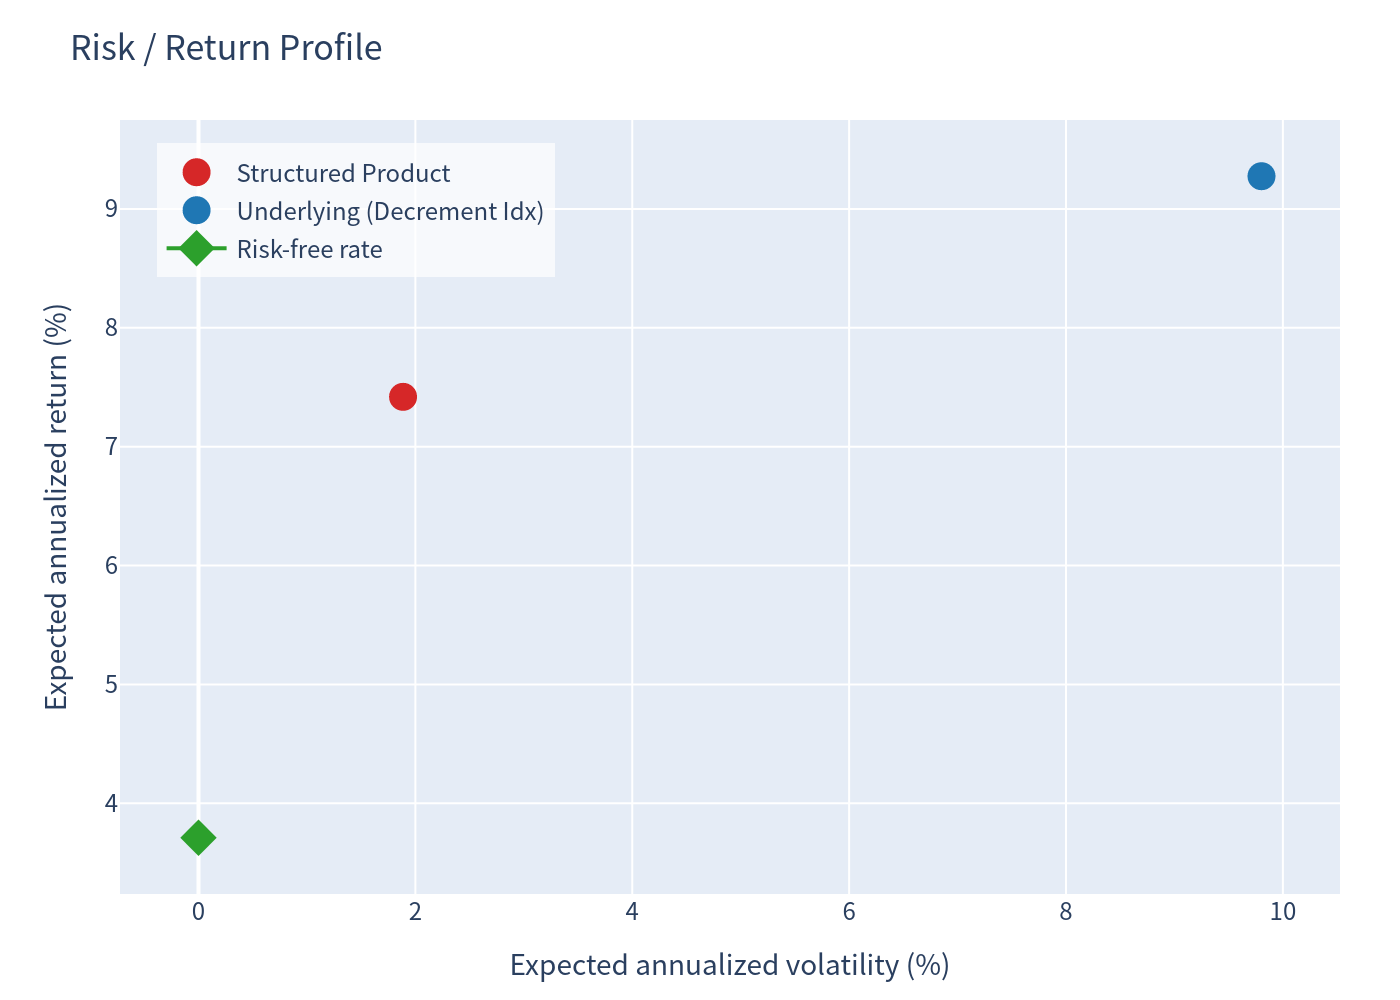
| Expected annualized return | 7.42% | 9.28% |
| Expected annualized volatility | 1.89% | 9.80% |
| Probability of loss | 0.00% | 5.79% |
| 99% confidence VaR (1 year) | 0.00% | -9.84% |
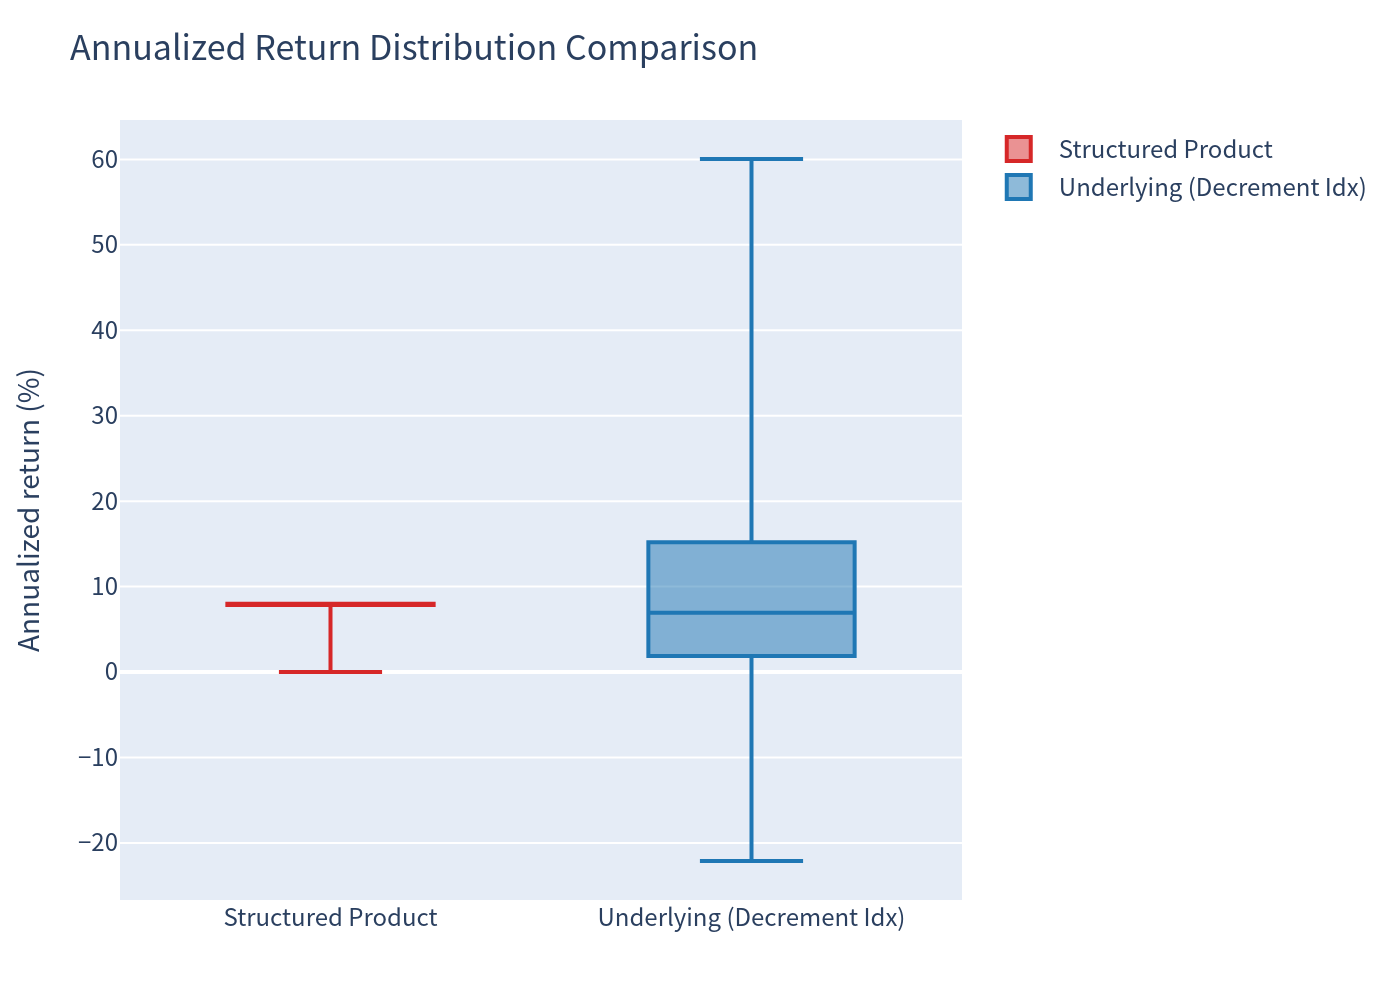
| Median annualized return | 8.00% | 6.94% |
| Best observed annualized return | 8.00% | 60.00% |
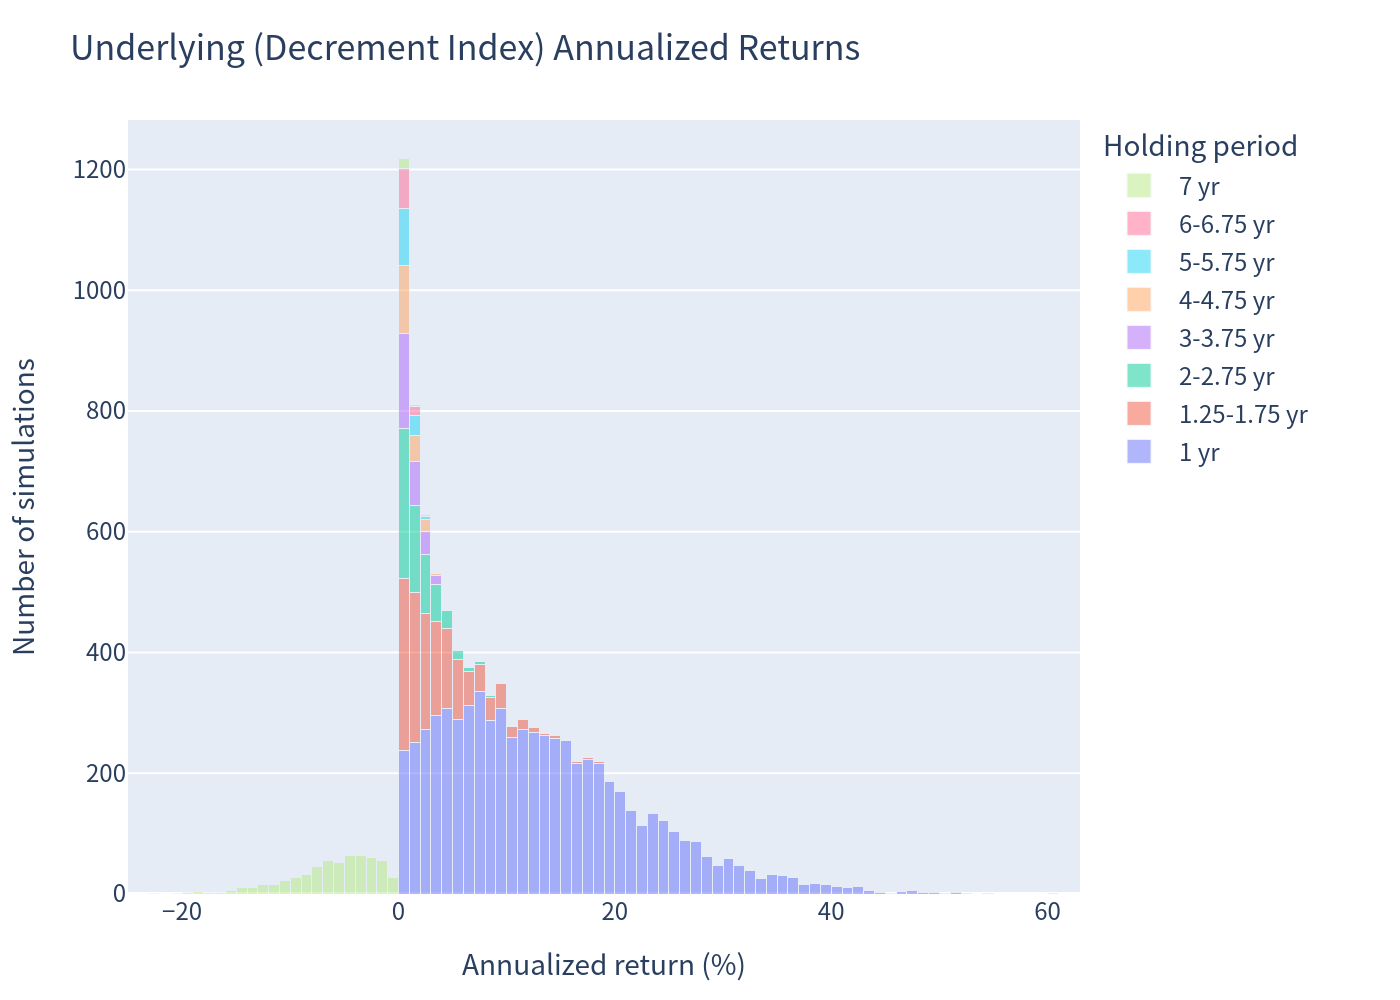
| Worst observed annualized return | 0.00% | -22.10% |
Notes on interpretation:
- The underlying comparison uses the same holding horizon as the note in each simulation (the note's return is compared to the index return over the identical period). Because ~94% of simulations are auto-called early (which requires the index to be above its initial level at the call date), the average underlying return shown (9.28%) is conditioned on these early-exit scenarios.
- The risk-free rate used for comparison is 3.71% (1-year average T-bill rate).
- The underlier is a synthetic decrement index (4% per annum deduction); it does not pay dividends, so no separate dividend adjustment is applied to the benchmark.
- The maturity payoff is contractually uncapped (100% participation if the index finishes above its initial level). In practice — and in all 10,000 simulations — the observed maximum annualized return was 8.00%, because any index path strong enough to deliver more would normally have already triggered an earlier auto-call. The best maturity-only scenario produced a 2.58% annualized return.
Auto-Call and Holding Period Behaviour
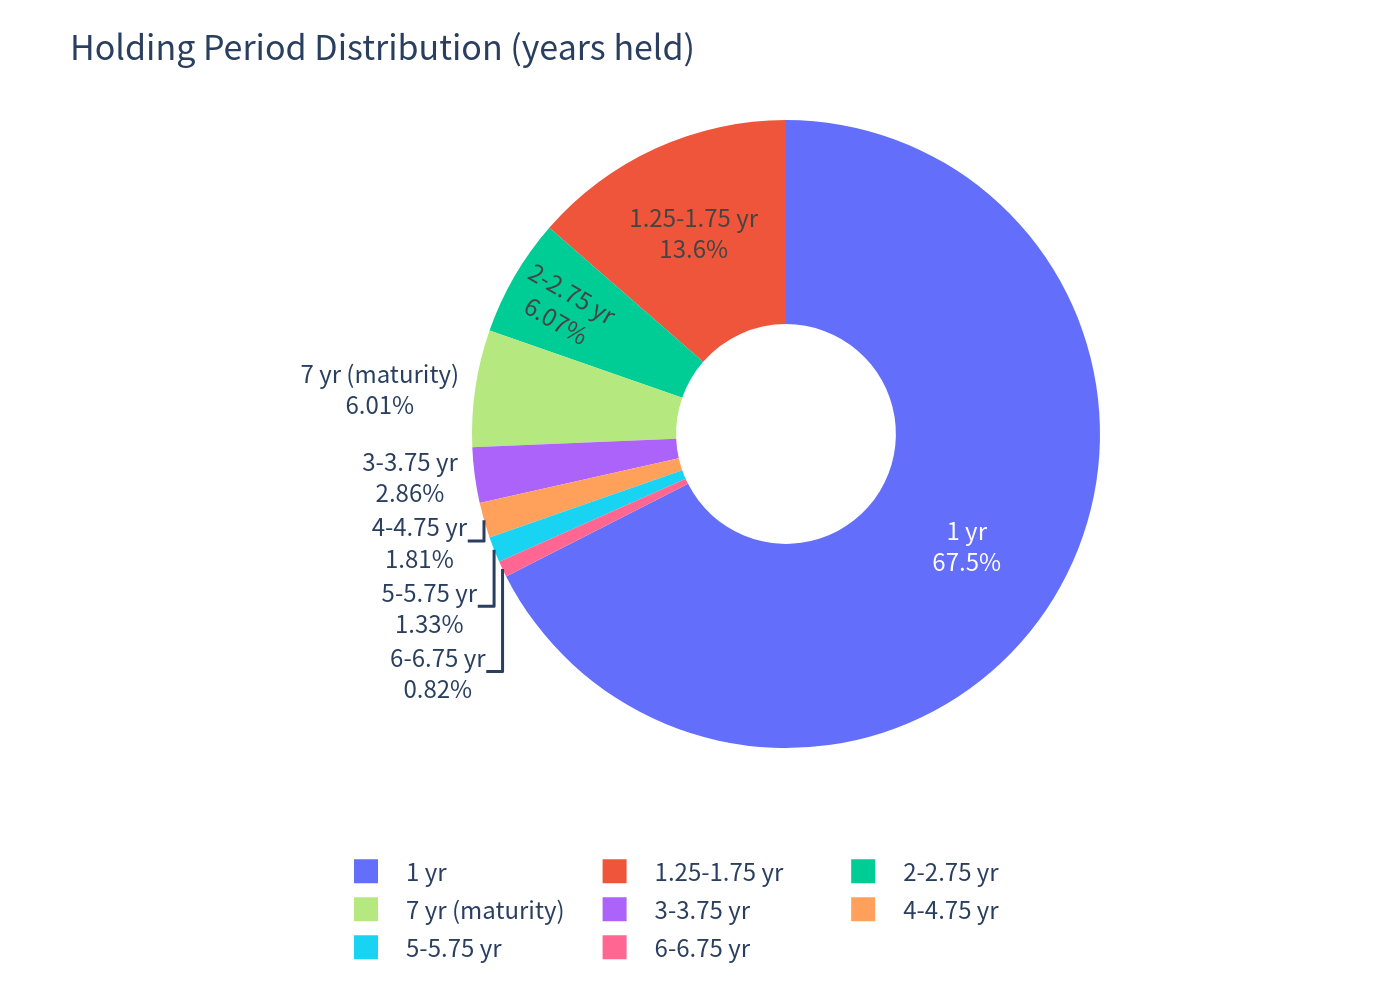
- Auto-call probability: 93.99%
- Called in year 1 (month 12): 67.51%
- Called in year 2 (months 15–24): 15.54%
- Called in years 3–6 (months 27–72): 10.27%
- Called in year 7 (months 75–81): 0.67%
- Reaches maturity (7 years): 6.01%
- Expected holding period: 20.73 months (1.73 years)
Charts
Simulation Outcomes — Product vs Underlying Return
Each dot is one simulation, colored by how many years the note was held. The dashed 1:1 line shows where the product return would equal the underlying return.
Annualized Return Histograms
Distribution of simulated annualized returns (1% bins), colored by holding period.
Scenario Probabilities
Probability of the worst case (zero return), best case (≥7.5% annualized return), and outperforming the risk-free rate.
Risk / Return Profile
Annualized Return Distribution — Box Plot Comparison
Holding Period Distribution
Investment Commentary
Pros
- Principal protection: the maturity payment is never below the stated principal amount — no downside participation, barrier, or knock-in risk.
- High probability of a fixed ~8% per annum return: 93.99% of simulations are auto-called, and 86.14% achieve an annualized return of at least 7.5%.
- Uncapped upside at maturity (100% participation) in the scenario where the note is not called and the index finishes above its initial level.
- Low realized volatility of outcomes: the annualized-return distribution is tightly clustered (volatility 1.89%).
Cons
- Effectively capped upside: whenever the note is auto-called, the investor forfeits participation in further index appreciation. In simulations the maximum annualized return was 8.00%; the contractual uncapped maturity payoff was not reached in any scenario.
- Zero-return scenario: if the note is never called and the index ends at or below its initial level at maturity, the return is 0% over up to 7 years (a significant opportunity cost versus the risk-free rate).
- Index drag: the underlier carries a 4% per annum decrement, making it harder for the index to climb back above its initial level and trigger an auto-call.
- Issuer credit risk: payments are unsecured obligations of Morgan Stanley Finance LLC (guaranteed by Morgan Stanley).
This analysis is for information only and does not constitute financial advice or a suitability assessment.