
Market-Linked Certificate of Deposit
Morgan Stanley Bank, N.A.
| Metric | Structured Product | Underlying Benchmark* |
|---|---|---|
| Expected annualized return | 5.33% | 9.83% |
| Expected total return (5-yr holding period) | 30.68% | 58.19% (price) / 61.50% (total) |
| Expected annualized volatility | 3.02% | 7.35% |
| Probability of negative return | 0.00% | 9.57% |
| 99% confidence VaR (1 year) | 0.00% | −8.22% |
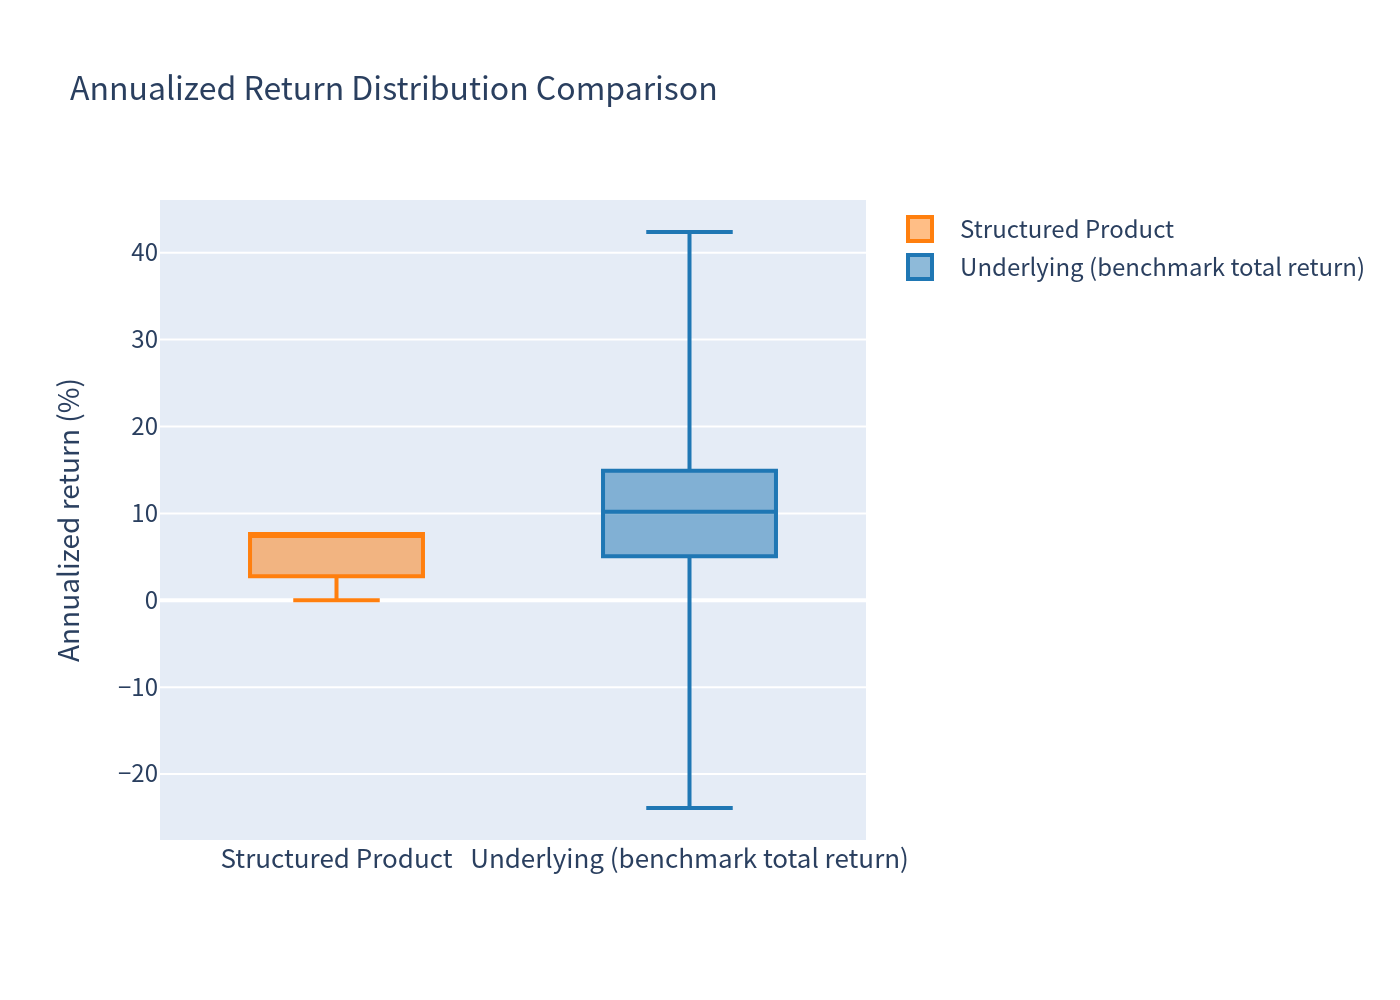
| Median annualized return | 7.64% | 11.27% |
*Benchmark = equal-weight basket of the Dow Jones Industrial Average and S&P 500, total return including dividends (≈1.19% p.a.).
Key takeaways
- The CD is principal-protected: in all 10,000 simulated scenarios the investor receives at least the full deposit amount — there is zero probability of loss when held to maturity.
- Expected annualized return is 5.33%; expected total return over the fixed 5-year holding period is 30.68%.
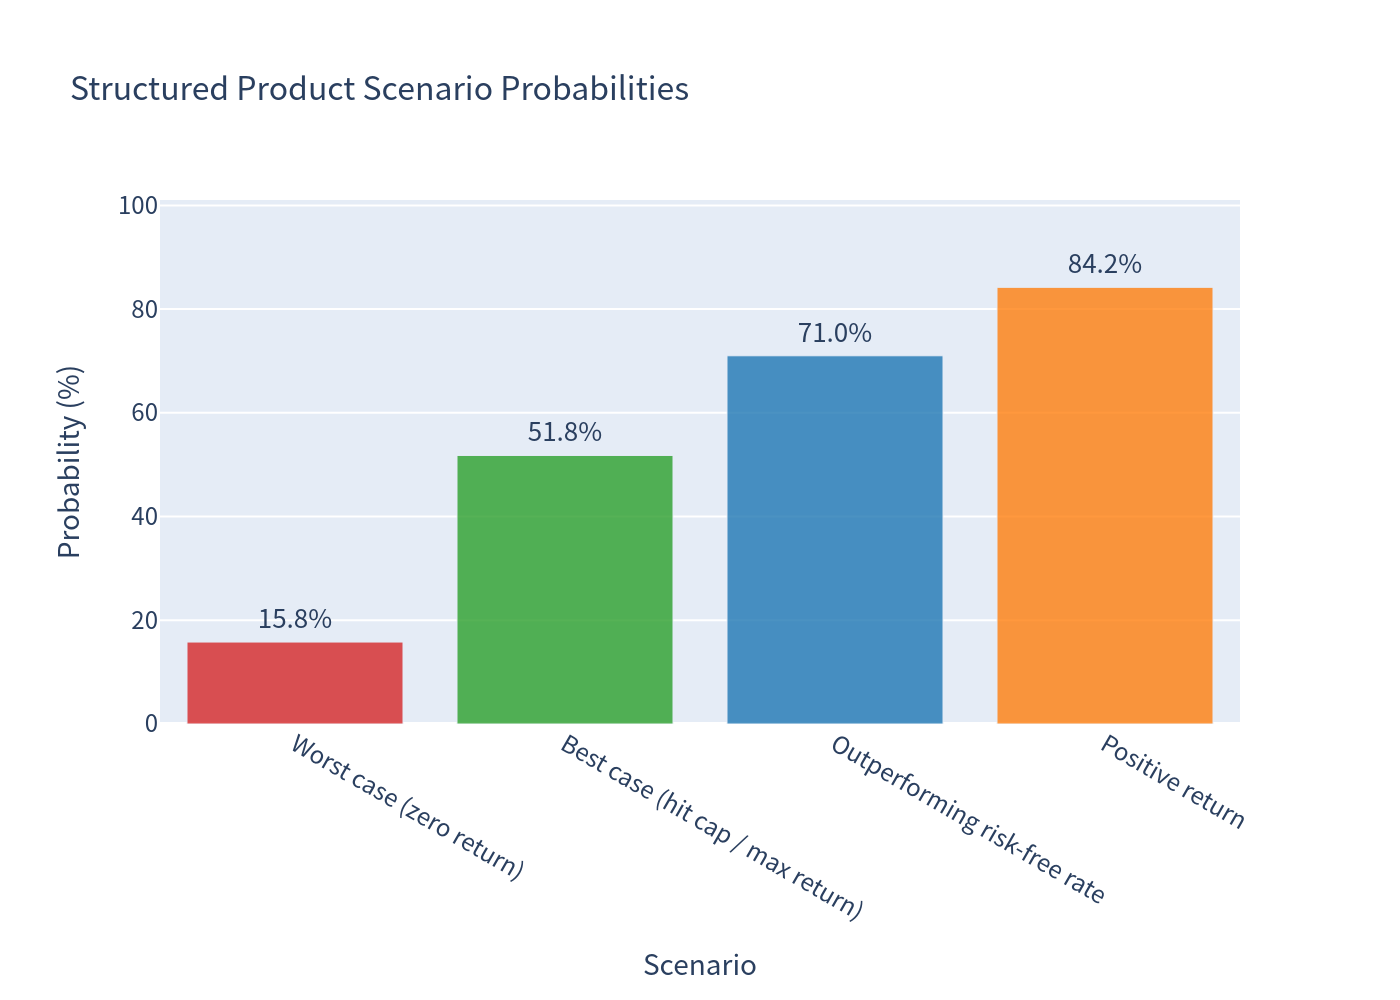
- In 84.2% of scenarios the product pays a positive return; in 15.8% it pays only the deposit (zero return).
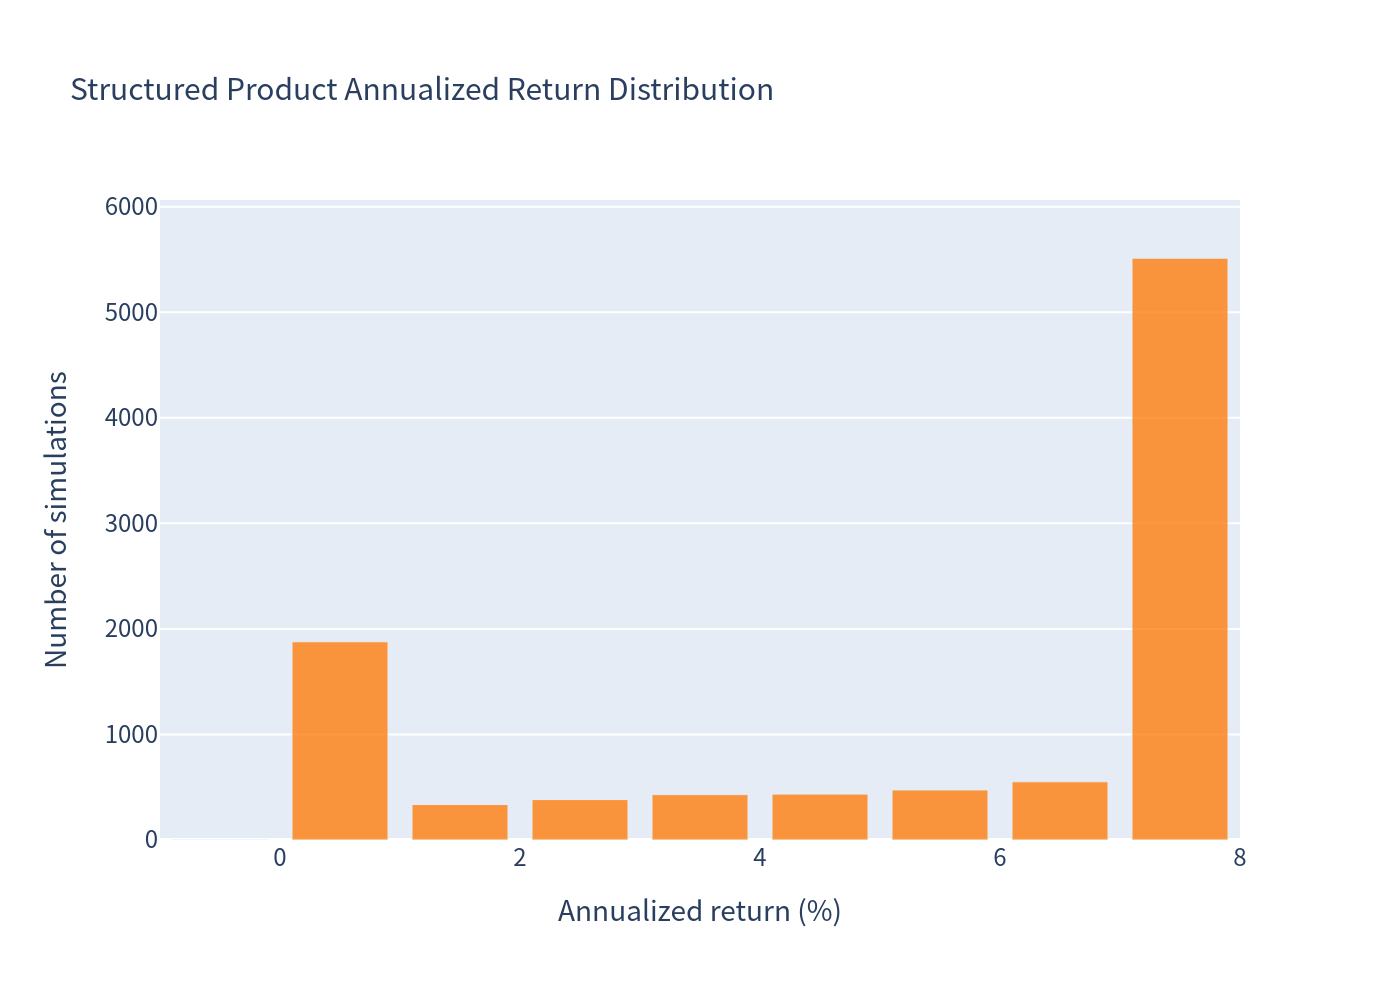
- In 51.8% of scenarios the product hits its maximum payment cap (144.5% of deposit assumed).
- The 1-year 99% VaR is 0.00%, reflecting full principal protection (FDIC-insured up to applicable limits).
What it is: A Market-Linked Certificate of Deposit issued by Morgan Stanley Bank, N.A. — a 5-year FDIC-insured time deposit of $1,000 per CD that pays no regular interest. Instead, its return at maturity is linked to the performance of the worst performing of the Dow Jones Industrial Average and the S&P 500.
How it works (layman's explanation)
- You deposit $1,000. The CD runs for 5 years (issue Aug 31, 2026 → maturity Aug 29, 2031).
- At maturity, the starting and ending levels of both indices are compared.
- If both indices end above their starting levels, you get your $1,000 back plus 100% of the gain of the weaker-performing index — but only up to a maximum payment of 144.5% of the deposit (assumed midpoint of the stated 142%–147% range; the exact cap is set on the pricing date). This equates to a maximum +44.5% total return (≈+7.64% annualized).
- If either index ends flat or down, you simply get your $1,000 back — no gain, no loss.
- There are no coupon payments, no early-redemption (autocall) features, and no downside barrier — the product is always held to its full 5-year maturity, and the deposit is returned in every scenario.
| Product type | Principal-protected, worst-of digital call with capped upside |
|---|---|
| Underlyings | Dow Jones Industrial Average (^DJI) and S&P 500 (^SPX) |
| Coupon | None |
| Upside capped | Yes (assumed 44.5% total) |
| Early termination | None |
| Barrier | None |
| Metric | Structured Product | Underlying Benchmark* |
|---|---|---|
| Expected annualized return | 5.33% | 9.83% |
| Expected annualized volatility | 3.02% | 7.35% |
| Probability of negative return | 0.00% | 9.57% |
| Probability of zero return (deposit only) | 15.80% | — |
| Probability of positive return | 84.20% | 90.43% |
| Probability of hitting the cap | 51.78% | — |
| Probability of outperforming risk-free (3.71%) | 71.00% | — |
| 99% confidence VaR (1 year) | 0.00% | −8.22% |
| Expected holding period | 60 months (fixed) | 60 months |
| Number of coupons paid | 0 | — |
*Benchmark total return includes an estimated dividend yield of ≈1.19% p.a. (average of DIA 1.37% and SPY 1.01%).
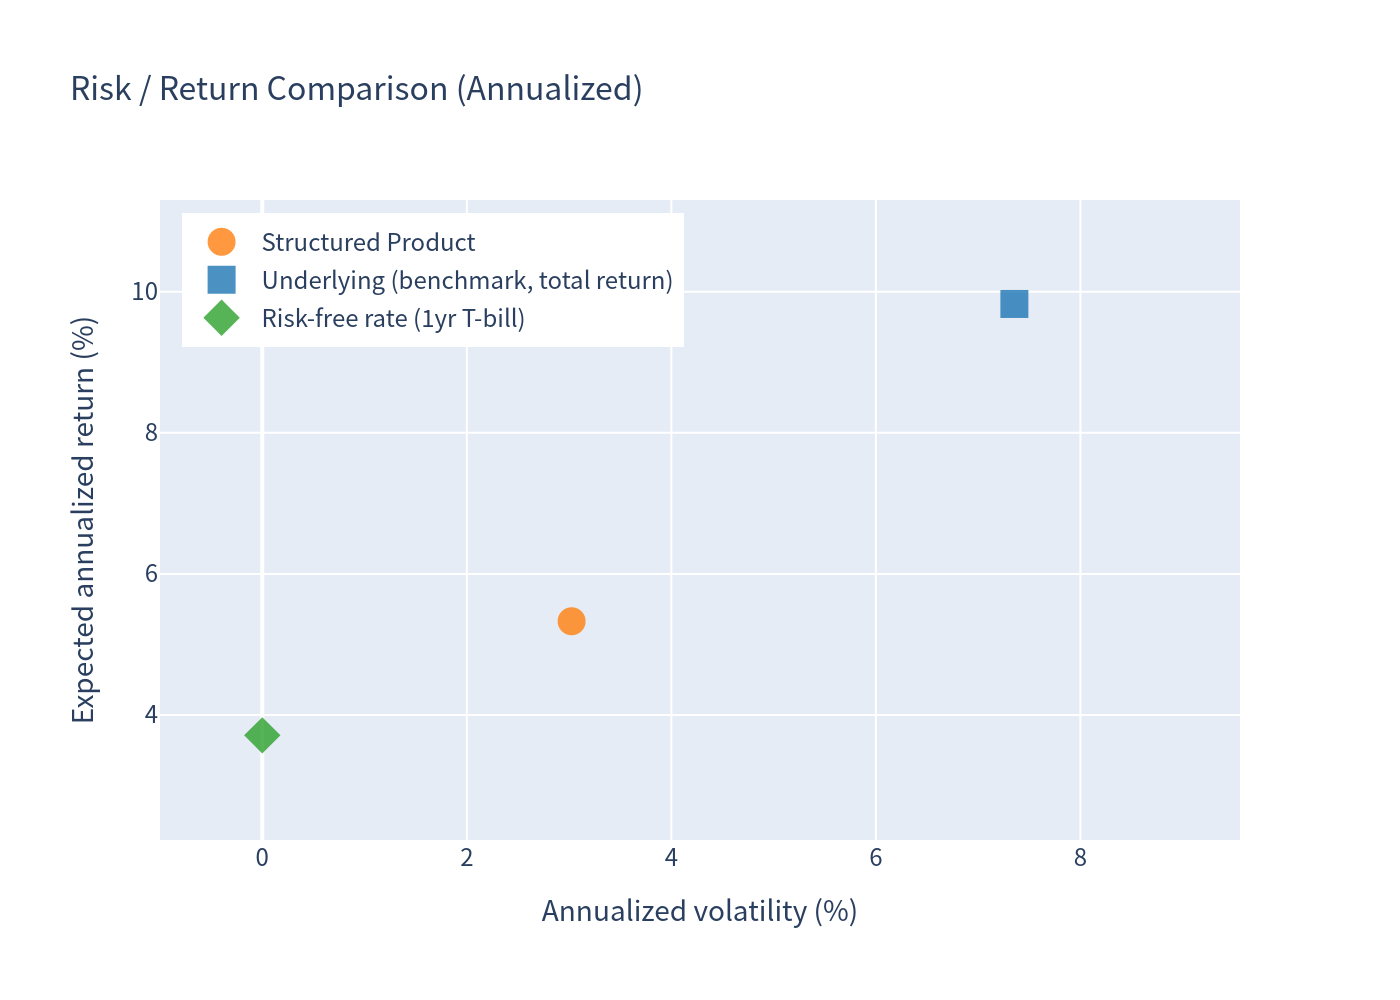
The product's expected annualized return of 5.33% exceeds the current 1-year risk-free rate (≈3.71%) but is well below the benchmark's 9.83% — the price paid for full principal protection and the capping of upside. The product's low volatility (3.02% vs 7.35%) reflects that its return is floored at 0% and capped at +7.64% annualized.
1. Simulation Outcomes — Product vs Underlying Return
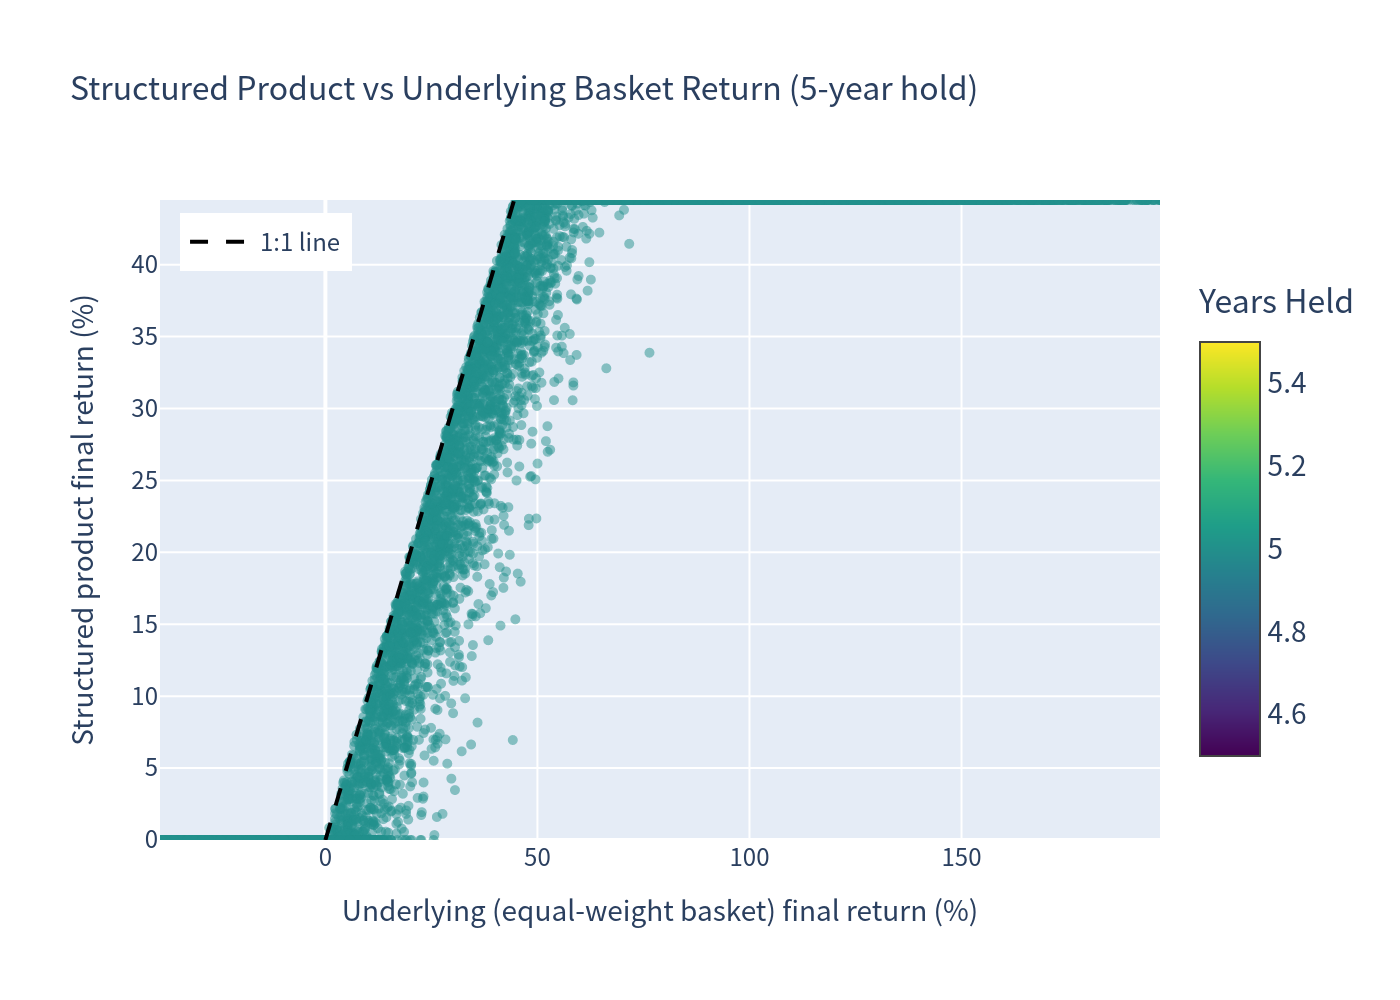
Scatter of each simulation: structured product final return (y) vs equal-weight underlying basket return (x), with a 1:1 reference line. Points cluster along the 0% line when the worst-of condition fails and along the 44.5% cap when both indices rise strongly.
2. Underlying Annualized Total Return Distribution
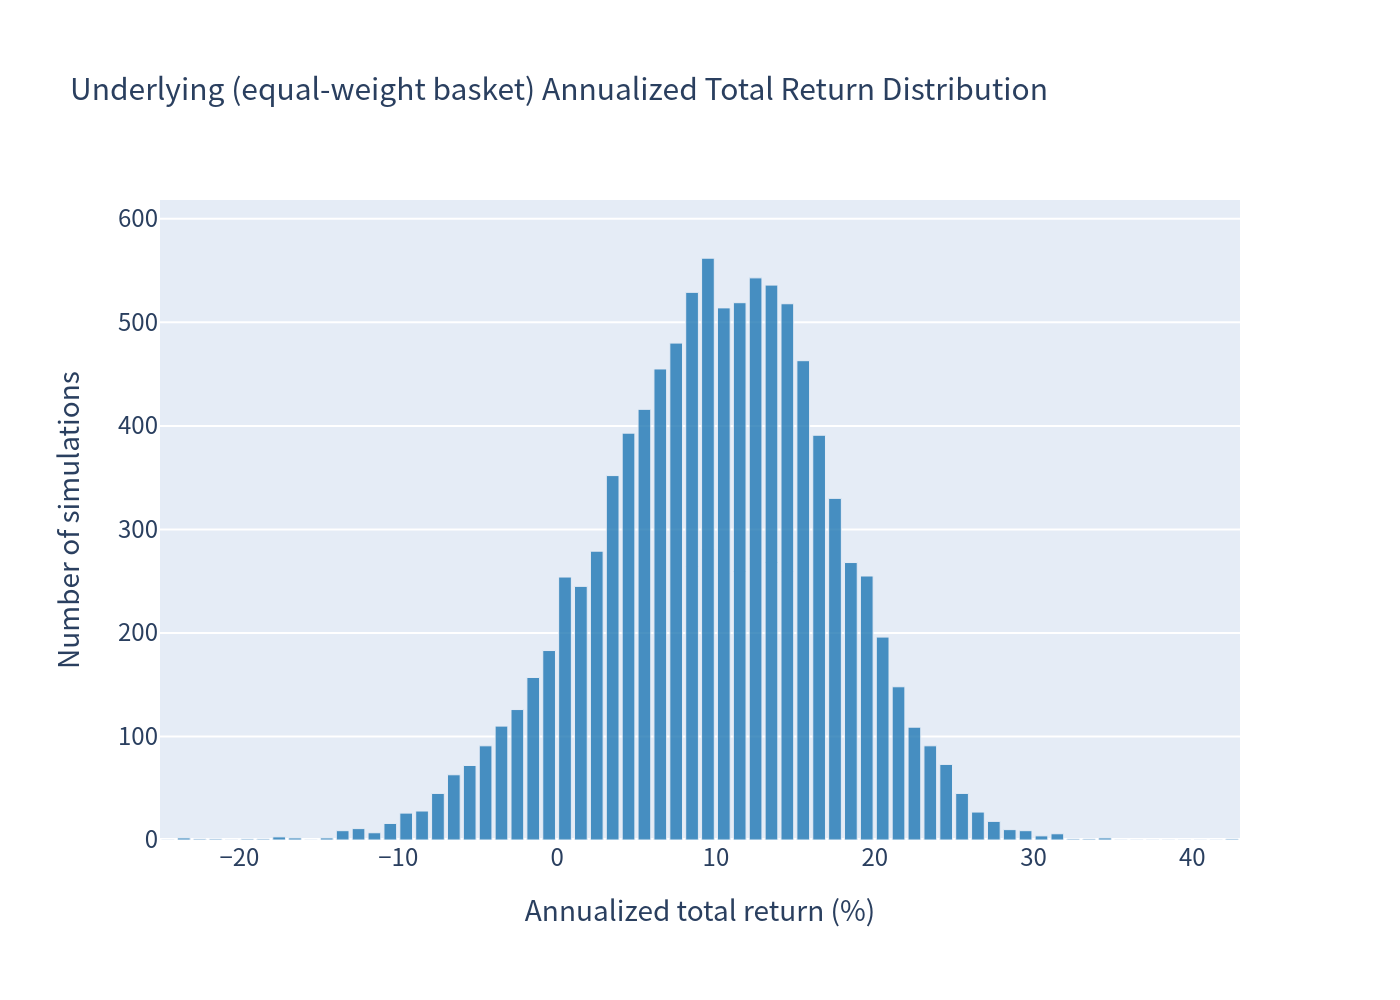
1%-bin histogram of the equal-weight basket's annualized total return (with dividends). All simulations are held the full 5 years (single color).
3. Structured Product Annualized Return Distribution
1%-bin histogram of the CD's annualized return. Returns are bounded between 0% (deposit only) and ≈7.64% (cap). The large bar at the right edge is the mass of scenarios hitting the cap.
4. Scenario Probabilities
Probability of the worst case (zero return), best case (hitting the cap), outperforming the risk-free rate, and earning a positive return.
5. Risk / Return Comparison
Expected annualized return vs annualized volatility for the structured product, the underlying benchmark (total return), and the risk-free rate.
6. Annualized Return Distribution — Box Plot
Box-plot comparison of annualized returns (structured product vs underlying benchmark total return).
Pros
- Full principal protection — the deposit amount is returned at maturity in every scenario and is FDIC-insured (up to applicable limits), giving a 0% probability of loss in this analysis.
- Attractive risk-adjusted payoff for a deposit — expected annualized return of 5.33% with essentially no downside; higher than the ~3.71% 1-year risk-free rate in 71% of scenarios.
- Simple, transparent structure — no coupons, no autocall, no barrier to track; payoff depends solely on the two indices' levels at maturity.
- Broad-market upside capture — participation rate of 100% on the worst performing of two of the most widely followed U.S. equity indices, giving exposure to a potential market rally up to a +44.5% total cap.
Cons
- Capped upside — the maximum total return is 44.5% (≈7.64% p.a.), and the cap is hit in roughly half of scenarios; investors forgo returns above this level in strong bull markets.
- Worst-of structure — because the payoff keys off the weaker index, a strong gain in one index is not enough; both indices must rise for any positive return (no diversification benefit).
- Zero-return scenarios — in 15.8% of scenarios (either index flat or down at maturity) the CD returns only the deposit, providing no compensation for inflation or the time value of money.
- No current income — the CD pays no interest or coupons over its 5-year life; the entire return, if any, arrives only at maturity.