
26.00% p.a. Multi Barrier Reverse Convertible — Simulation Report
Headline Simulation Results
Basic Product Information
How it works (layman's explanation)
- You invest CHF 1,000 per product and receive a fixed coupon of CHF 65 every quarter (26% p.a.), paid regardless of how the three Swiss stocks perform — for up to five payments.
- The issuer can call (redeem) the product early at three quarterly observation dates (Feb, May, Aug 2027). If called, you receive your CHF 1,000 back plus the coupon due on that date, and the product ends.
- If not called, the product runs to maturity (Nov 2027):
- No barrier event (all three stocks stayed above 59% of their start level at all times) → you get your CHF 1,000 back.
- Barrier event occurred (any stock touched ≤ 59%) and the worst performer finishes below its start level → you receive the worst-performing share (worth less than CHF 1,000).
- Barrier event occurred but the worst performer finishes at or above its start level → you get your CHF 1,000 back.
- In short: you sell a "worst-of" down-and-in put on the three stocks to earn a high coupon; the danger is a deep fall in any one of the three names.
Key product terms (summary)
- Type: Reverse Convertible (SSPA 1230), issuer-callable
- Coupon: 26.00% p.a., paid quarterly = CHF 65 per CHF 1,000 (5 payments; coupon paid on early redemption dates too; stops after early redemption)
- Barrier: 59% of initial level, continuous observation over the full life; event triggered by any one underlying (multi-barrier)
- Strike: 100% of initial level; upside capped at par + coupons (no participation in gains)
- Maturity payoff: par unless barrier event AND worst final < 100% → physical delivery of worst performer
Key Statistics — Structured Product vs Underlying Benchmark
| Metric | Structured Product | Underlying (equal-weight basket, incl. dividends) |
|---|---|---|
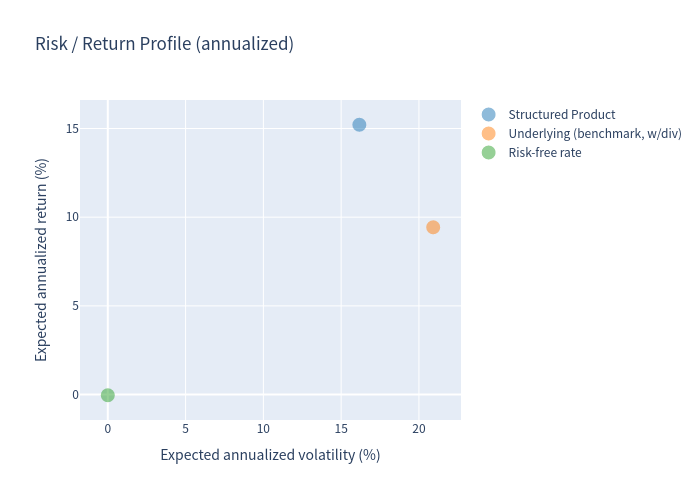
| Expected annualized return | 15.21% | 9.43% |
| Expected annualized volatility | 16.17% | 20.92% |
| Probability of loss (total return < 0) | 25.26% | 35.89% |
| 99% VaR (1 year, annualized) | -25.19% | -26.18% |
Benchmark = equal-weight basket of the three underlyings (total return, incl. dividends).
Outcome distribution
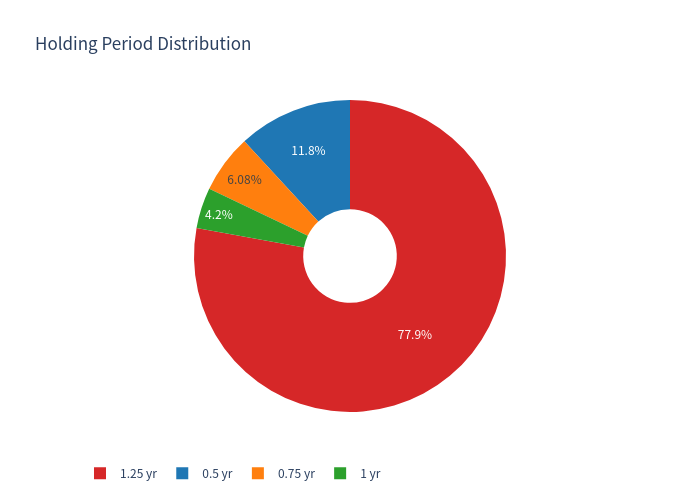
- Held to maturity: 77.89% of simulations; early redeemed (called): 22.12% (≈12% at 6 mo, 6% at 9 mo, 4% at 12 mo)
- Barrier event occurred in 32.12% of simulations
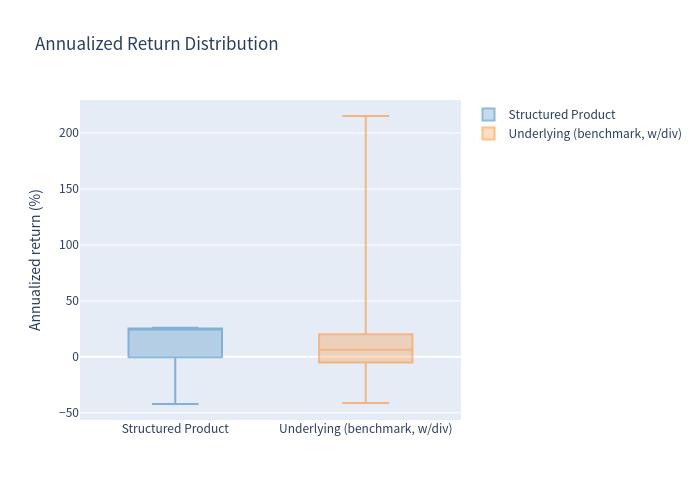
- Loss scenarios average -13.11% total return; worst simulated total return -49.53%; best 32.50%
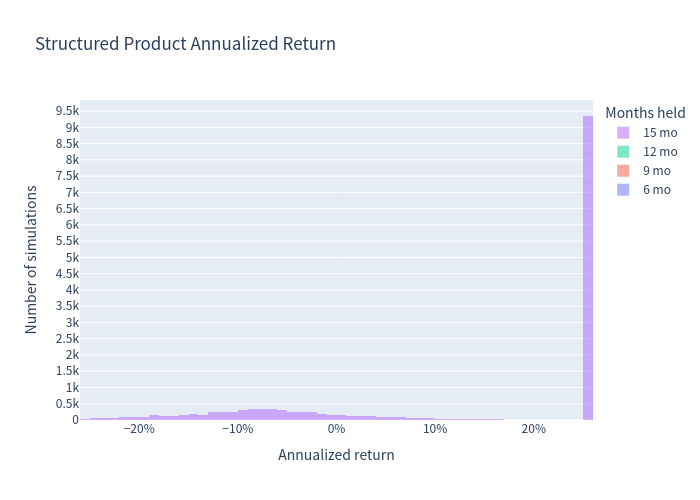
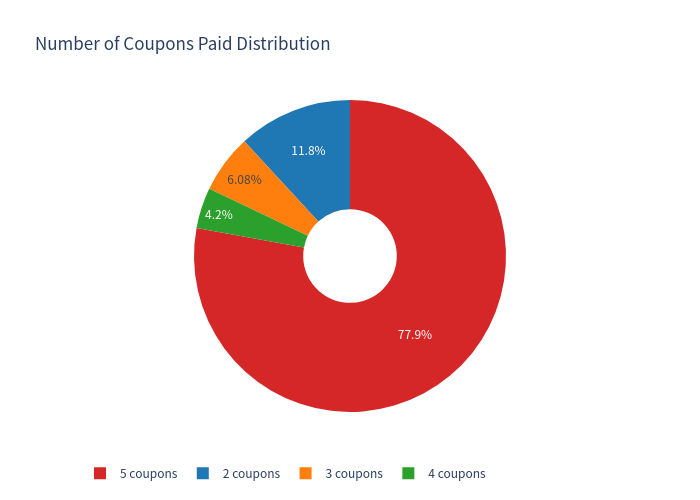
- Because ~78% of simulations run the full 15 months and earn 5 coupons, the expected total return over the realized holding period is 16.16% with an expected holding period of 13.44 months. The annualized figure of 15.21% should be read together with the total-return and holding-period figures; early-redeemed paths annualize the same 6.5%-per-quarter coupon to ~26%.
Charts
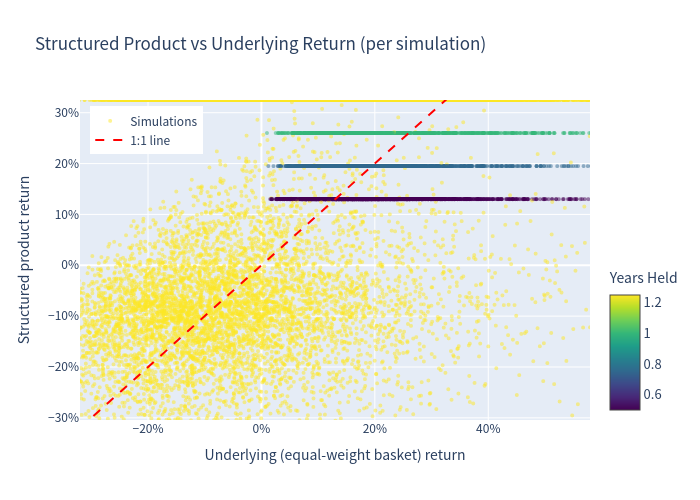
Simulation outcomes — product return vs underlying return
Each simulated path plotted by its product return (y-axis) and underlying basket return (x-axis).
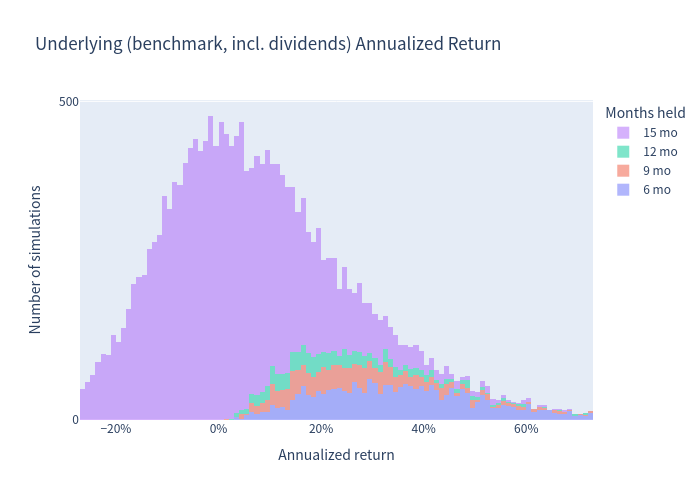
Annualized return distributions (1% bins, stacked by months held)
Distribution of annualized returns for the underlying basket, stacked by the holding period of each simulated path.
Annualized return distribution — product
Distribution of annualized returns for the structured product, stacked by the holding period of each simulated path.
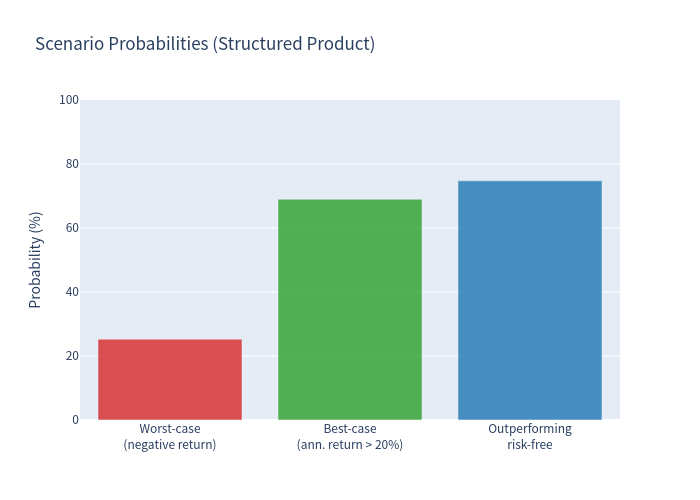
Scenario probabilities
Probability breakdown of the main outcome scenarios across the simulated paths.
Risk / return profile
Risk-return positioning of the structured product relative to the underlying basket.
Return distribution comparison
Boxplot comparing the distribution of total returns between the structured product and the underlying basket.
Holding period outcomes
Share of simulated paths by holding period (early redemption vs held to maturity).
Coupon outcomes
Share of simulated paths by number of coupons received.
Investment Commentary
Positive aspects
- High, fixed income: 26.00% p.a. paid quarterly (6.5% per quarter) — roughly 1.5–2× the expected return of the underlying basket in the simulations, with lower volatility (16.17% vs 20.92% for the basket).
- Coupons paid regardless of performance: the coupon is unconditional while the product is alive, and is still paid on an early-redemption date.
- Loss probability below the direct equity exposure: 25.26% vs 35.89% for holding the basket outright, thanks to the 59% barrier cushion.
- No downside below the 59% barrier path: principal is protected unless an underlying breaks 59% AND the worst name finishes below 100%.
- Early redemption returns principal quickly with the coupon attached (26% p.a. annualized in those paths).
Risk considerations
- Worst-of / multi-barrier structure: only one of the three names needs to touch 59% to activate the barrier and only the worst name determines maturity redemption — the structure is as weak as the weakest link (Idorsia and Kuros Biosciences are high-volatility biotech/small-cap names).
- Capital loss on conversion: in barrier-hit scenarios with a weak worst performer, the investor receives the worst share; simulated conversion levels average ~58% of par, and losses can reach about -49.53% total.
- No upside participation: the coupon is the entire return; any rally in the underlyings does not increase the redemption amount.
- Issuer call risk: the issuer can redeem early (at par + coupon), capping the number of coupons received if it chooses to call.
- Issuer credit risk: the product is an unsecured debt instrument of the issuer.
This report is a quantitative evaluation of the product's payoff profile based on simulated market scenarios. It does not constitute investment advice or a suitability assessment.
Key Modeling Assumptions (summary)
| Assumption | Description |
|---|---|
| Issuer call | The issuer is assumed to call at the first observation date where the worst-performing underlying is at/above its strike (100%). Call is at the issuer's discretion in the contract. |
| Continuous barrier | Approximated from monthly simulated paths using a within-month Brownian-bridge adjustment. |
| Risk-free rate | 1-year average of the CHF 3-month money-market rate (≈ -0.04% p.a.); equity risk premium applied in path generation. |
| Dividend yields | Sandoz ≈ 1.10% p.a., Idorsia and Kuros ≈ 0% (used only for the underlying benchmark comparison). |