
Structured Product Evaluation
1. Headline Simulation Results
| Metric | Value |
|---|---|
| Expected annualized return | 3.27% |
| Probability of a negative return | 24.70% |
| 99% confidence 1-year VaR | –35.45% |
| Expected total return over the actual holding period | 1.92% |
| Expected holding period | ≈ 14.1 months (≈ 1.18 years) |
| Maximum possible annualized return | 11.20% (upside capped at the coupon) |
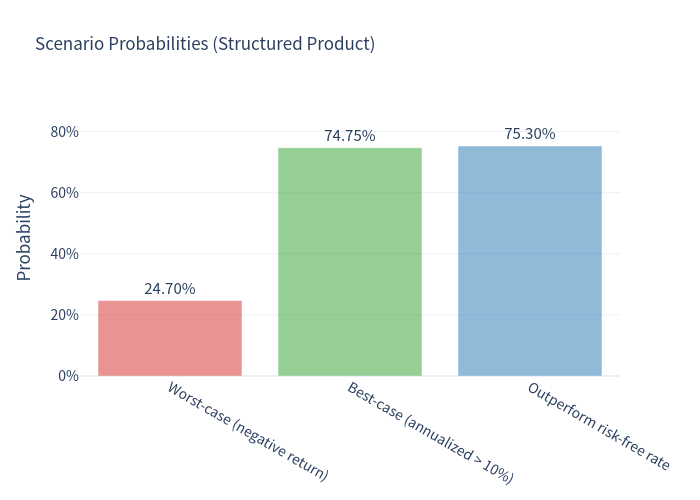
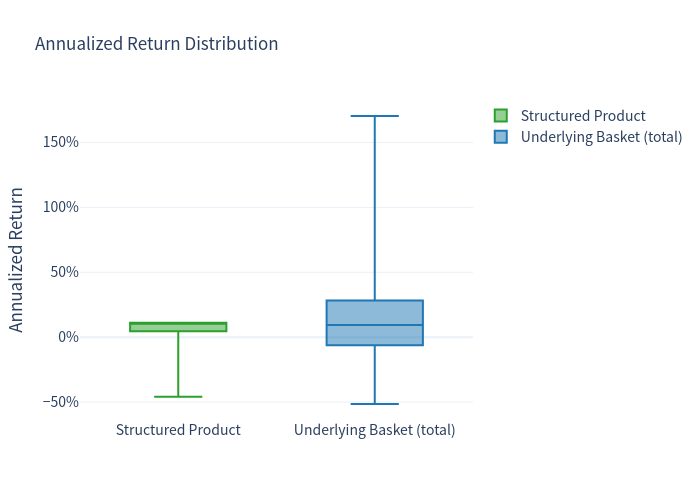
The product most often delivers close to its coupon (median annualized return 10.91%, and it beats the risk-free rate in 75.30% of paths), but the mean is pulled down by a heavy left tail: in about 24.70% of scenarios the investor ends with a loss, and the worst 1% of outcomes average roughly –35% on an annualized basis.
2. Product Overview & How It Works
- Type: Yield-enhancement, capital-at-risk certificate — a Multi Barrier Reverse Convertible (worst-of), callable by the issuer.
- Underlyings: worst performing of Bachem Holding AG, Lonza Group AG, Straumann Holding AG (all SIX Swiss Exchange).
- Denomination / currency: CHF 1,000 per product; issue price 100%.
- Coupon: 11.20% p.a., paid quarterly (CHF 28.00 per CHF 1,000, i.e. 2.80 index points per quarter), up to six payments.
- Barrier: 59.00% of each underlying's initial level, observed continuously.
- Strike: 100.00%. Final fixing: 07/04/2028; maturity: 13/04/2028.
- Issuer call: the issuer may redeem early on four quarterly observation dates (Apr/Jul/Oct 2027, Jan 2028).
In plain terms: the investor collects a high fixed coupon while the level of the weakest of the three shares stays above 59% of its starting value. If that barrier is never touched, the investor receives par (100%) at maturity plus all coupons. If the barrier is breached at any point and the weakest share finishes below its strike, the investor is exposed to the full downside of that weakest share — the coupons are still received, but the principal is delivered in the form of the depreciated share. Because the issuer holds a call, the product can be redeemed early at par plus the then-current coupon, which caps how long the investor keeps earning the coupon.
3. Key Statistics
| Metric | Structured Product | Underlying Basket (total return) | Worst-of (price only) |
|---|---|---|---|
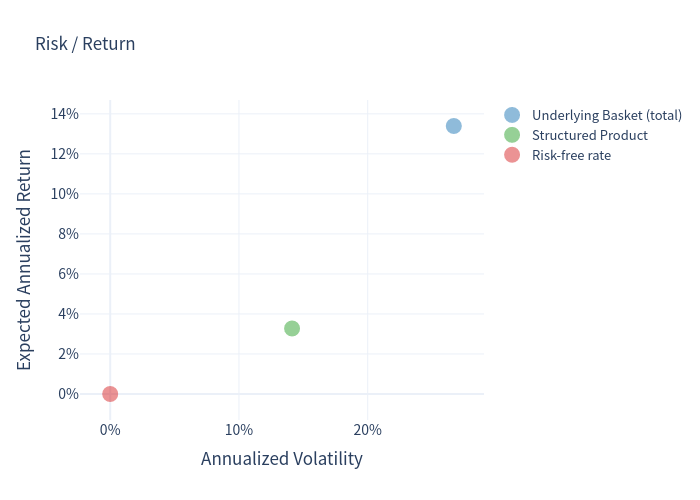
| Expected annualized return | 3.27% | 13.39% | –7.05% |
| Expected annualized volatility | 14.12% | 26.69% | 22.89% |
| Probability of loss | 24.70% | 35.29% | 57.10% |
| 99% VaR (1-year) | –35.45% | –31.48% | –50.28% |
The underlying basket is an equal-weighted portfolio of Bachem, Lonza and Straumann; its total return includes a blended dividend yield of ~1.04% p.a. (price-only basket: expected annualized return 12.35%).
Behavioural highlights from the simulation
- Barrier event probability: 27.06%. When the barrier is breached, the investor almost always (≈91%) ends with a loss on principal.
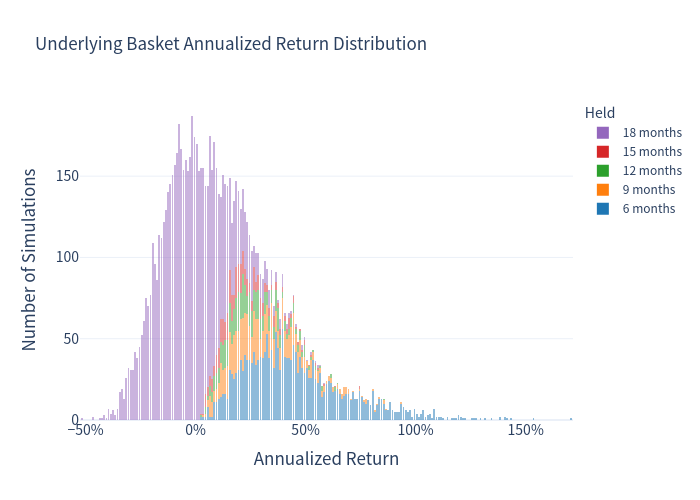
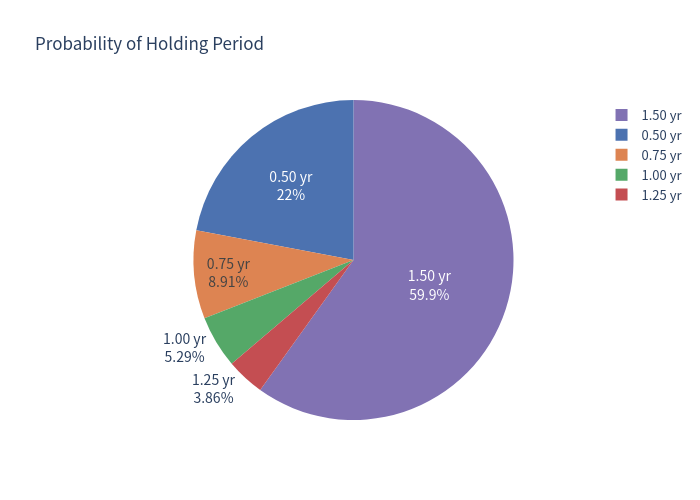
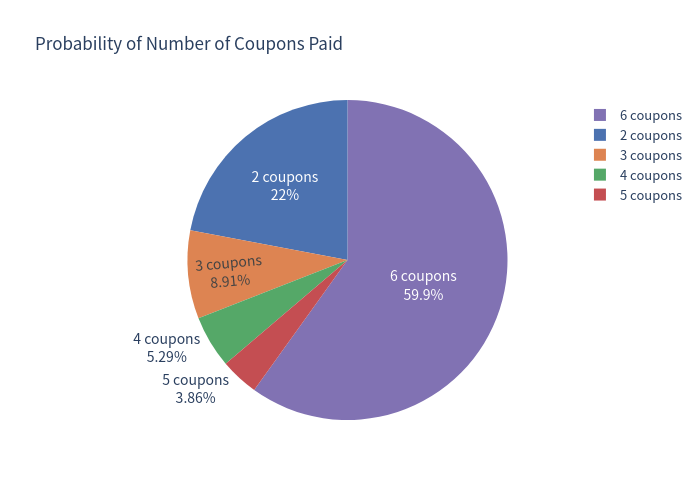
- Issuer call probability: 40.09% — redemption typically occurs at month 6 (22.03% of paths), month 9 (8.91%), month 12 (5.29%) or month 15 (3.86%); 59.91% of paths run to maturity.
- Dividends are excluded from the payoff but the basket comparison includes them; this is the appropriate like-for-like benchmark.
4. Charts
4.1 Simulation outcomes — product vs underlying basket
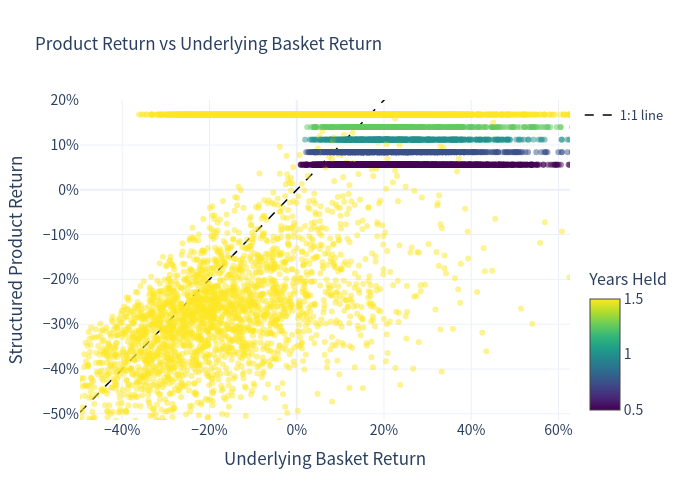
The points sit above the 1:1 line when the basket falls sharply (downside protection while the barrier holds) and below it when the basket rises (upside capped at the coupon). The colour indicates the holding period.
4.2 Underlying basket annualized return distribution
4.3 Structured product annualized return distribution
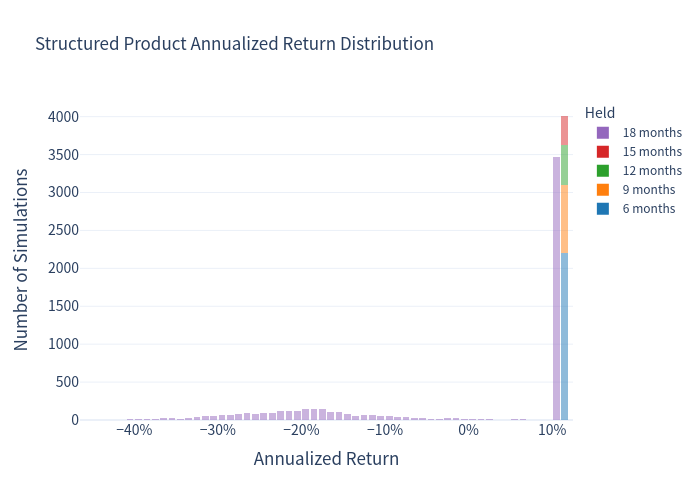
The product's distribution is tightly bunched near its coupon, with a small, sharp left tail (loss cluster) and a hard cap at 11.20%.
4.4 Scenario probabilities
4.5 Risk / return
4.6 Box plot comparison
4.7 Holding-period & coupon-count probabilities
5. Investment Commentary
Potential attractions
- High headline income: 11.20% p.a. in a CHF environment where short-term rates are effectively 0% — a substantial pickup versus cash.
- Conditional principal protection: as long as the 59% barrier holds, the investor receives full par back regardless of how the shares perform, plus all coupons.
- Frequent positive outcomes: the product delivers an annualized return above 10% in ~75% of paths, and it beats the risk-free rate in ~75% of paths.
- Lower realized volatility than the underlying basket (14.12% vs 26.69%) in most scenarios where the barrier holds.
Risks to keep in mind
- Worst-of structure: the barrier depends on the weakest of three shares, materially raising the chance of a breach (27.06%) versus a single-name note.
- Full downside when breached: on a barrier event, principal is delivered in the weakest share; the tail is severe (99% VaR of –35.45%, worse than the basket's –31.48%).
- Upside is capped: the maximum annualized return is the coupon (11.20%); the investor forgoes any share appreciation.
- Issuer call: early redemption truncates the coupon stream (a call occurred in ~40% of paths), so the effective total return is often below the full six-coupon total (16.80%).
- Issuer / credit risk: returns depend on Leonteq (BBB–) with Aargauische Kantonalbank guarantee.
6. Summary Table
| Metric | Structured Product | Underlying Basket (total) |
|---|---|---|
| Expected annualized return | 3.27% | 13.39% |
| Expected annualized volatility | 14.12% | 26.69% |
| Probability of loss | 24.70% | 35.29% |
| 99% VaR (1-year) | –35.45% | –31.48% |