Headline Simulation Results
1.44%
Expected annualized return
(mean per-simulation CAGR)30.42%
Probability of negative return
-35.61%
99% confidence VaR (1-year)
10.34%
Median annualized return
0.54%
Expected total return over realized holding period
15.40 mo
Expected holding period (1.28 years)
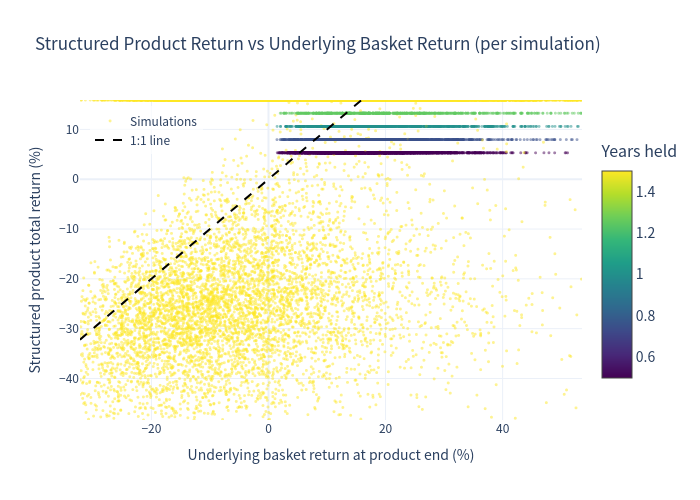
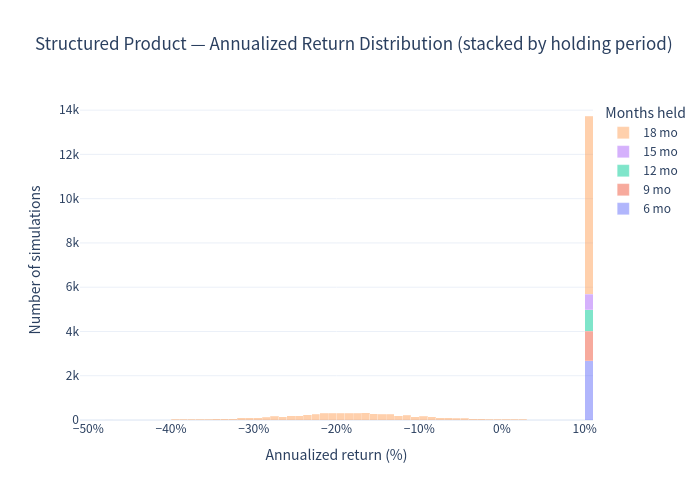
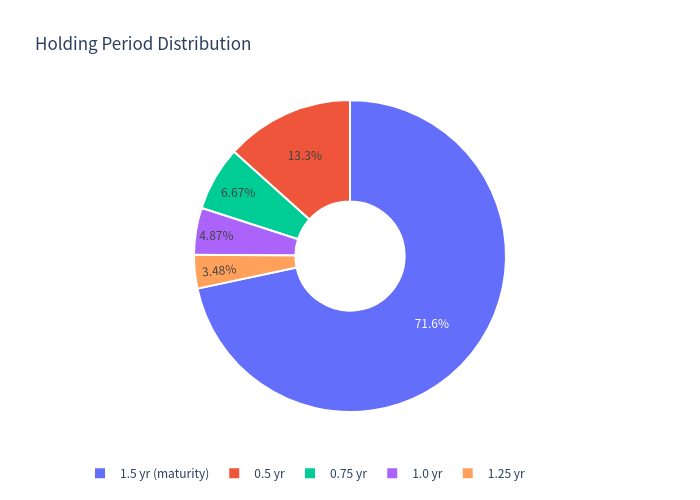
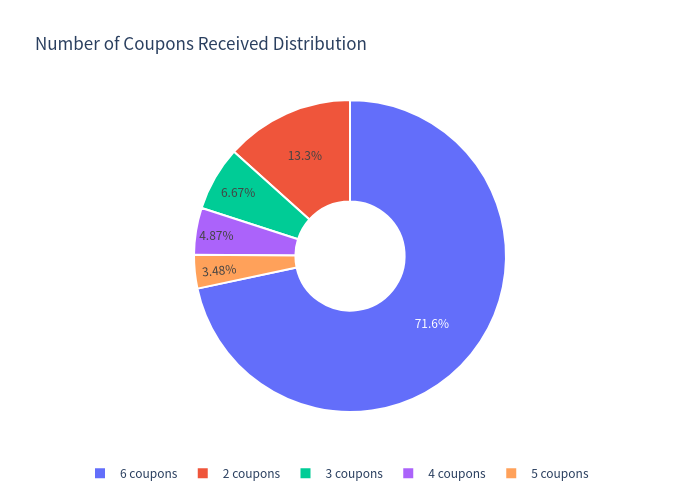
The payoff profile is bimodal. In about 68.66% of simulated scenarios the investor receives par back — either via an early issuer call (≈28.36%, coupons paid up to the call date) or at maturity (≈40.30%, all six coupons) — giving a median annualized return of ≈10.34%, close to the 10.60% p.a. coupon. In the remaining ≈31.34% of scenarios a Barrier Event has occurred and the worst-performing share is delivered below par; these tail losses dominate the mean. Because holding periods vary, annualized figures for the shortest holdings can look extreme and should be read together with total return and holding period.
Basic Product Information — How It Works
- Invest CHF 1,000 per note; the note pays a fixed quarterly coupon of CHF 26.50 (2.65% of notional, i.e. 10.60% p.a.) for up to 18 months — coupons are paid regardless of how the three Swiss shares (ABB, Burkhalter Holding, SIG Group) perform while the note is outstanding.
- Conditional capital protection: if none of the three shares ever trades at or below 59% of its starting level (continuous barrier monitoring), the full CHF 1,000 is returned at maturity.
- If the barrier is breached (any one share falls ≥41% at some point), redemption depends on the worst-performing share: at/above its start level → full par back; below its start level → physical delivery of that worst share (value below par).
- Callable: the issuer may redeem early (par + coupon) at months 6/9/12/15 — early calls typically occur in strong markets, cutting the coupon stream short.
- Upside is capped at the coupon stream; no participation in share-price gains.
Key parameters: Notional CHF 1,000 · Strike 100% · Barrier 59% (continuous) · Coupon 10.60% p.a. (6 quarterly coupons × 2.65 pts = 15.90 pts if held to maturity) · Worst-of maturity payoff · Issuer-callable (no performance-based autocall).
Key Statistics — Structured Product vs Underlying Benchmark
Benchmark = equal-weight basket of the three underlyings (ABB, Burkhalter, SIG), dividend-adjusted (+3.08% p.a.), matched to each simulation's actual holding period.
| Metric | Structured Product | Underlying basket (total return) |
|---|
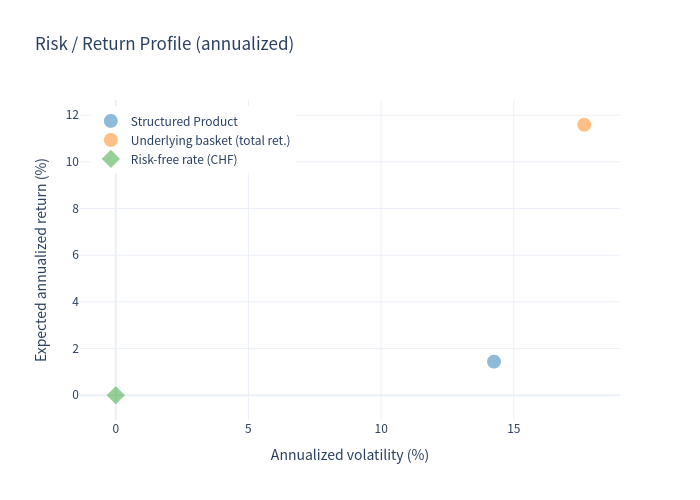
| Expected annualized return | 1.44% | 11.59% |
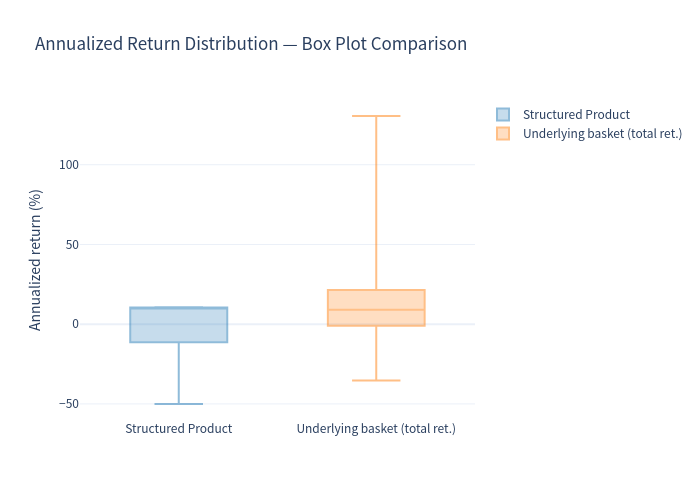
| Median annualized return | 10.34% | 9.03% |
| Expected annualized volatility | 14.25% | 17.65% |
| Probability of loss (annualized < 0%) | 30.42% | 27.38% |
| 99% confidence VaR (1-year) | -35.61% | -19.74% |
| Mean total return over realized holding period | 0.54% | 10.75% |
| Probability of positive return | 69.58% | — |
Outcome mix: early redemption at par 28.36% (months 6–15, partial coupons) · held to maturity with par redemption 40.30% (all six coupons) · held to maturity with share delivery (loss) 31.34%. A barrier event (any share ≤59%) occurred in 32.94% of scenarios.
Simulation Charts
Simulation outcomes — structured product total return vs underlying basket return at product end (colored by holding period):
Each dot = one simulation; dashed line = 1:1.
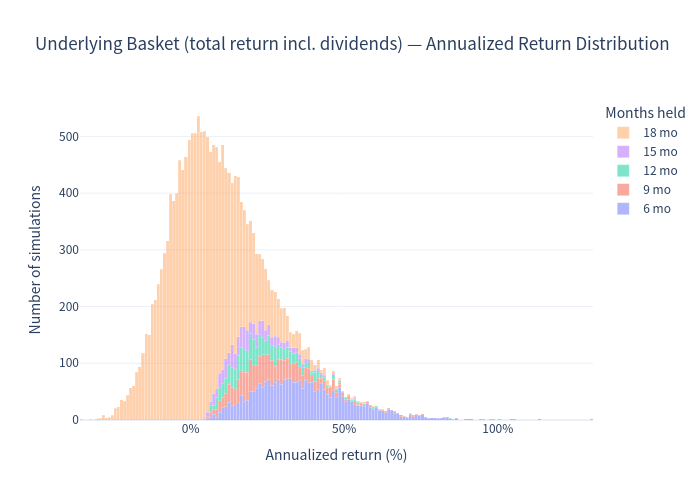
Annualized return distributions (1% bins, stacked by holding period):
Structured product — annualized return distribution.
Underlying basket (total return incl. dividends) — annualized return distribution.
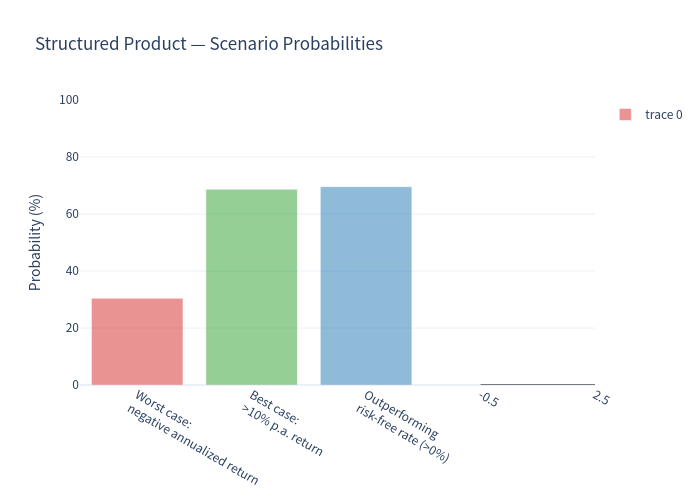
Scenario probabilities:
Chance of loss, of a >10% p.a. return, and of outperforming the ~0% risk-free rate.
Risk / return profile (expected annualized return vs volatility):
Structured product, underlying basket (total return) and CHF risk-free rate.
Return distribution comparison:
Box plot of annualized returns (outliers hidden).
Holding period and coupon outcomes:
Holding period distribution.
Number of coupons received.