
17.60% p.a. Multi Barrier Reverse Convertible – Simulation Report
Headline Results
Basic Product Information
What is this product?
A Reverse Convertible is a yield-enhancement debt instrument. The investor receives a high fixed coupon (17.60% p.a.) paid quarterly, regardless of how the underlyings perform, while the product is outstanding. In exchange for this coupon, the investor accepts a conditional downside risk: if a Barrier Event occurs (either underlying trades at or below 55% of its initial level at any time during the observation period), the capital repayment at maturity is replaced by physical delivery (or equivalent cash) of the worst-performing underlying.
The product also contains an issuer call option: the issuer (Basler Kantonalbank) may redeem the product early at months 6 and 9, paying 100% of the denomination plus the coupon for that payment date.
How it works (layman explanation)
- You invest EUR 1,000 and receive EUR 44 every quarter (4 coupons of 4.4% = 17.60% p.a.) — paid whether the market goes up or down, as long as the product is still running.
- The issuer may call the product early (at month 6 or 9). If called, you get your EUR 1,000 back plus the coupon for that date, and the product ends. In our model the issuer calls when both underlyings are at or above their starting levels (no delivery risk, and the high coupon can be terminated).
- If not called, the product runs to maturity (month 12):
- No Barrier Event → you receive 100% of your capital back (plus all coupons).
- Barrier Event occurred (either stock fell to/below 55% at any time) and the worst performer is above its strike (100%) → you still receive 100% of capital.
- Barrier Event occurred and the worst performer is at or below 100% → you receive shares (or cash equivalent) of the worst-performing stock — this is where you can lose capital.
Quanto EUR means the Danish-krone (Vestas) exposure is converted at a protected rate — the investor carries no EUR/DKK currency risk.
Key Statistics (Monte Carlo simulation, 10,000 paths)
| Metric | Structured Product | Underlying Benchmark (equal-weight, incl. dividends) |
|---|---|---|
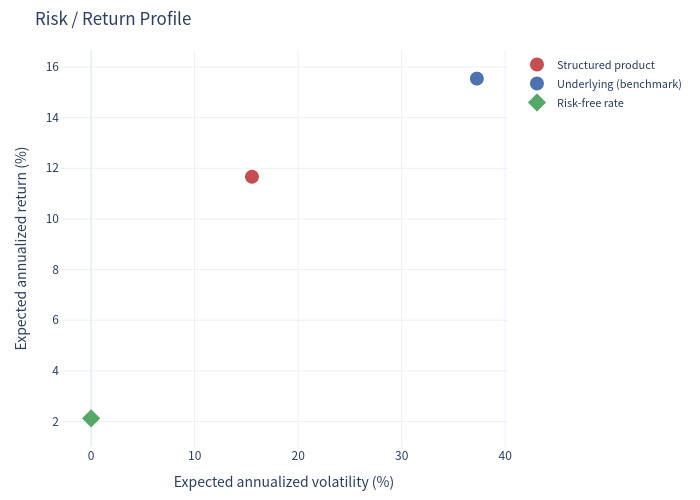
| Expected annualized return | 11.67% | 15.54% |
| Expected annualized volatility | 15.54% | 37.27% |
| Probability of loss | 13.18% | 38.76% |
| 99% VaR (1 year) | −40.79% | −46.68% |
| Expected total return (holding-period) | 8.33% | 5.99% |
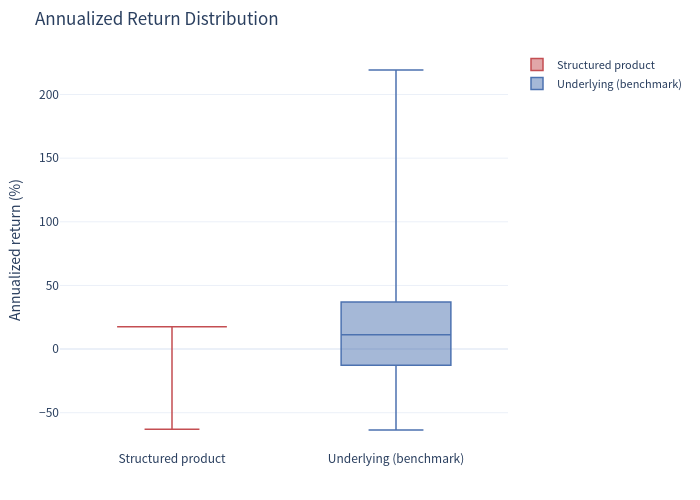
| Median annualized return | 17.60% | 11.25% |
Risk-free rate used: 2.12% (1-year average EUR short-term rate).
Simulation Charts
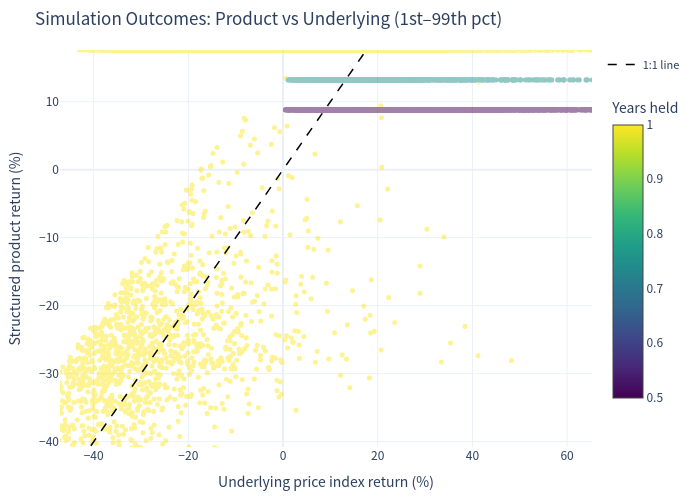
Simulation outcomes: product vs underlying
Scatter of each simulation's final product return against the underlying basket return (1st–99th percentile range), coloured by years held.
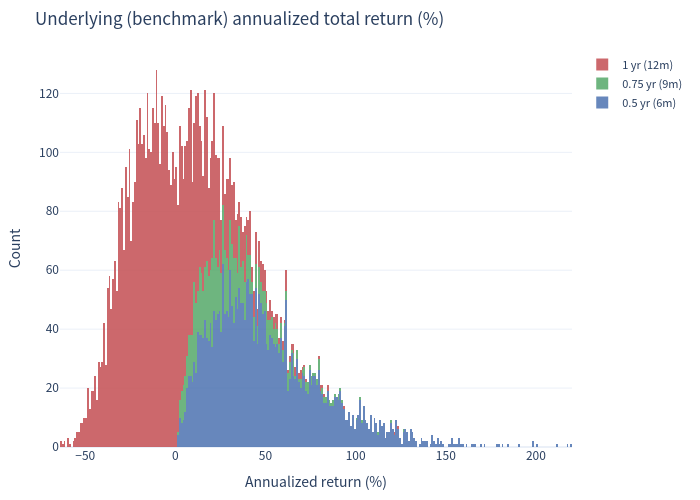
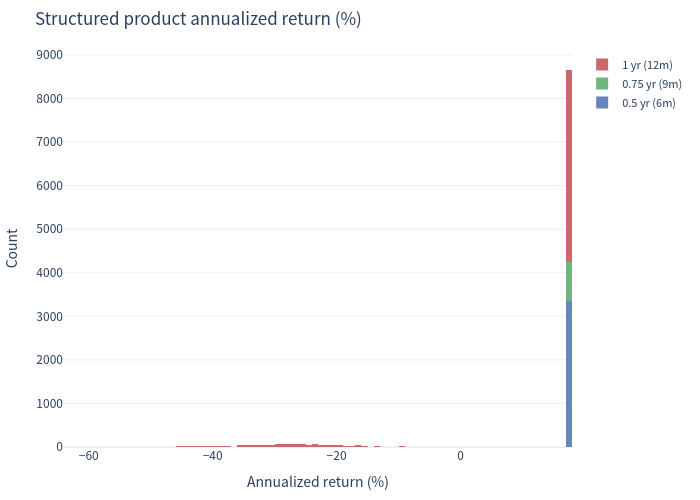
Annualized return distributions (1% bins, stacked by holding period)
Underlying basket histogram (top) and structured product histogram (bottom).
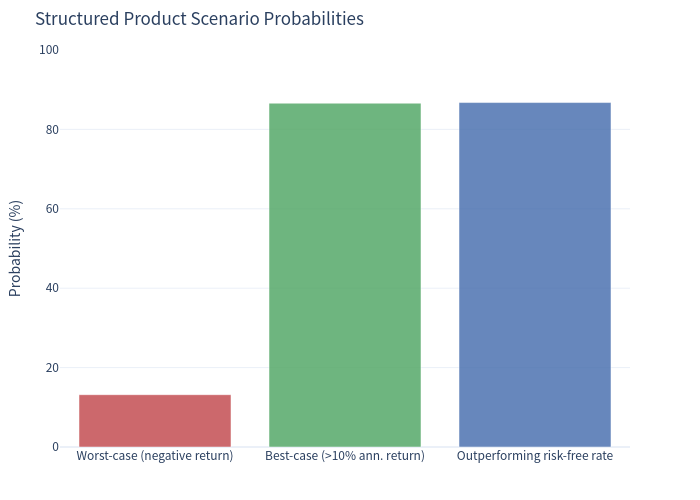
Scenario probabilities
Distribution of simulation outcomes across product scenarios (no barrier event, barrier with full repayment, physical delivery, early call).
Risk / return profile
Annualized return versus risk for the structured product and the underlying benchmark.
Annualized return comparison
Boxplot comparison of annualized return distributions between product and underlying benchmark.
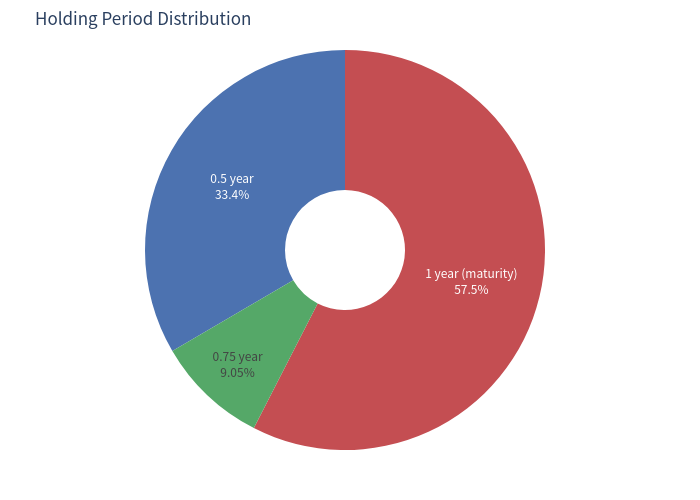
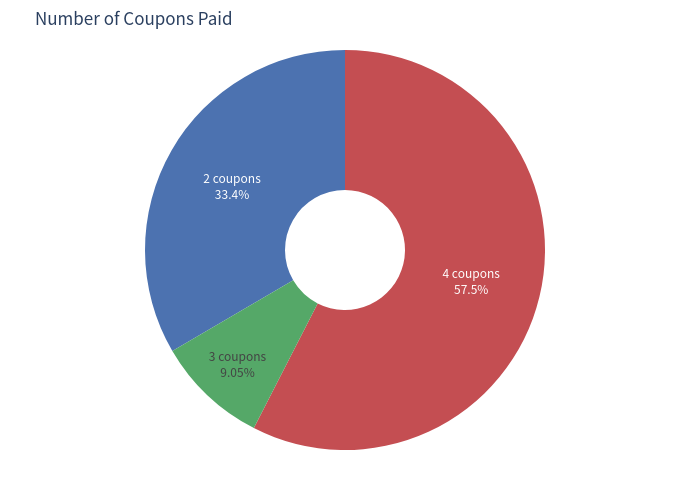
Holding-period and coupon outcomes
Share of simulations ending at each redemption date (left) and distribution of the number of coupons received (right).
Investment Commentary
Pros
- Attractive income: 17.60% p.a. coupon — very high relative to the ~2.12% risk-free rate; paid quarterly regardless of underlying performance while the product is alive.
- Conditional downside cushion: capital is only at risk if either underlying falls to ≤55% of its initial level (a Barrier Event); even then, capital is fully returned if the worst performer finishes above its strike.
- Currency protection (Quanto EUR): no FX exposure to the Danish krone on the Vestas component.
- Better risk-adjusted profile than direct exposure: expected annualized volatility of 15.54% vs 37.27% for the underlying basket, with a materially lower probability of loss (13.2% vs 38.8%).
- High hit-rate: 86.76% probability of beating the risk-free rate; 86.60% of paths achieve >10% annualized return.
Cons / considerations
- Capital at risk if the barrier is breached: 13.4% of paths end in physical delivery of the worst-performing stock (worst case ≈ −64% total return, i.e. a capital loss after coupons).
- Upside is capped: the investor does not participate in gains above par; the best outcome is 100% + coupons.
- Issuer call shortens the income stream: early redemption (modeled at 42.5% of paths) terminates the high coupon, so the total coupon actually received averages 14.26 points (vs 17.6 if held to maturity).
- Credit risk of the issuer (Basler Kantonalbank, S&P AA+/Fitch AAA) applies, as this is an unsecured debt instrument.