
7.60% p.a. Multi Barrier Reverse Convertible on Holcim, Swisscom & Zurich Insurance (Callable)
Basic Product Information
Product type: Multi Barrier Reverse Convertible (SSPA Type 1230), issuer-callable, issued in CHF by Leonteq Securities AG (ISIN CH1593775310), listed on SIX Swiss Exchange.
How it works (layman explanation)
The investor lends CHF 1,000 (the "Denomination") and receives a fixed quarterly coupon of CHF 19.00 (7.60% p.a.) for as long as the product is outstanding. The coupon is paid regardless of how the three Swiss blue-chip stocks — Holcim, Swisscom and Zurich Insurance — perform.
The principal is repaid in full unless the barrier is breached and the worst-performing stock ends below its starting level at maturity:
- Barrier Event: at least one of the three stocks falls to or below 59% of its starting level at any time during the 2-year term (continuous monitoring). A barrier breach by itself does not cause a loss — the investor still receives par if the worst stock finishes at or above its start, or if the product is called early.
- At maturity (if not called), with a barrier breach having occurred: repayment depends on the worst-performing stock:
- Worst stock at or above its starting level (100%) → full CHF 1,000 returned.
- Worst stock below its starting level → investor receives shares of that worst stock (value = the stock's final level), i.e. a capital loss equal to that stock's decline from its start.
The product can be called early by the issuer (at months 12, 15, 18 and 21). When called, the investor receives the full denomination plus the coupon for that period, and no further coupons are paid. This analysis assumes the issuer calls on the first observation date at which all three stocks stand at or above their starting levels — the economically rational behaviour given the high coupon versus a near-zero CHF risk-free rate.
Key features
- Underlyings (worst-of): Holcim, Swisscom, Zurich Insurance — all CHF, no FX risk
- Coupon: 7.60% p.a., paid quarterly (CHF 19.00 per CHF 1,000)
- Barrier: 59% of initial level, continuous observation
- Upside cap: Yes — coupon is fixed; redemption capped at par; no upside participation
- Term: ~24 months (Sep 2026 – Sep 2028)
Key Statistics (Annualized)
| Metric | Structured Product | Underlying Basket (price) | Underlying Basket (incl. dividends) |
|---|---|---|---|
| Expected annualized return | 4.16% | 8.41% | 12.21% |
| Expected annualized volatility | 8.39% | 13.17% | 13.17% |
| Probability of loss | 14.50% | 26.82% | 17.69% |
| 99% confidence VaR (1 year) | -26.77% | -18.91% | -15.11% |
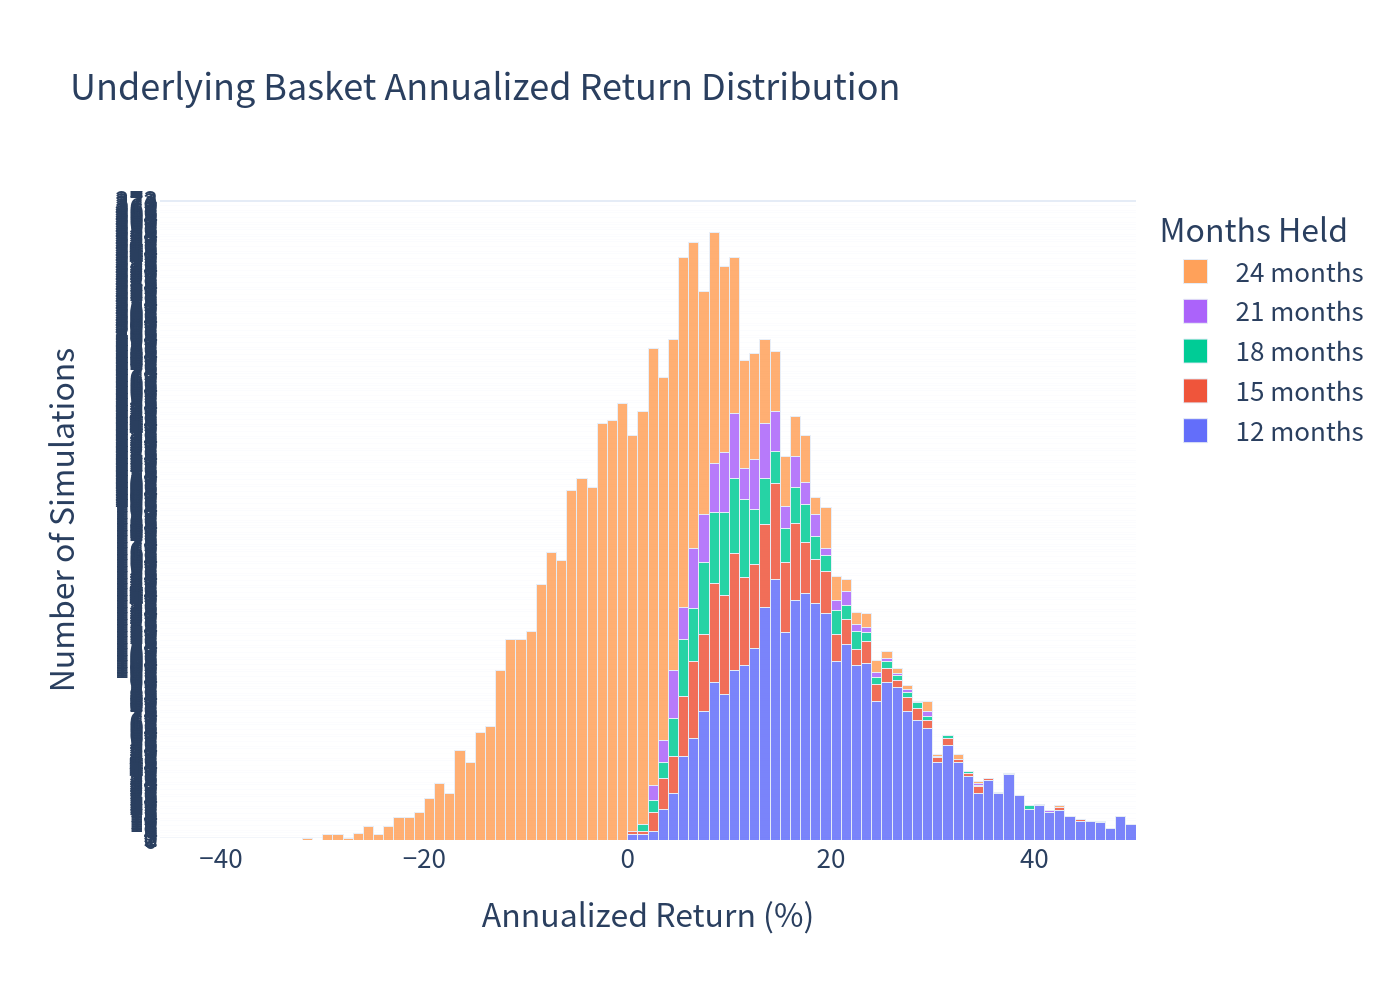
The underlying benchmark is an equal-weight basket of Holcim, Swisscom and Zurich Insurance, measured over the same holding period as the product in each scenario. Average basket dividend yield: 3.80%.
Simulation Charts
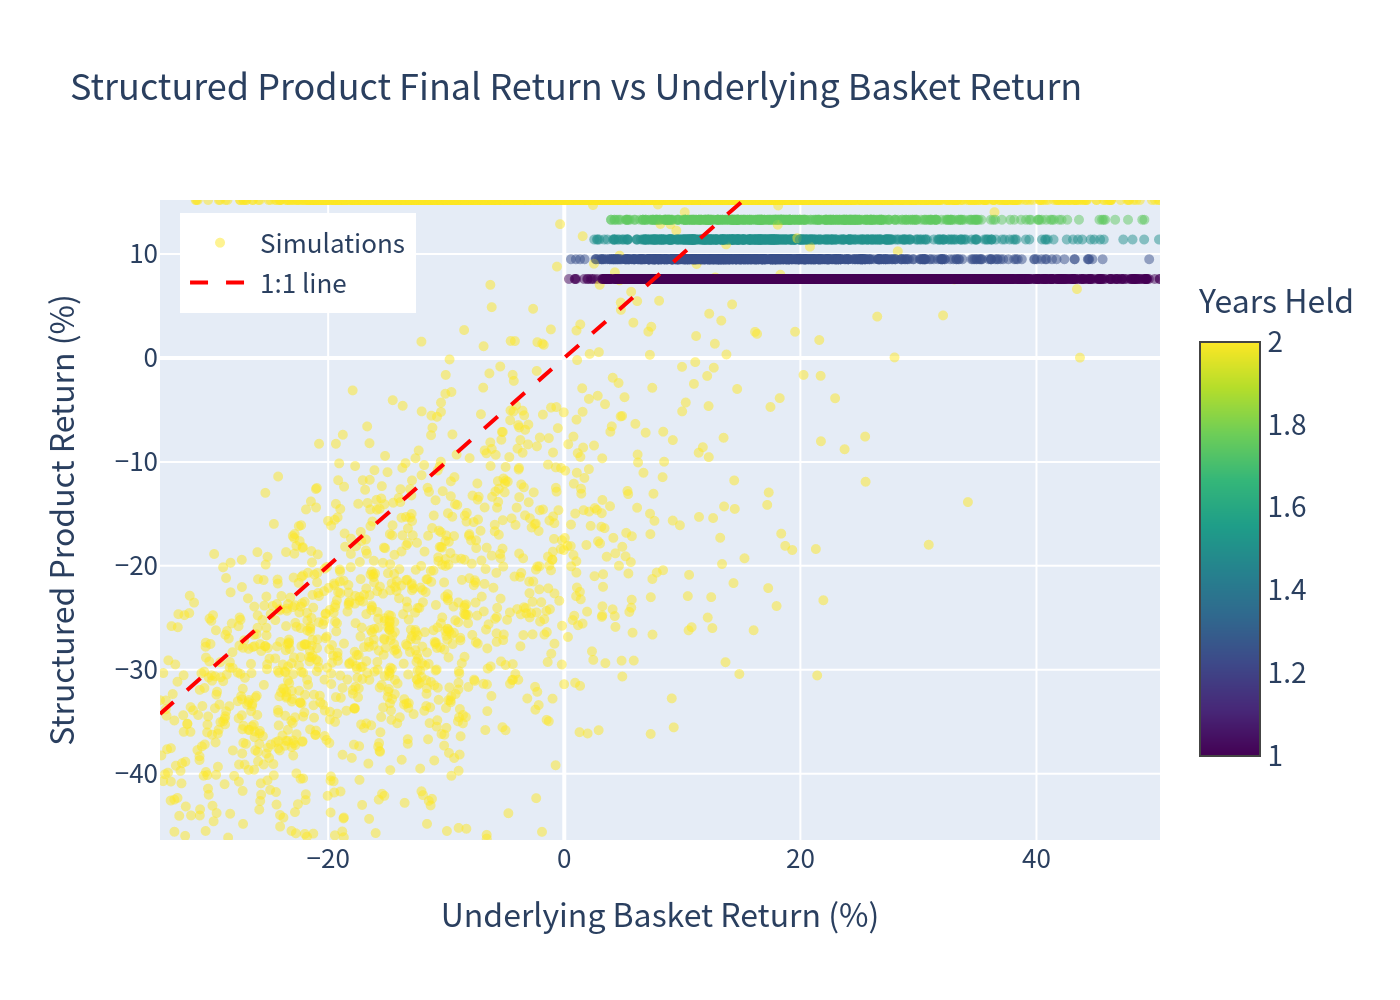
Final Return Scatter
Scatter of simulated total returns versus underlying basket performance.
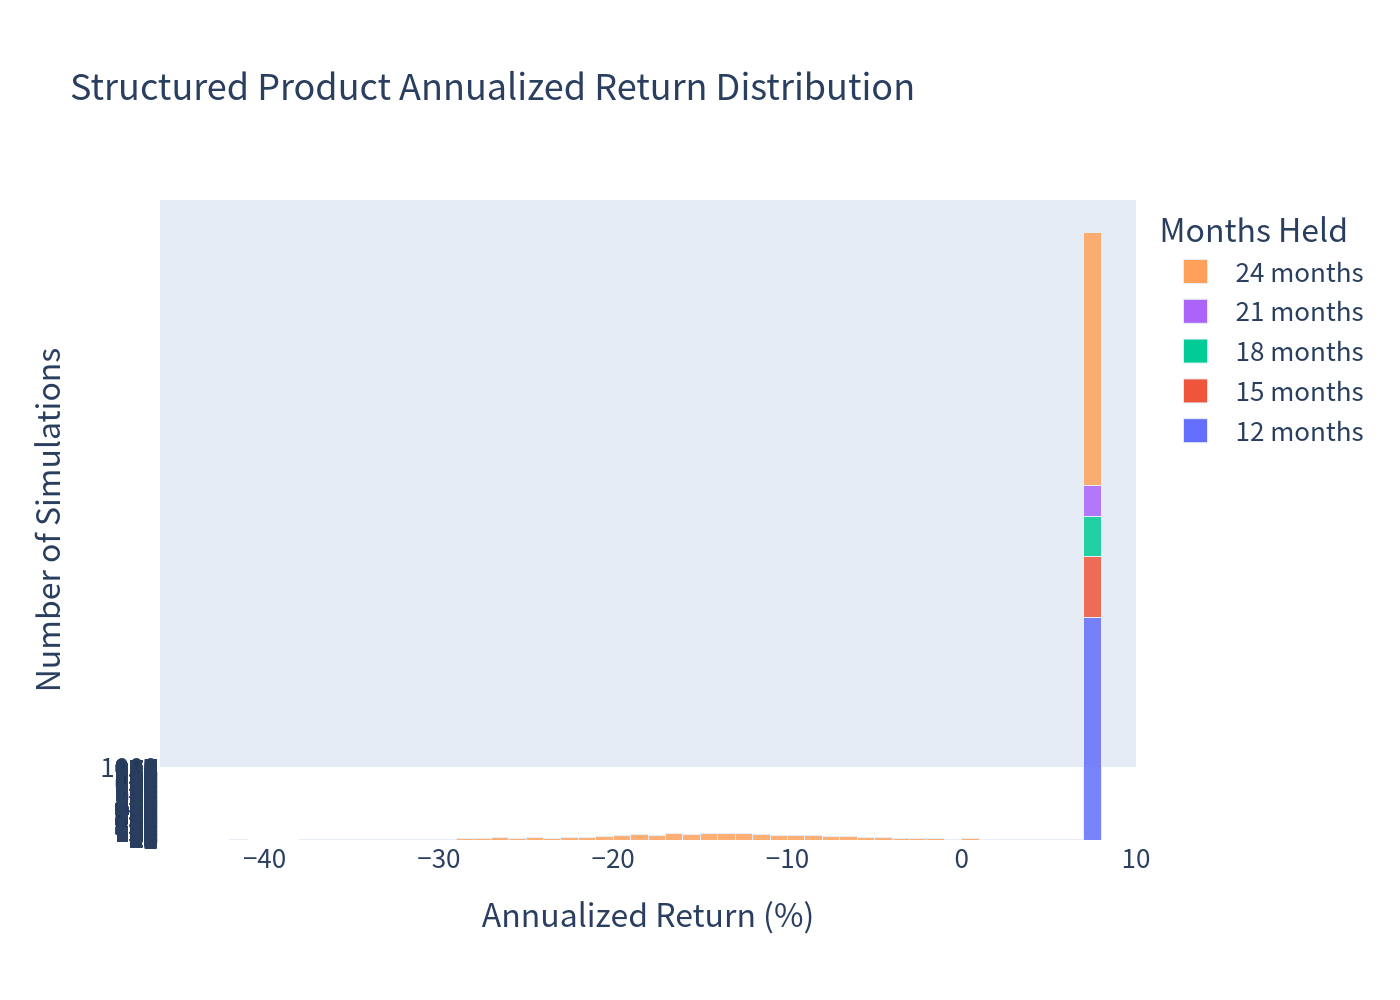
Annualized Return Distributions
Distribution of annualized returns for the structured product (top) and the underlying basket (bottom).
Underlying Histogram
Distribution of annualized returns for the underlying basket, including dividends.
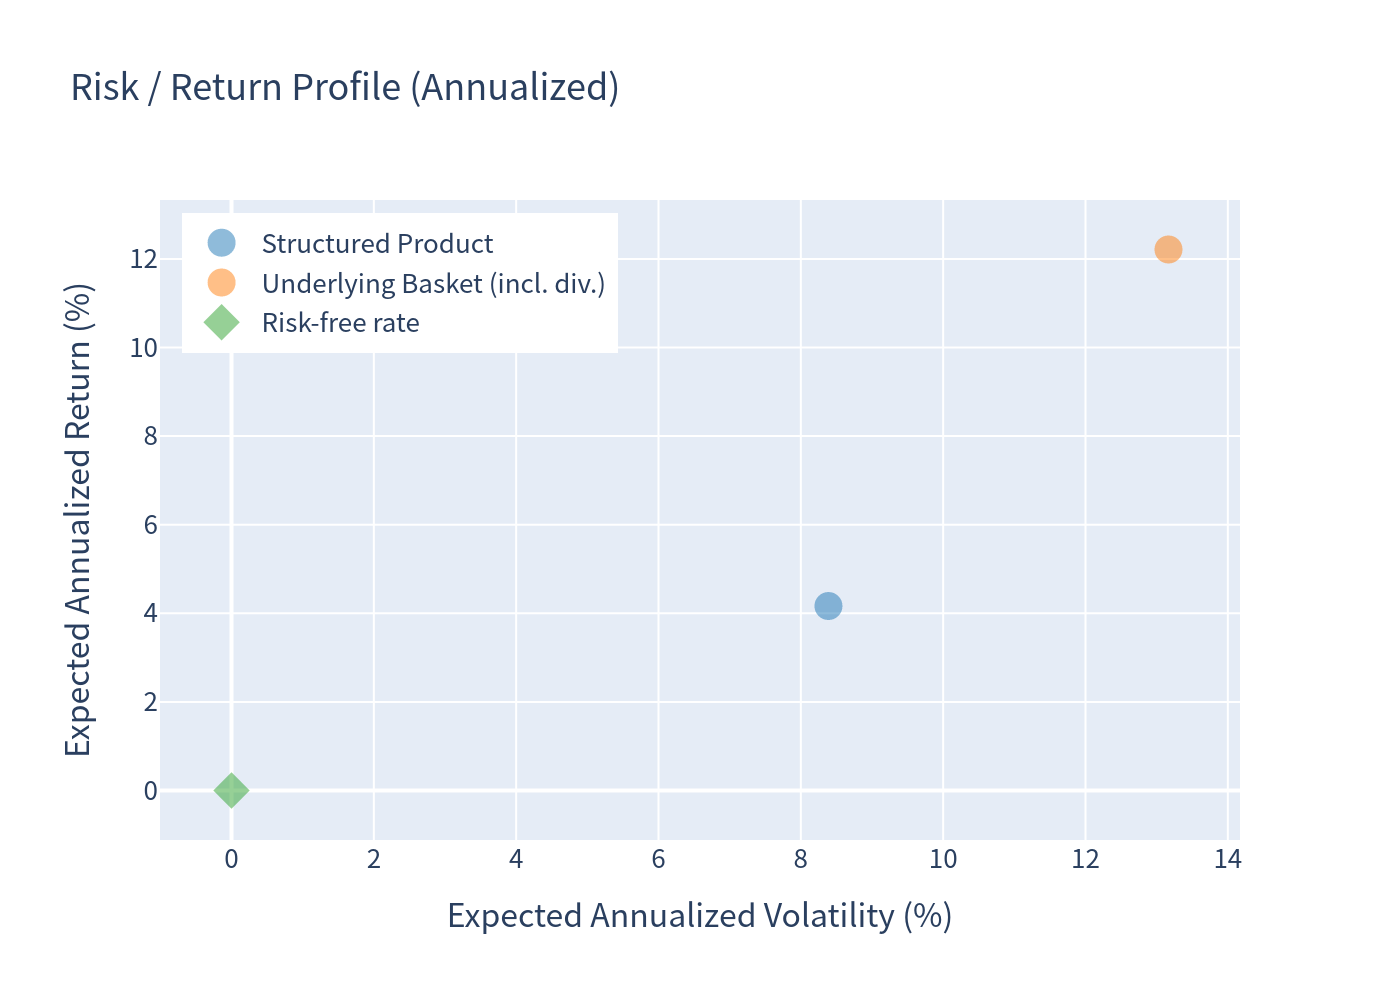
Risk / Return Profile
Expected return versus volatility trade-off between the structured product and its underlyings.
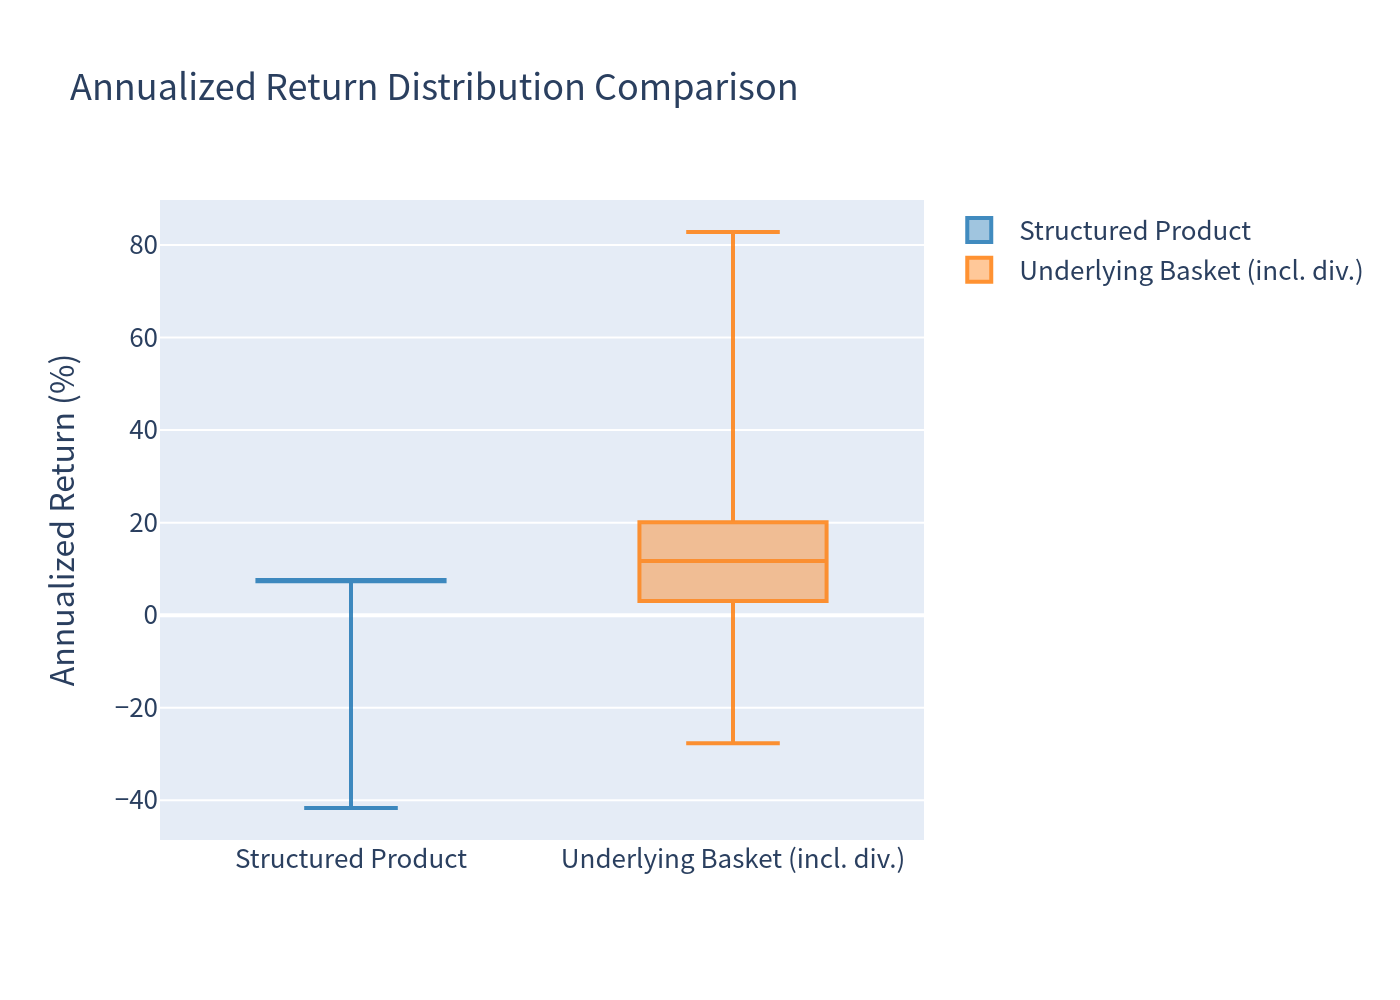
Return Distribution Comparison
Boxplot comparison of the structured product and underlying basket return distributions.
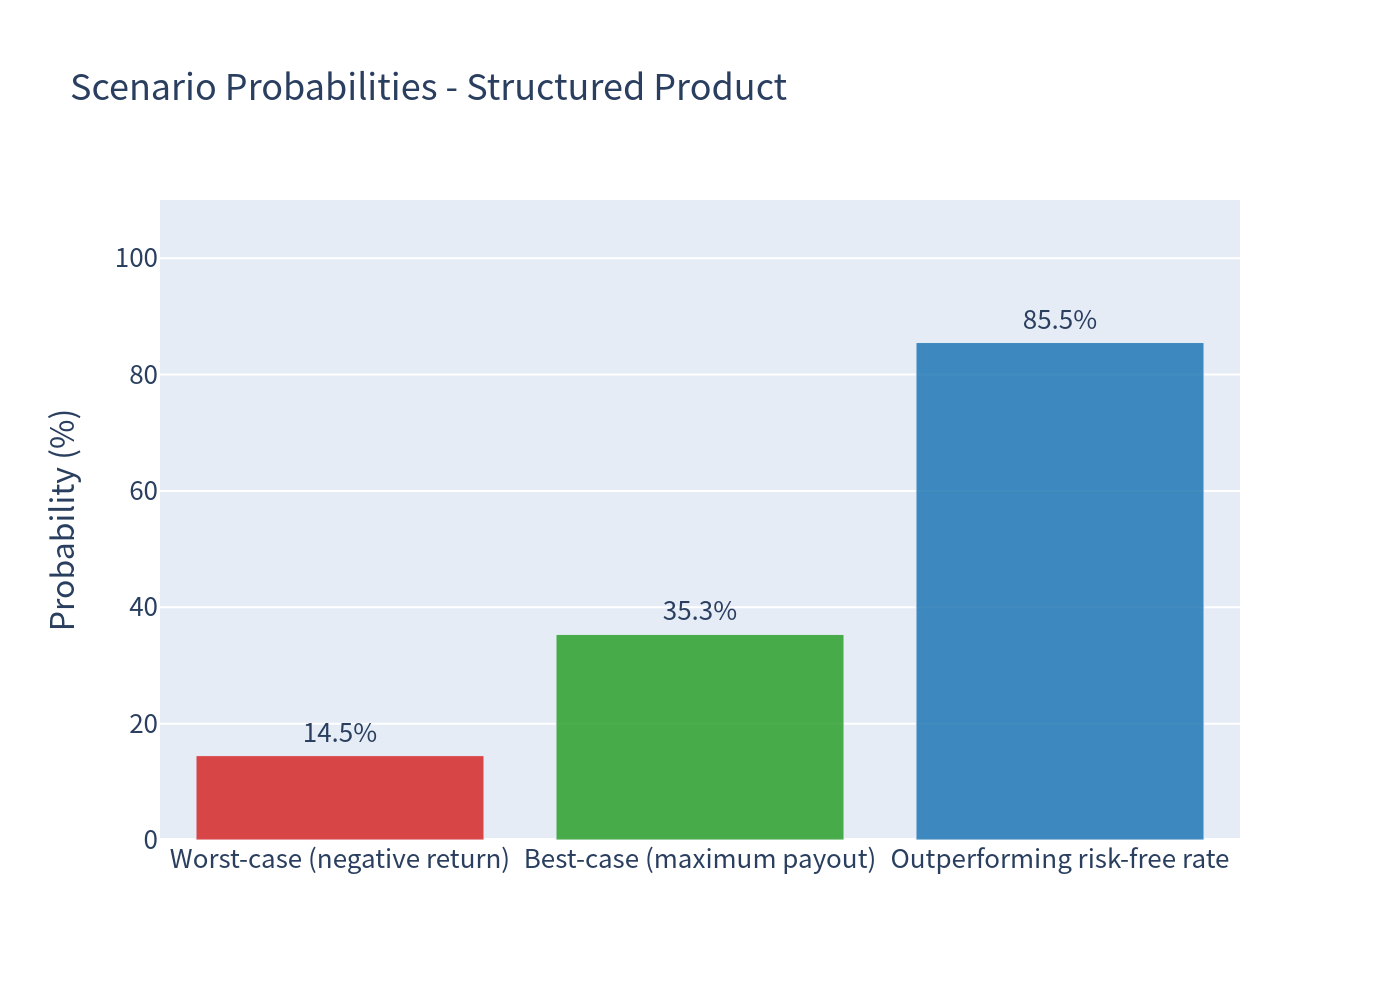
Scenario Probabilities
Probabilities of the key outcome scenarios: early call, full maturity, barrier breach and loss events.
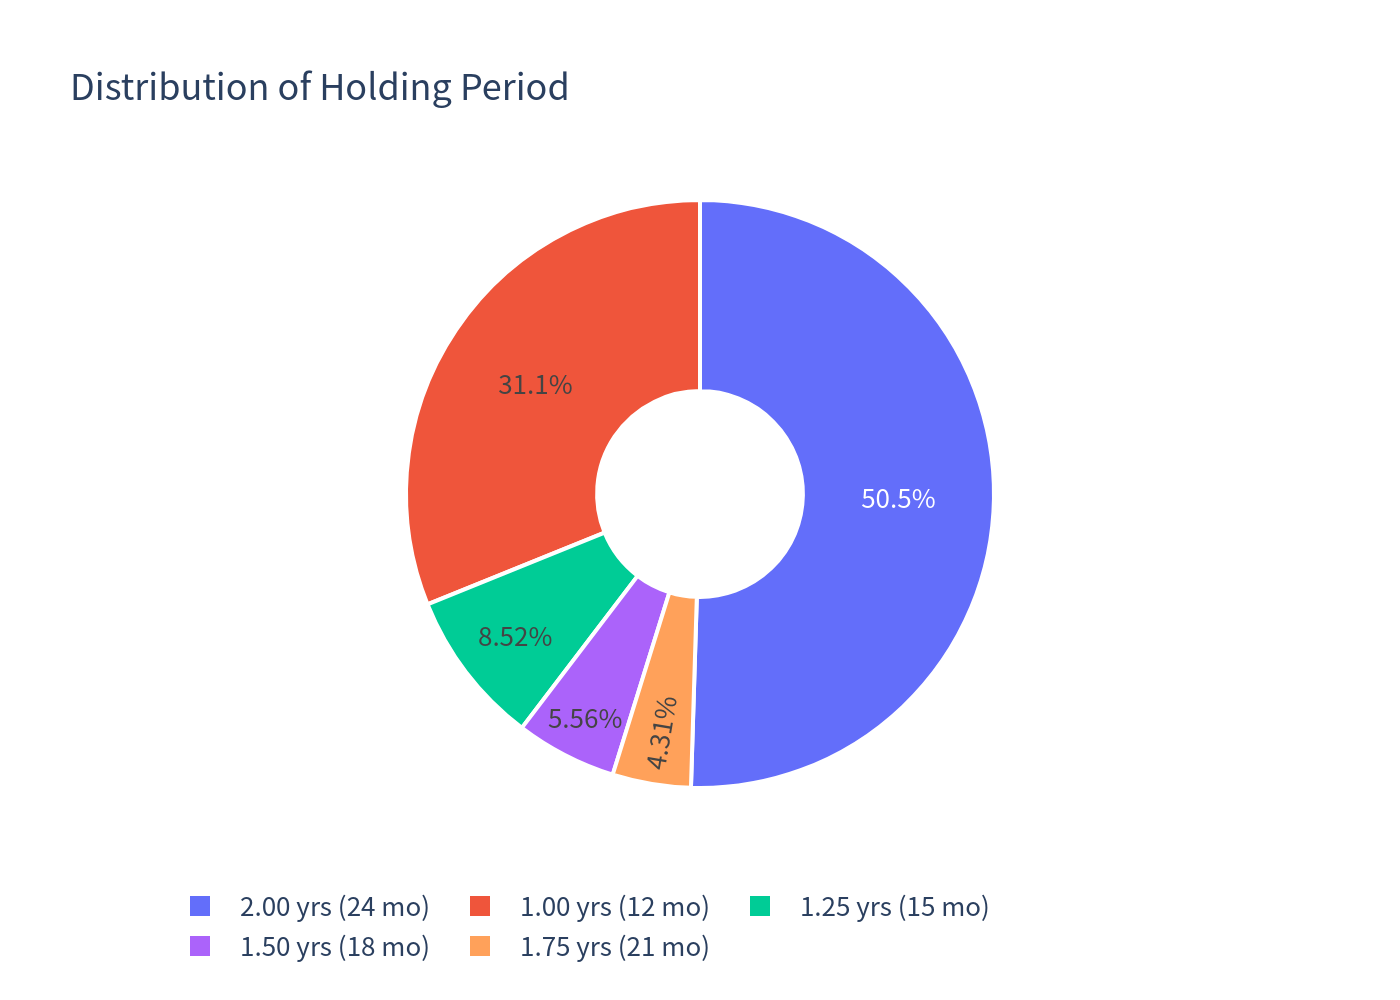
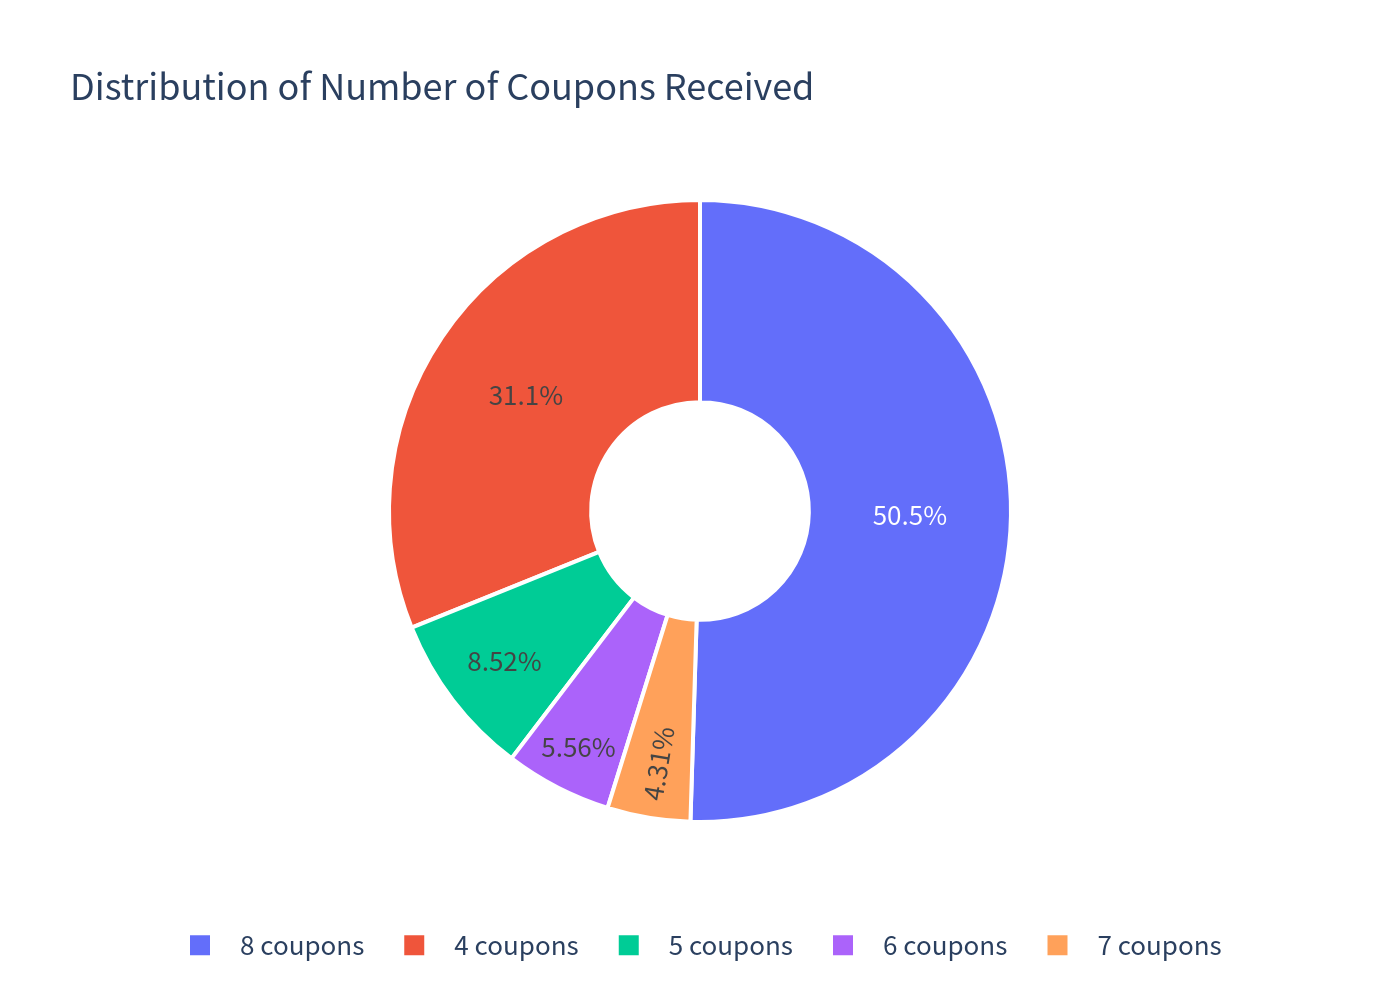
Holding Period & Coupon Distributions
Breakdown of expected holding periods and number of coupons received across scenarios.
Coupon Distribution
Distribution of cumulative coupons received across simulated scenarios.
Investment Commentary
Headline observations
- The product delivers a 4.16% expected annualized return with 8.39% annualized volatility, versus 12.21% expected annualized return (including dividends) and 13.17% volatility for simply holding the equally-weighted basket. The reverse convertible therefore trades away upside for a smoother, coupon-like return profile.
- The coupon is fixed at 7.60% p.a., but the expected annualized return (4.16%) is materially below the coupon rate. The main driver is the tail of barrier-triggered losses: in roughly 14.5% of scenarios the total return (coupons minus any capital loss) is negative. In addition, coupons are only received for the months the product is outstanding, so early calls shorten the coupon stream.
- In about 50.5% of scenarios the product runs to full 2-year maturity (8 coupons, i.e. 15.20 index points of coupons), while 49.5% of scenarios are called early (31.1% at 1 year). Because the holding period varies between 1 and 2 years, annualized figures are best interpreted together with the expected holding period of ~19 months.
- Downside protection is conditional, not absolute: par is repaid unless a stock falls more than 41% from its start (breaching the 59% barrier) and that weakest stock is still below its start at maturity and the product has not been called early. When all three conditions hold, the capital loss equals the worst stock's decline (worst-case simulated total return: -65.96%).
- The product outperforms the risk-free rate (≈0% in CHF) in 85.5% of scenarios, reflecting the coupon income.
Pros (notable strengths)
- Attractive 7.60% p.a. coupon — well above the near-zero CHF money-market rate.
- Coupon is paid regardless of underlying performance, including after a barrier event, and is included in the early-redemption settlement.
- A wide 41% cushion below initial levels before the barrier is breached; even after a breach, par is still repaid if the worst stock recovers to its start by maturity.
- Redemption at par in all scenarios where no barrier event occurs, or where the worst stock finishes at/above its start.
- Collateralised (TCM) structure mitigates issuer counterparty risk relative to unsecured notes.
Note on the worst-of structure: because the payoff keys off the weakest of the three names, the chance of a barrier breach rises with the number of underlyings — a single weak name can drive the payoff, so the structure concentrates rather than diversifies downside risk across the three stocks.
This analysis is for information only and does not constitute investment advice or a suitability assessment.