
12.70% p.a. Multi Barrier Reverse Convertible on Alphabet, IBM & Microsoft (Callable)
Headline Simulation Results
Based on 10,000 Monte-Carlo simulations over the product’s 18-month maximum term:
| Metric | Value |
|---|---|
| Expected annualized return | 10.49% |
| Expected total return (over realized holding period) | 11.29% |
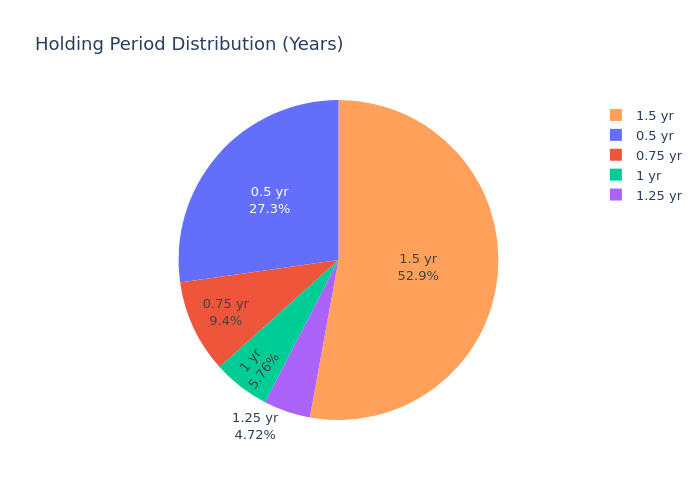
| Expected holding period | 13.4 months |
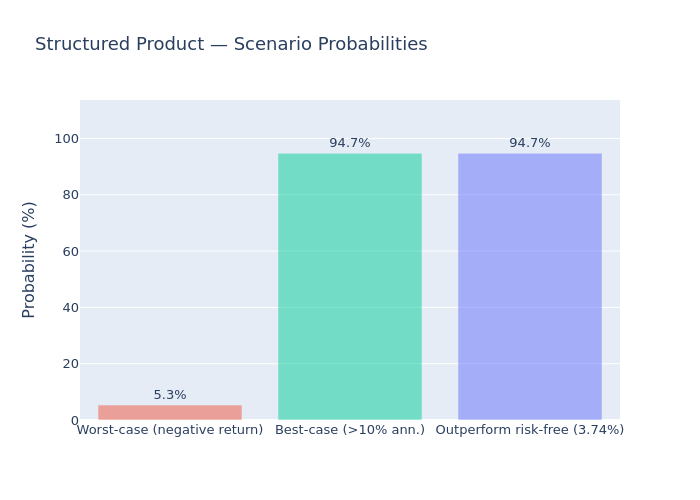
| Probability of a negative return | 5.29% |
| 99% confidence VaR (1-year) | −30.48% |
| Probability of outperforming the risk-free rate (3.74%) | 94.71% |
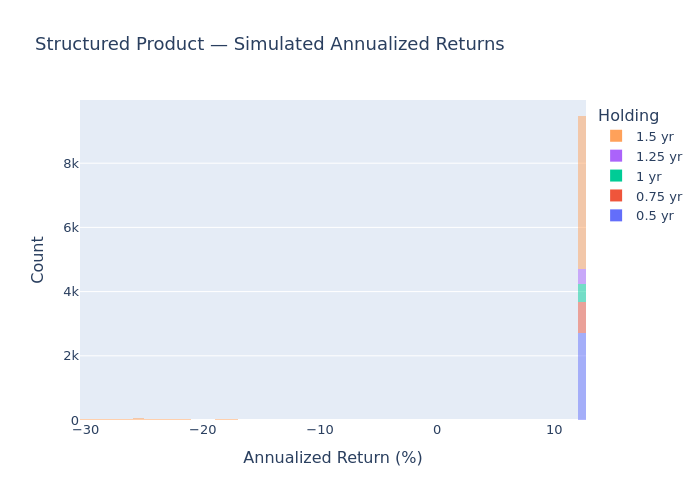
The product behaves bimodally: it either delivers roughly the full coupon (≈12–13% p.a.) or, in the minority of paths where the worst-of barrier is breached and a stock finishes below its starting level, it takes that stock’s downside. Only ~0.01% of simulations land between 0% and 10% annualized.
Basic Product Information
| Term | Detail |
|---|---|
| Type | Multi Barrier Reverse Convertible (Yield-Enhancement), issuer-callable |
| Coupon | 12.70% p.a., paid quarterly (USD 31.75 per USD 1,000) |
| Underlyings | Alphabet (GOOGL), IBM, Microsoft (MSFT) — worst-of |
| Barrier | 49% of initial level, observed continuously |
| Strike | 100% of initial level |
| Issuer call | Quarterly observation from month 6; issuer may redeem at par + coupon |
| Maturity | 27/03/2028 (18 months) |
| Upside | Capped (redemption ≤ par; return comes from coupons only) |
| Currency | USD (no FX/quanto) |
How It Works (Layman’s Explanation)
- You collect a fixed 12.70% p.a. coupon every quarter, regardless of how the three stocks perform — as long as you hold the note.
- Your capital is protected as long as no stock crashes. If none of GOOGL, IBM or MSFT ever trades at or below 49% of its starting price during the term, you get your full 100% back at the end.
- If any one stock touches 49% (“barrier event”), protection is lost. At maturity you then take the worst-performing stock’s fate:
- If that stock finishes below its start → you receive its (depreciated) value, i.e. you take the loss.
- If it has recovered above its start → you still get your full 100% back.
- The upside is capped. Even if all three stocks double, you only get par plus coupons — never more.
- The issuer can call the note early (from month 6, quarterly). If called, you receive par plus the coupon due, and the note ends.
Key Statistics — Structured Product vs. Benchmark
Benchmark = equal-weight basket of GOOGL / IBM / MSFT (total return, dividends included).
| Metric | Structured Product | Underlying Basket (Total Return) |
|---|---|---|
| Expected annualized return | 10.49% | 18.19% |
| Expected annualized volatility | 8.65% | 26.90% |
| Probability of loss | 5.29% | 29.21% |
| 99% VaR (1-year) | −30.48% | −28.41% |
| Return per unit of risk (excess over RF / vol) | 0.78 | 0.54 |
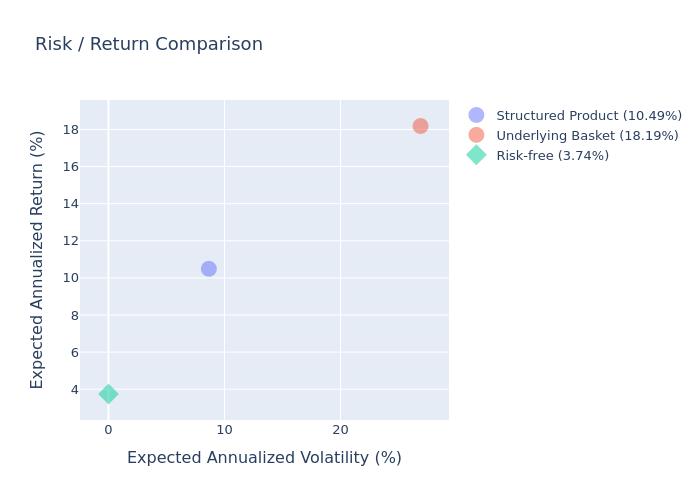
The product gives up a large part of the basket’s expected return (it is capped) but delivers it with roughly one-third of the volatility and a far lower probability of loss.
Simulation Charts
Outcome Distribution vs. Worst-of Underlying
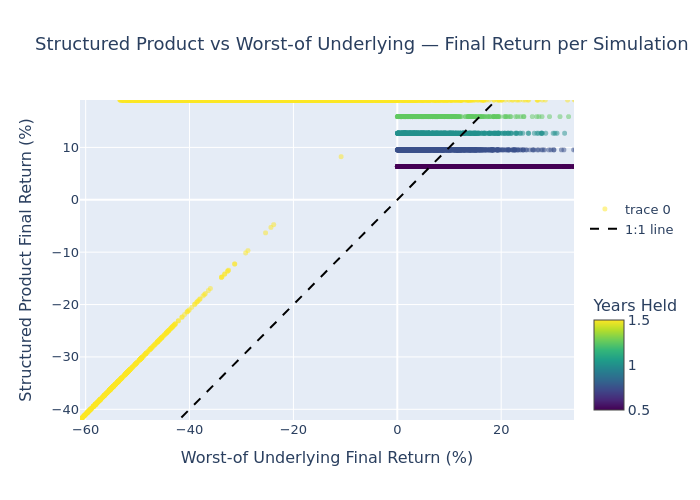
Each point is one simulation; the dashed line is 1:1. Points above the line indicate the product beat the worst-of stock; the vertical cluster near +19% is the capped upside (coupons + par).
Annualized-Return Histograms
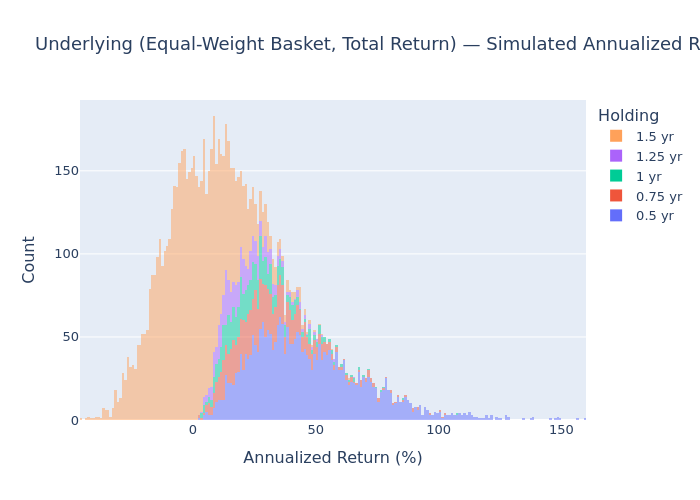
Structured product (left/bimodal, capped near +13%) and the underlying basket (right, wide and symmetric).
Risk / Return Comparison
The product sits far to the left of the basket — much lower volatility for a moderate return sacrifice.
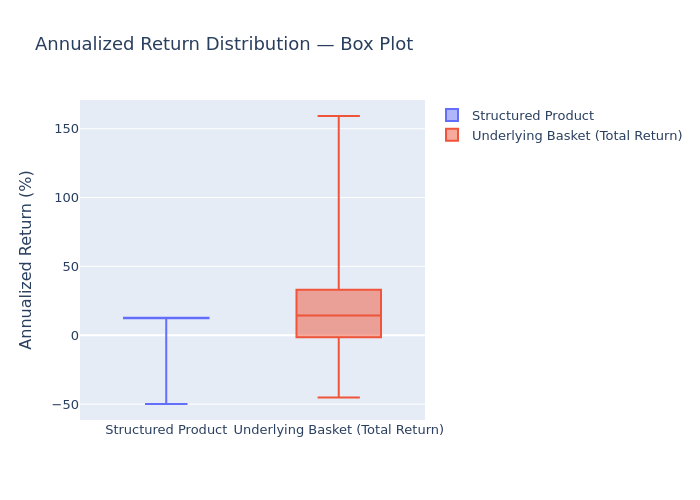
Box Plot — Annualized Returns
The product’s tight, positive distribution (small downside tail) vs. the basket’s wide dispersion.
Scenario Probabilities
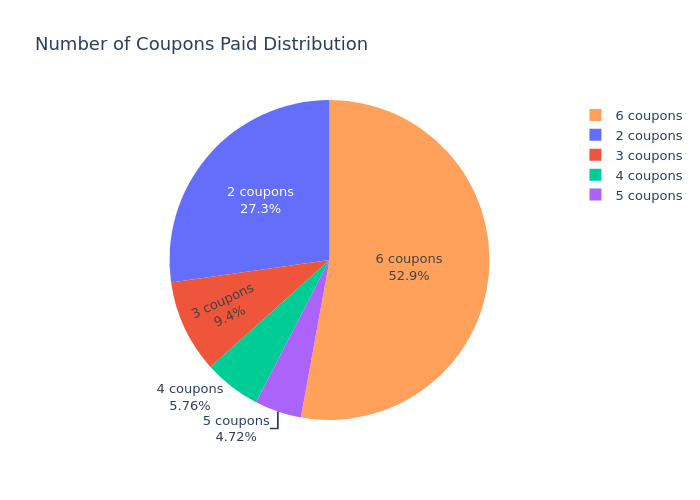
Holding-Period & Coupon Distributions
Investment Commentary
Where the product adds value
- High, predictable income: a 12.70% p.a. coupon — roughly 3.4× the current 3.74% USD risk-free rate — paid quarterly irrespective of market direction.
- Deep, continuous barrier (49%): each stock must fall more than half before protection is lost. The estimated probability of a barrier event is only ~5.5%.
- Low realized volatility (~8.7%) and a low loss probability (~5.3%). Relative to the equal-weight basket of the same three stocks, the product delivers a slightly better return-per-unit-of-risk (0.78 vs 0.54) and a materially better loss profile (5.3% vs 29.2%).
- Frequent early redemption: the issuer is modelled as calling in roughly 47% of paths (concentrated at month 6), returning capital early and recycling the high coupon — the expected holding period is ~13.4 months vs the 18-month maximum.
Trade-offs worth noting
- Upside is fully capped. In the simulations the underlying basket’s 99th-percentile annualized return is very high (~160%), whereas the product cannot exceed ~+13% p.a. In strong rallies the product substantially lags the stocks.
- Concentrated downside when it happens. Although losses are rare, the 99% VaR is −30.5% — comparable to the basket’s (−28.4%) — because a breached barrier in a deeply falling worst-of name transmits nearly the full drawdown. Losses are lumpy, not gradual.
- Worst-of linkage: with three names, the barrier is tested against the weakest stock; the effective probability of a barrier event is higher than for any single name.
- Issuer credit risk (Basler Kantonalbank) applies to all payments; the note is unsecured.
- Return is sensitive to the assumed equity risk premium embedded in the drift; a lower long-run equity return would compress both the product and the benchmark results (the coupon itself is contractual and unaffected).
Figures are model estimates from 10,000 Monte-Carlo simulations and are not a forecast. Returns shown are gross of fees, taxes and transaction costs. Past or simulated performance is not indicative of future results.