
Dual Directional Trigger PLUS — Simulation & Risk Analysis
Simulation & Risk Analysis | Generated by tokenengine.ai Structured Product Evaluator
Underlying: Worst of Nasdaq-100® Technology Sector Index (NDXT) and Russell 2000® Index (RTY)
Term: 4 years
Coupon: None
Issuer: Morgan Stanley Finance LLC (guaranteed by Morgan Stanley)
Note on return conventions: the two headline figures use different averaging methods. The expected annualized return (8.30%) is the mean of each simulation's own annualized return (CAGR), while the expected total return (49.36%) is the mean of each simulation's total 4-year return. Because the simulated payoff distribution is strongly right-skewed (uncapped leveraged upside), the simple annualization of the average total return (~10.5%) is not equal to the average annualized return — the latter is the economically meaningful per-investment figure.
The product is always held to the full 4-year maturity (no early-redemption feature), so the expected holding period is 48 months and annualized figures are not inflated by short holding periods.
This is a 4-year note whose payoff is decided once, at maturity, based on the worst performing of two US equity indices — the tech-heavy Nasdaq-100 Technology Sector Index and the small-cap Russell 2000 Index. There are no coupons and no early call, so the investor receives a single payment after four years. The payment depends on where both indices finish versus their starting levels:
- Both indices finish higher → investor receives principal plus 145.5% of the (worst) index gain — a leveraged upside with no cap. (Assumption: leverage factor set to the midpoint of the 138%–153% range announced in the term sheet.)
- The worst index is down, but neither index falls below 70% of its start → investor receives principal plus 50% of the decline (e.g., a −10% worst index adds +5%). Because the decline cannot exceed 30% here, this bonus is effectively capped at +15%.
- Either index falls below 70% of its start → the 30% buffer disappears and the investor loses 1% for every 1% the worst index has fallen; the payment can approach zero.
In short: the note gives leveraged participation when both markets rise, converts a moderate decline into a small gain, but converts a severe decline in either market into a direct principal loss.
| Statistic | Structured Product | Underlying 50/50 Basket (total return) | Risk-Free (1Y) |
|---|---|---|---|
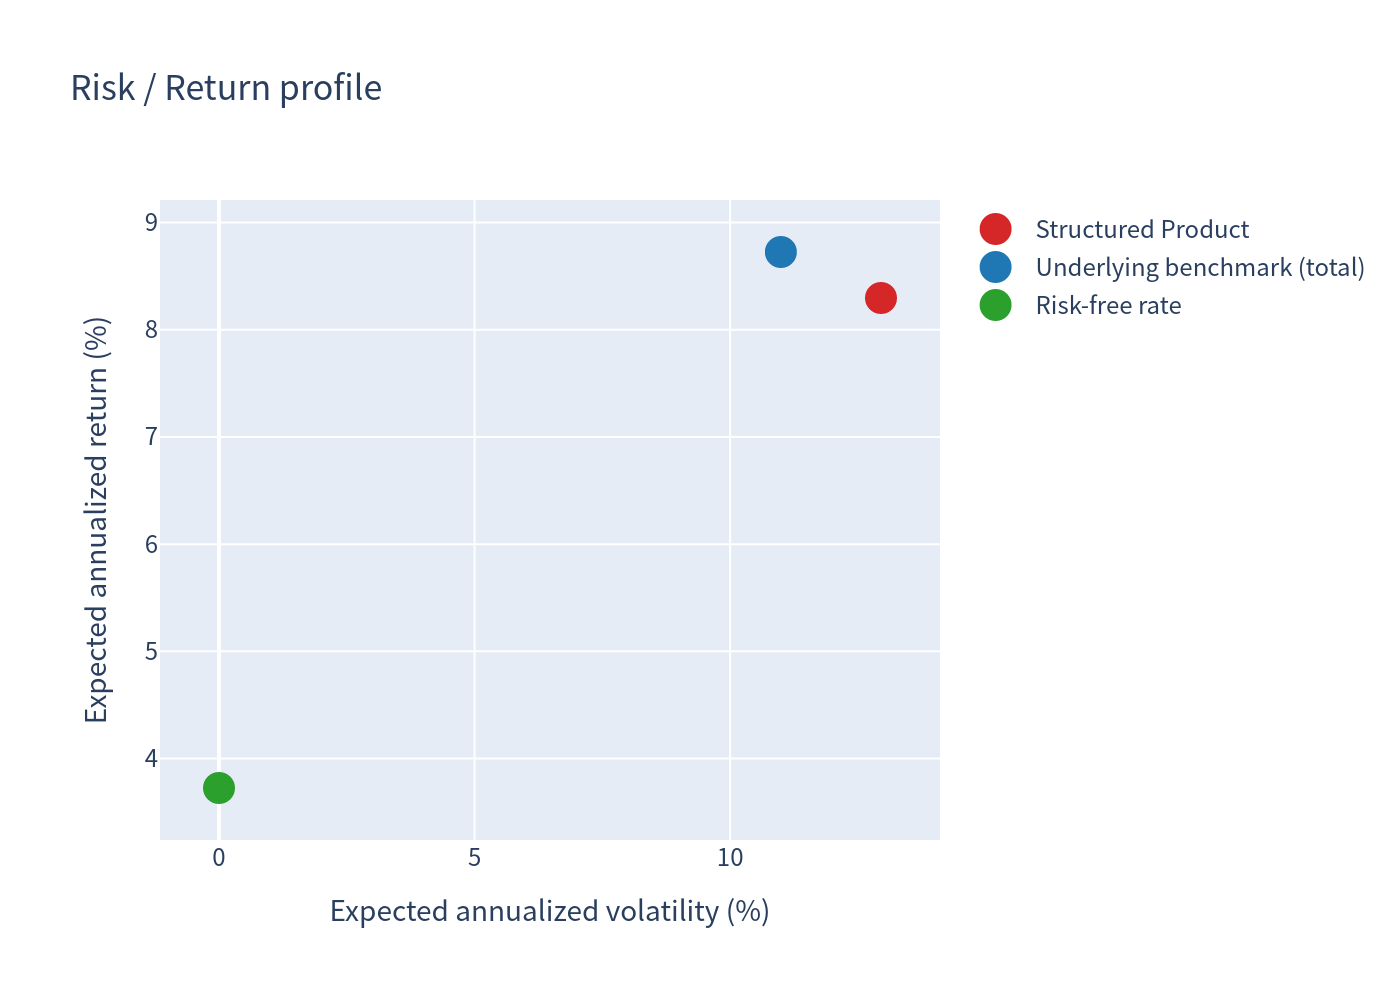
| Expected annualized return | 8.30% | 8.73% | 3.72% |
| Expected annualized volatility | 12.95% | 10.99% | 0.00% |
| Probability of loss | 13.15% | 21.48% | 0.00% |
| 99% VaR (1 year) | −22.52% | −16.76% | 3.72% |
Benchmark = equally-weighted basket of the two underliers (price return + estimated dividend income ≈ 0.66%/yr). Dividend yields are added to the underlying for a like-for-like comparison only.
Maturity Payoff Profile of the Product (per $1,000 notional / 100 index points)
| Median maturity payment | 132.22 points (+32.22% over 4 years) |
| Probability of a loss of principal (payment < 100) | 13.15% |
| Probability of a moderate gain (payment between 100 and 115 points, i.e. +0% to +15%) | 28.29% (this range combines buffer-branch payoffs and small leveraged-upside payoffs) |
| Probability of a gain above 15% (payment > 115 points) | 58.56% |
| Simulated worst payment | reached ~12 points (≈ −88% over 4 years); probability of a total wipeout ≈ 0% |
Simulation Outcomes — Structured Product vs Underlying Basket
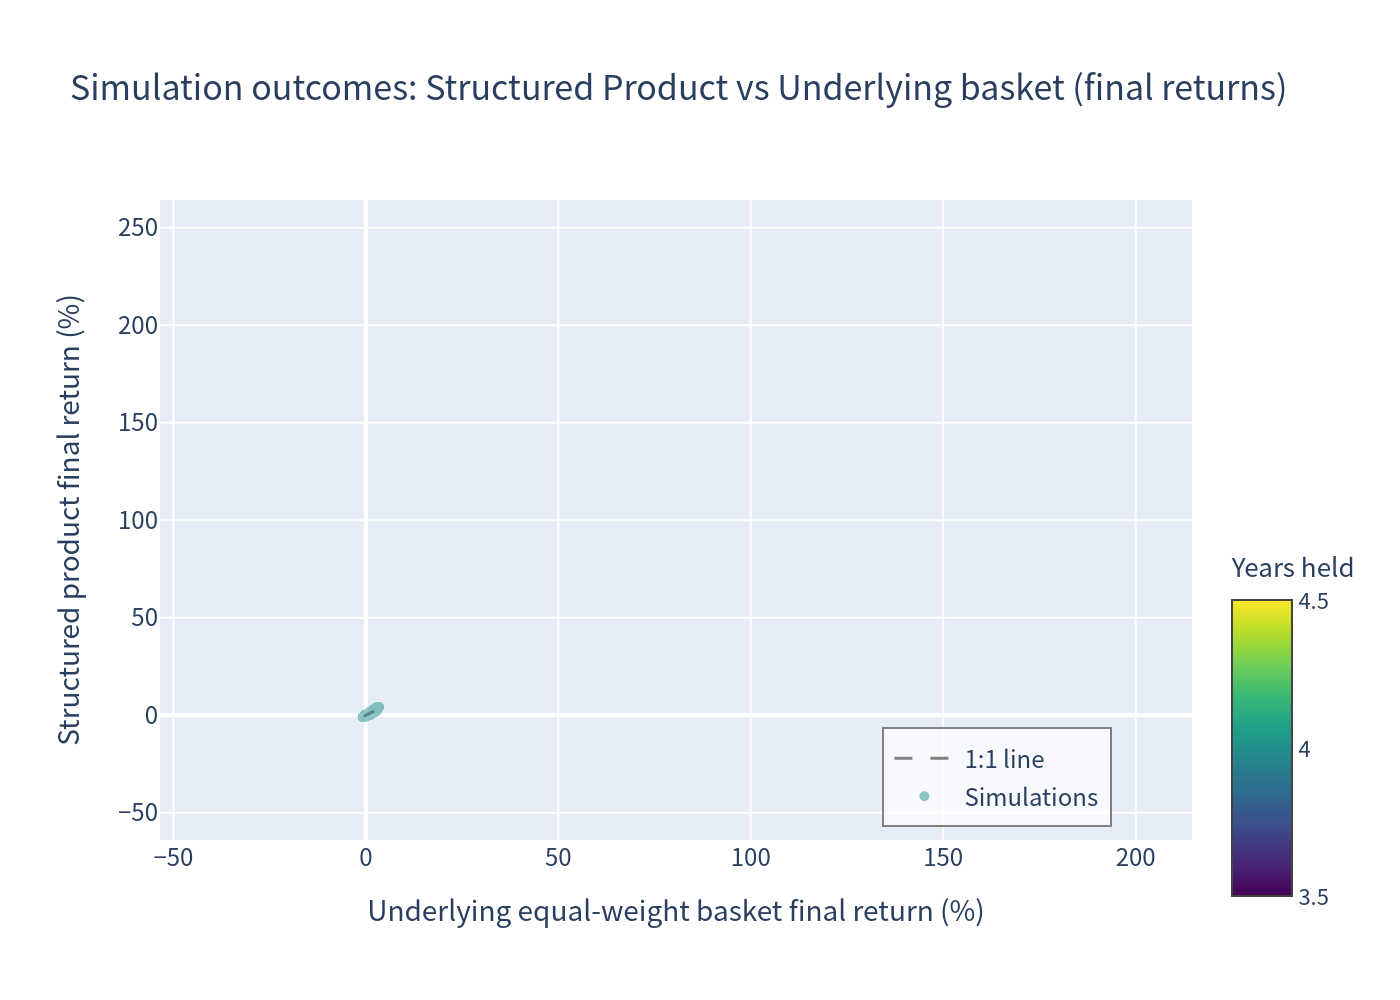
Scatter of each simulated outcome (10,000 paths). Colored by holding period (all paths are held 4 years). The dashed line is the 1:1 reference.
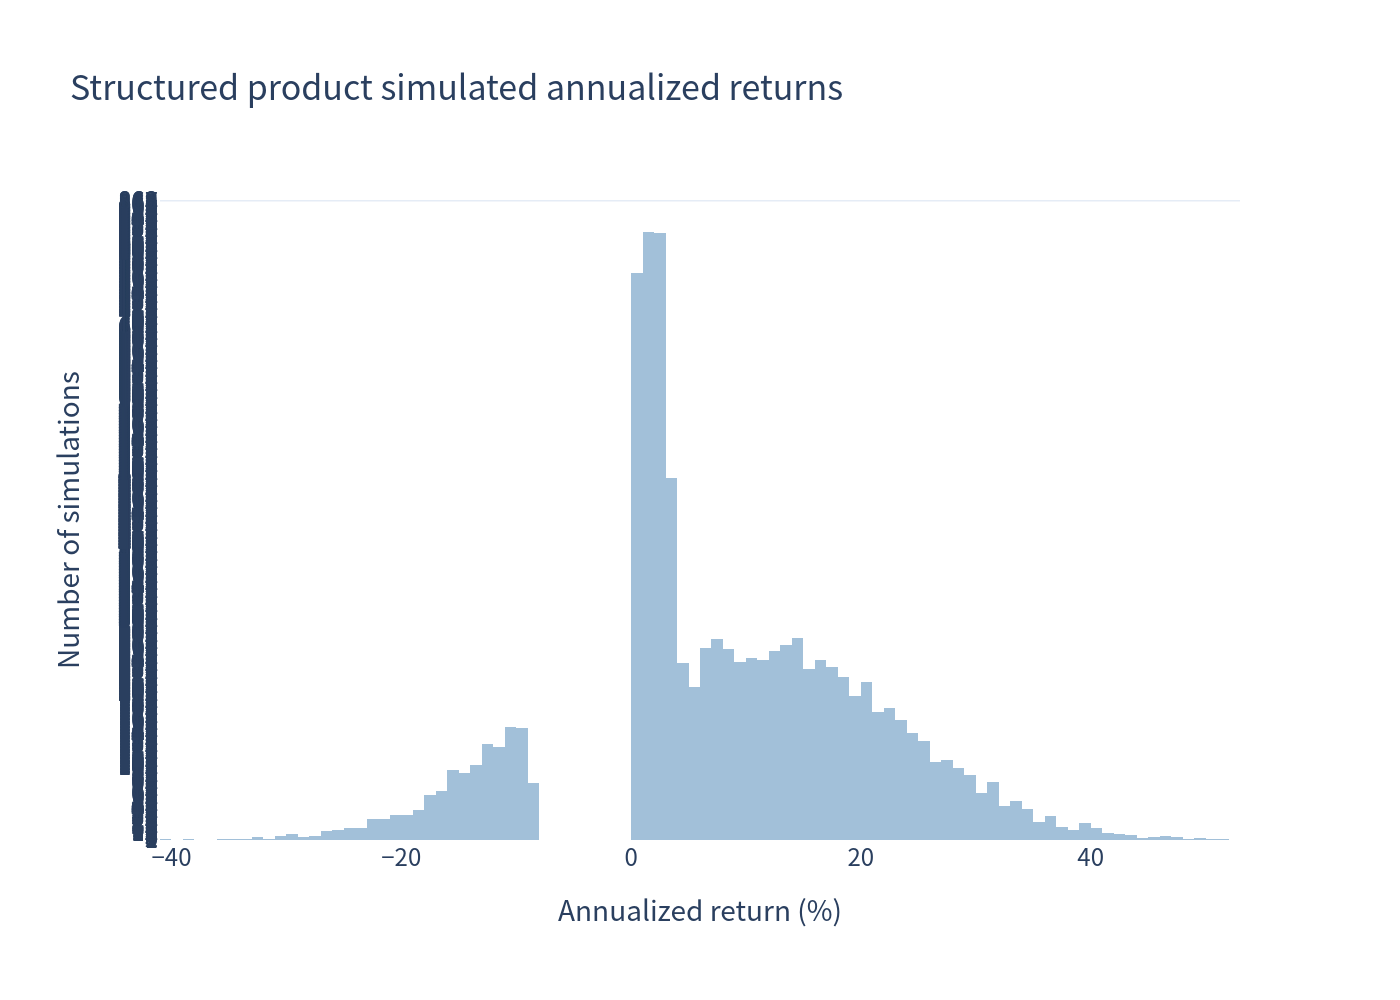
Annualized Return Distributions (1% bins)
Structured product — note the right-skewed, leveraged upside tail versus a shorter left tail thanks to the 30% buffer.
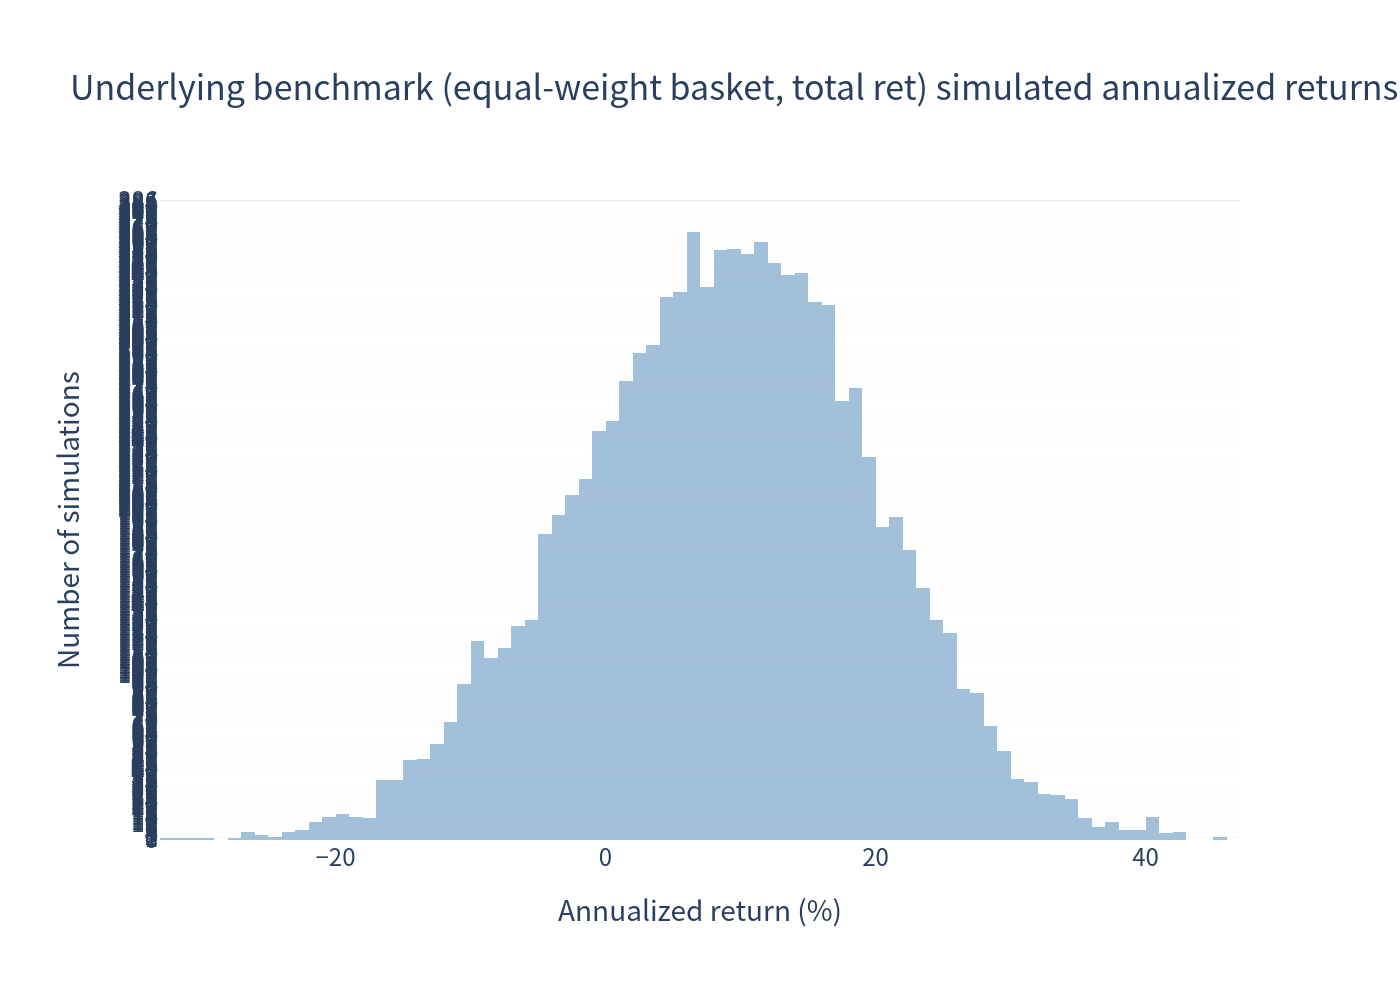
Underlying Benchmark (50/50 Basket, Total Return)
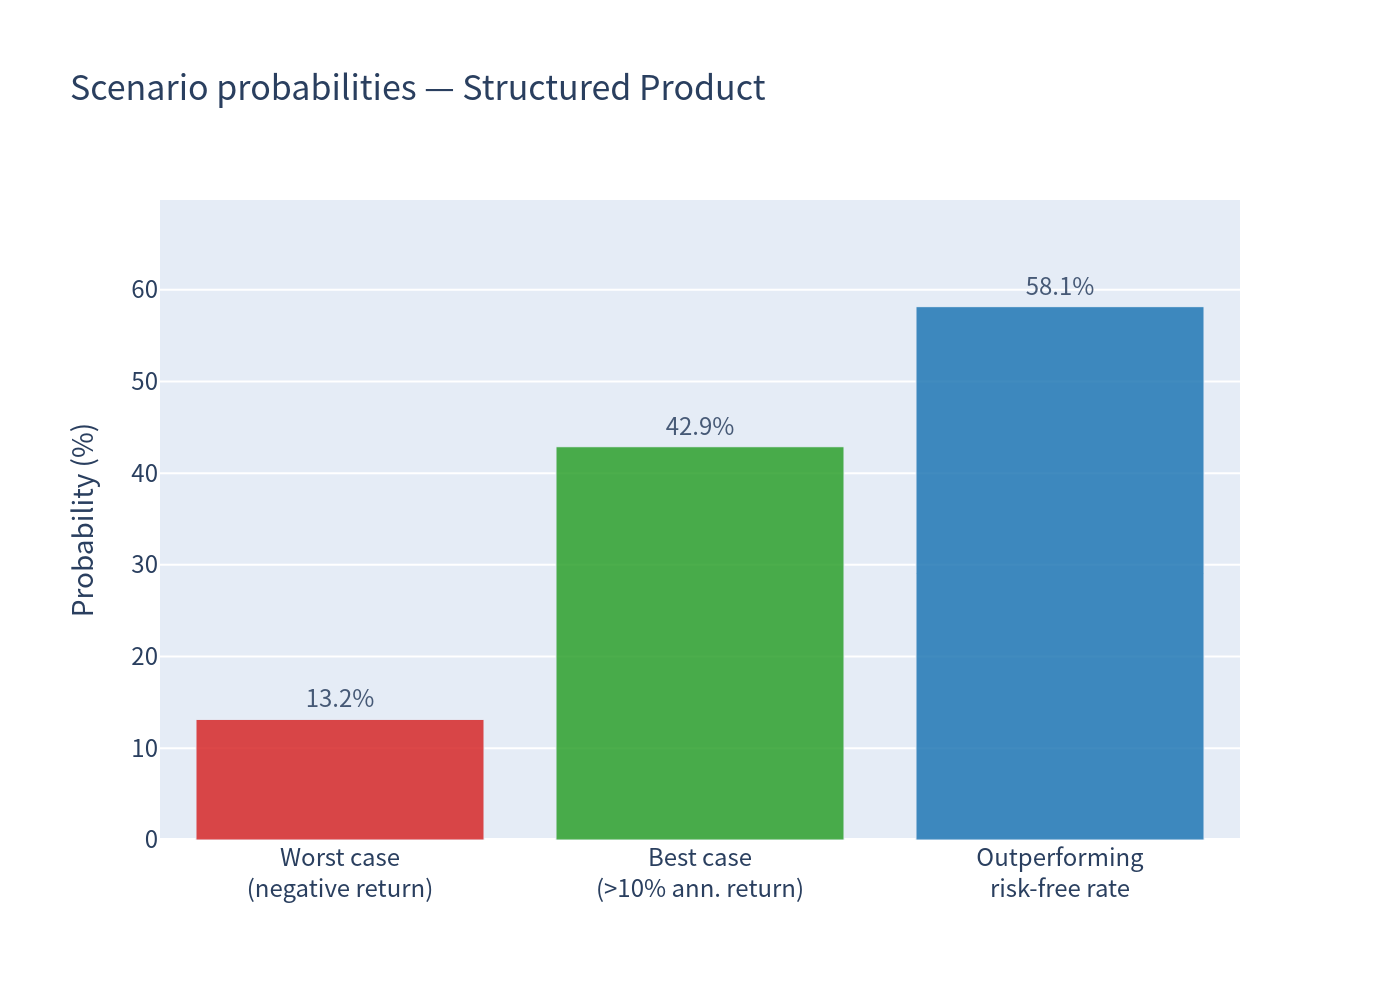
Scenario Probabilities
Chance of a negative return, of a strong gain (>10% annualized), and of beating the risk-free rate.
Risk / Return Profile
Expected annualized return versus expected annualized volatility for the product, the underlying basket, and the risk-free rate.
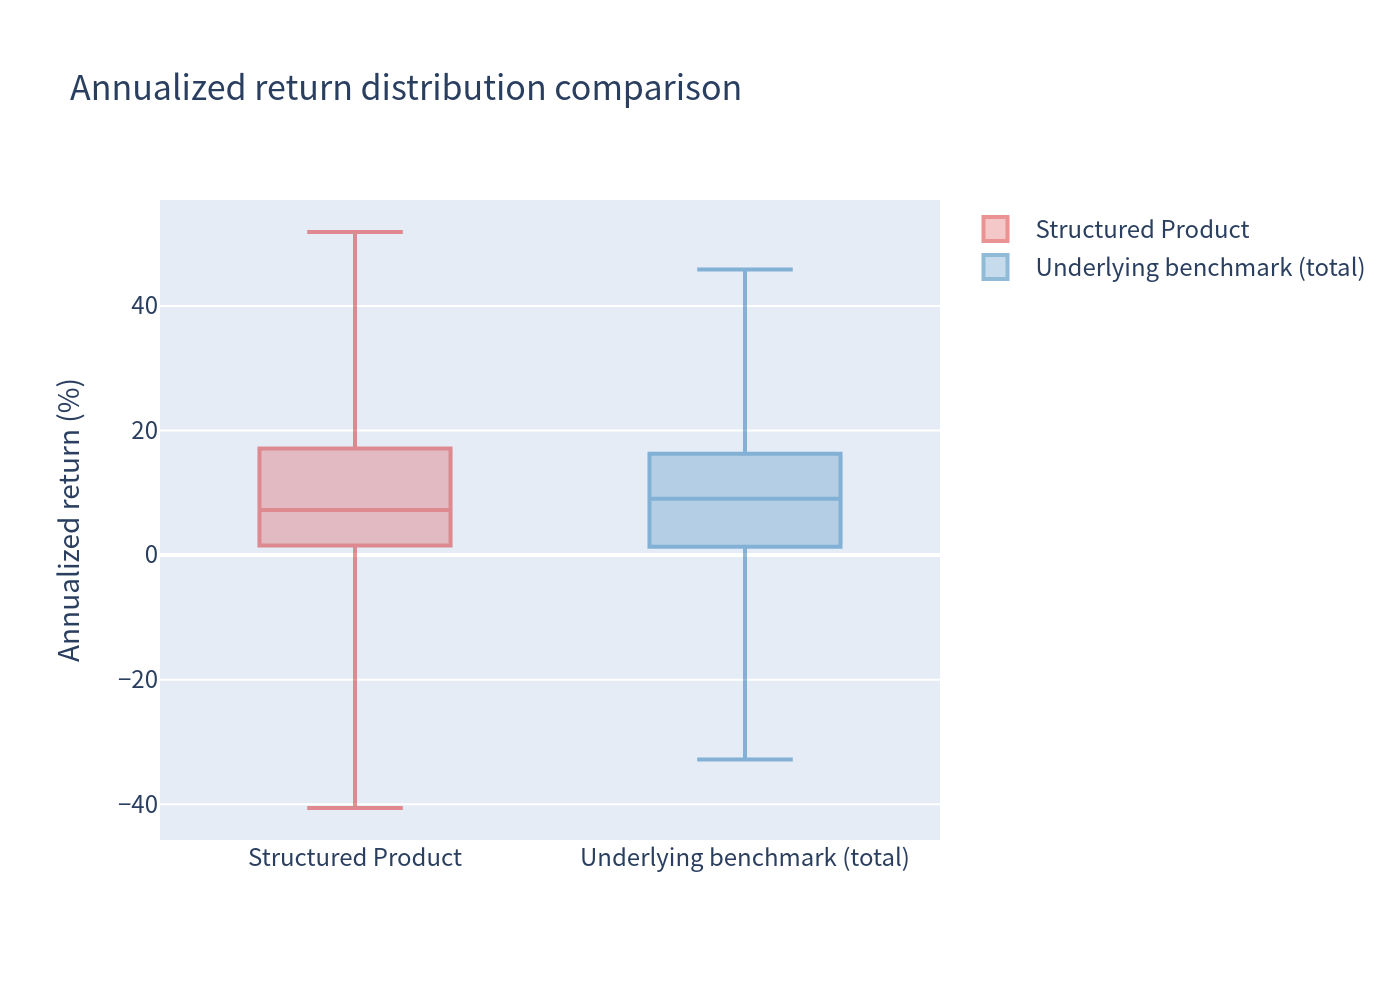
Return Distribution Comparison (Box Plots)
Annualized return distributions of the product and the underlying benchmark.
Attractive features (highlights only):
- Symmetric "dual directional" payoff: gains are available both when markets rise (leveraged, uncapped) and when the worst index falls moderately (positive absolute return of up to +15%).
- Upside leverage without a cap: in rising markets the investor captures 145.5% of the worst index move.
- Downside cushion: a 30% buffer absorbs declines in either index, converting a moderate worst decline into a small positive return — the simulated probability of loss (13.15%) is notably lower than that of the underlying basket itself (21.48%).
- Risk/return profile: expected annualized return of 8.30% remains well above the 1-year risk-free rate of 3.72%, with the product beating the risk-free rate in ~58% of simulated scenarios.
- Well-defined, single-decision structure: no coupon-tracking or early-termination complexity; the payoff is determined once at maturity.
Points of caution reflected in the numbers (informational):
- Tail losses are severe: the 99% VaR of −22.52% (annualized) is worse than the diversified basket's −16.76% because, once the buffer is breached, losses track the worst index with no cushion, and no diversification benefit applies.
- The product's expected annualized return (8.30%) is modestly below the underlying basket's (8.73%) — the cost of the buffer protection in balanced scenarios.
- If either index falls more than 30%, principal is at risk on a 1:1 basis with the worst performer and could be almost fully lost.