
Investment Analysis — 10.00% p.a. Multi Barrier Reverse Convertible on Alcon, Lonza, Sandoz
1. Headline Simulation Results (10,000 Monte-Carlo paths)
The product is a yield-enhancement structure: it pays a fixed 10.00% p.a. coupon (CHF 25.00 per quarter per CHF 1'000) and returns your capital at maturity unless the worst of the three shares breaches its 59%-of-initial barrier and finishes below its initial level. The trade-off for the high coupon is that upside is fully capped and the return is tied to the worst-performing of three names.
| Metric | Structured Product |
|---|---|
| Expected annualized return | +4.39% |
| Expected annualized volatility | 10.60% |
| Probability of a negative return | 22.09% |
| 99% confidence VaR (1-year) | -26.97% |
| Expected total return (over realized holding period) | +4.08% |
| Expected holding period | 15.95 months (≈1.33 yrs) |
| Probability of receiving income (positive return) | 77.91% |
2. Product Overview
What you get paid
A fixed coupon of CHF 25.00 every quarter (2.50 index points), paid regardless of how the shares perform, for as long as the note is outstanding.
What you get back at the end (if not called early)
- If no barrier event (none of the three shares ever trades at or below 59% of its starting level, observed continuously): you receive 100% of the denomination back.
- If a barrier event has occurred:
- if the worst-performing share ends at or above its initial level → 100% of denomination;
- if the worst-performing share ends below its level → you receive a value equal to that worst-performing share's level, i.e. a loss proportional to that share's fall below its starting level.
In short, the only way to lose capital is if at least one underlying falls 41% or more below its starting level at some point and the worst performer is still below where it started at maturity.
Issuer call (early redemption): The issuer (not the investor) may redeem the note early, on any of 5 quarterly observation dates (starting ~6 months in), returning par plus the coupon of that date. The issuer will typically call when it is favourable to do so (e.g. when the shares are at or above their starting levels).
Upside cap: Yes — there is no upside participation. The maximum annualized return is roughly +10% p.a. (coupons only = 17.50 index points maximum, or ~9.65% p.a. if held the full 21 months).
3. Key Statistics — Product vs Underlying (annualized)
The benchmark is an equal-weight basket of Alcon, Lonza and Sandoz. Total-return figures add the basket dividend yield of ~0.84% p.a.
| Metric | Structured Product | Underlying (price) | Underlying (total return) |
|---|---|---|---|
| Expected annualized return | 4.39% | 12.13% | 12.97% |
| Expected annualized volatility | 10.60% | 20.86% | 20.86% |
| Probability of loss | 22.09% | 31.29% | 29.54% |
| 99% confidence VaR (1-year) | -26.97% | -22.97% | -22.13% |
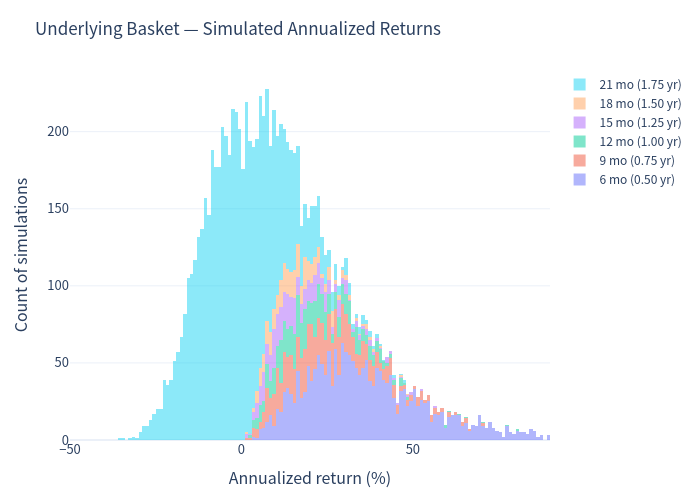
Interpreting the underlying's high annualized figure. The underlying is measured over the same, sometimes short, window in which the product is outstanding (it is often redeemed early precisely when the market is high). Combined with the linear annualization applied to sub-12-month holdings, the mean of per-simulation annualized returns is inflated relative to the average total return. On a total-return basis over the realized holding period: product +4.08% vs underlying basket +8.30% (average holding ≈ 15.95 months). The point stands either way: the product sacrifices a meaningful share of upside in exchange for far lower volatility and a lower probability of loss.
4. Charts
4.1 Simulation outcomes — product vs underlying
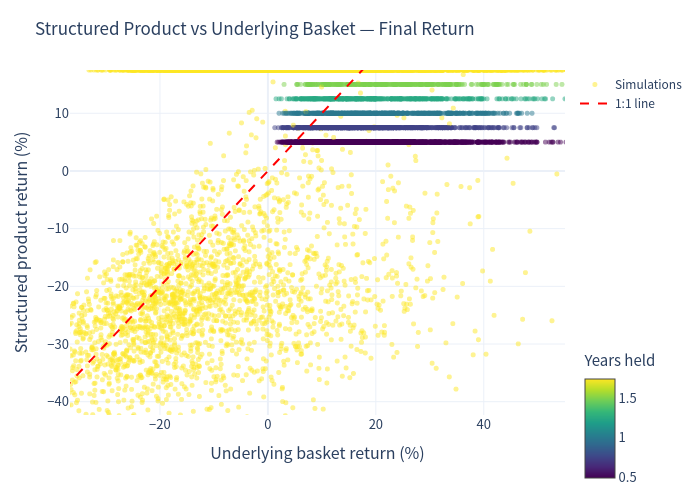
Each point is one simulation; colour = years held; dashed red = 1:1 line. Points below the 1:1 line lose relative to the underlying; the flat ceiling at ~+17.5% shows the capped upside.
4.2 Annualized return distributions (stacked by holding period)
Underlying basket:
Structured product:
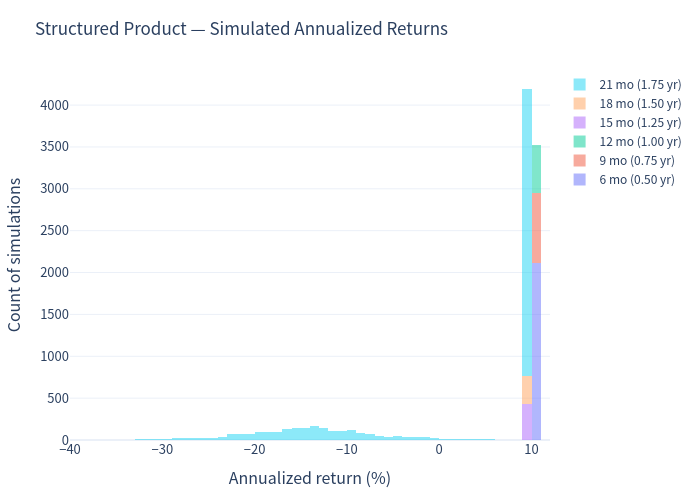
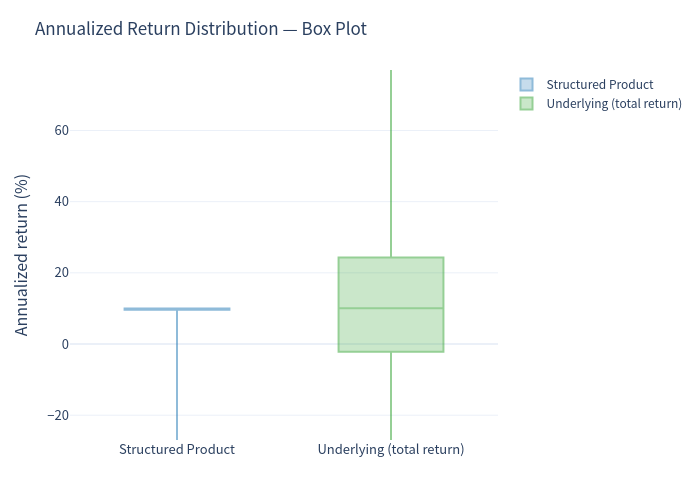
The product distribution is sharply bimodal: ~77% of paths cluster near the capped maximum (~9–10% p.a.), while ~22% of paths fall into the loss region when the barrier is breached and a share finishes below its strike.
4.3 Scenario probabilities
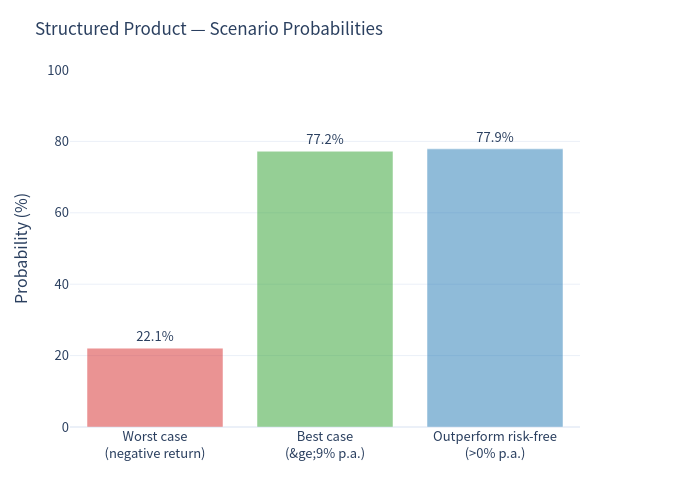
- Worst case (negative return): 22.09%
- Best case (≥ 9% p.a.): 77.25%
- Outperform cash / risk-free (> 0% p.a.): 77.91%
4.4 Risk / return
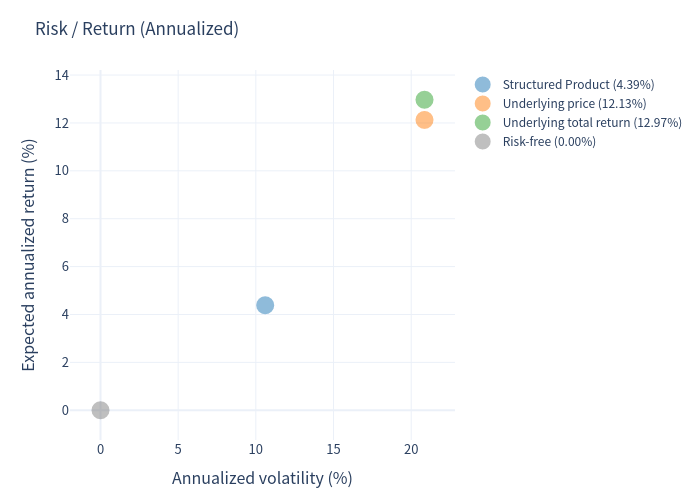
The product sits well to the left (lower risk) and below (lower return) the underlying — the classic yield-enhancement trade-off.
4.5 Annualized return — box plot
4.6 Holding period & coupon count
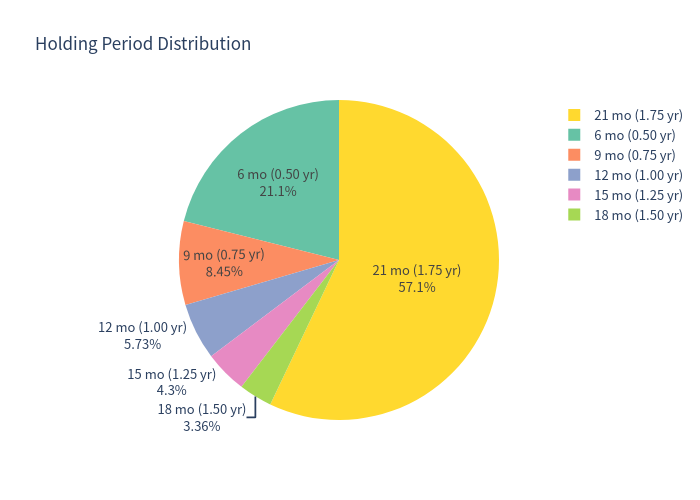
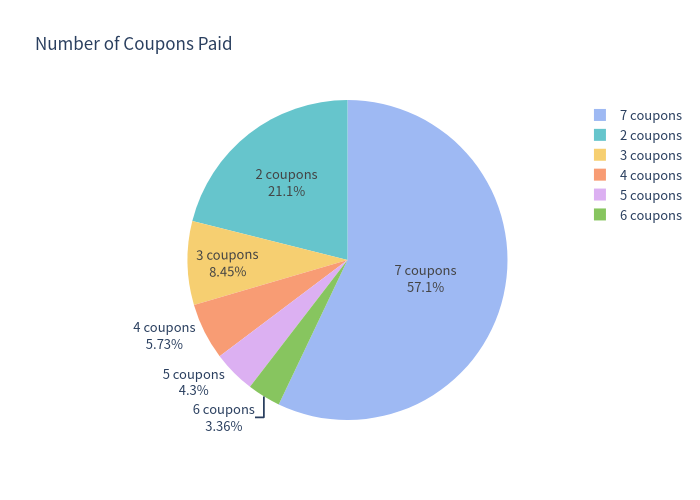
The issuer's call option materially shortens the average life. The product is redeemed early in ~43% of paths (median life is a full 21 months).
| Holding period | Probability | Coupons paid | Probability |
|---|---|---|---|
| 6 months | 21.09% | 2 | 21.09% |
| 9 months | 8.45% | 3 | 8.45% |
| 12 months | 5.73% | 4 | 5.73% |
| 15 months | 4.30% | 5 | 4.30% |
| 18 months | 3.36% | 6 | 3.36% |
| 21 months | 57.07% | 7 | 57.07% |
5. Investment Commentary
Potential merits
- High headline coupon — 10.00% p.a. paid quarterly, well above CHF cash rates (~0%) and the basket dividend yield (~0.84%).
- Substantial downside buffer — capital is only at risk if a share falls 41% or more from its starting level (barrier at 59%) at any point.
- Conditional capital protection — even after a barrier breach, if the worst share recovers to its starting level by maturity, par is returned (this "recovers" ~3% of all barrier-hit paths).
- Lower volatility & lower loss probability than holding the basket directly (vol 10.60% vs 20.86%; loss probability 22.09% vs 29.54% on a total-return basis).
- Short maximum tenor (~21 months).
Risks / drawbacks
- Worst-of exposure — the payoff is driven by the single weakest of three correlated life-science names, which is more fragile than any one share alone.
- Capped upside — no participation in share gains; maximum return is the coupon stream (~+10% p.a.).
- Continuous barrier — a breach at any moment (even intraday) counts, so a brief spike down can trigger the loss mechanism.
- Issuer call / reinvestment risk — the issuer will call when markets are strong, so the generous coupon is least likely to persist exactly when it is "free"; ~43% of paths are called early.
- Credit risk — the notes are obligations of Leonteq Securities AG (rated BBB- by Fitch), guaranteed by PostFinance Ltd.
This analysis is for information purposes only and does not constitute financial advice or a suitability assessment.