
11.00% p.a. Multi Barrier Reverse Convertible on ABB, Alcon, Kühne + Nagel & Zurich Insurance (Callable)
Headline Simulation Results
| Metric | Value |
|---|---|
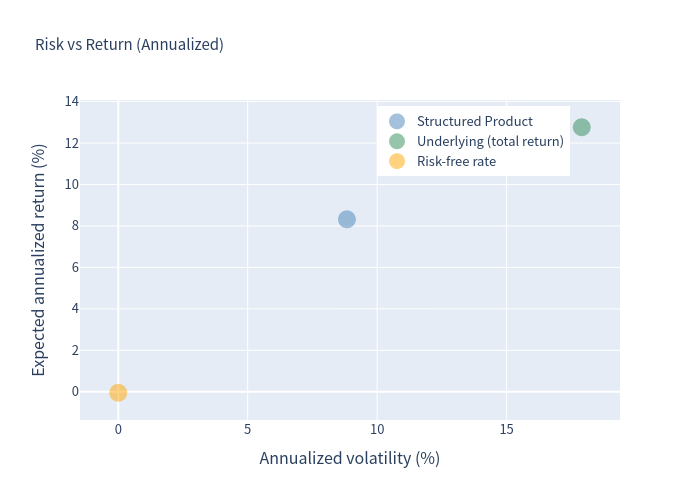
| Expected annualized return | 8.32% |
| Expected annualized volatility | 8.83% |
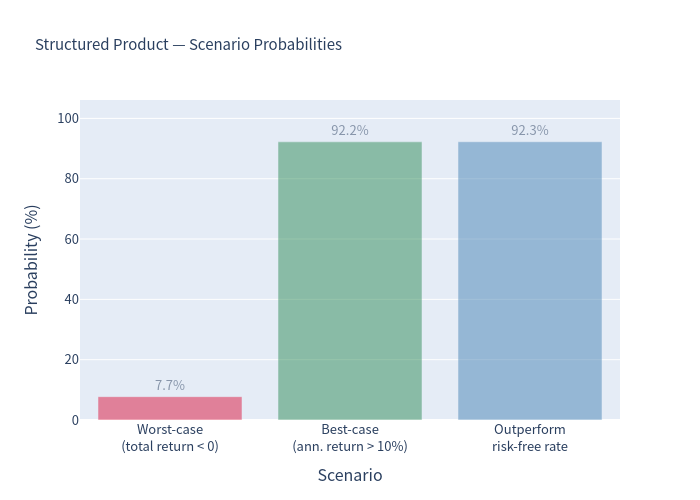
| Probability of a negative return | 7.74% |
| 99% confidence VaR (1 year) | –28.09% |
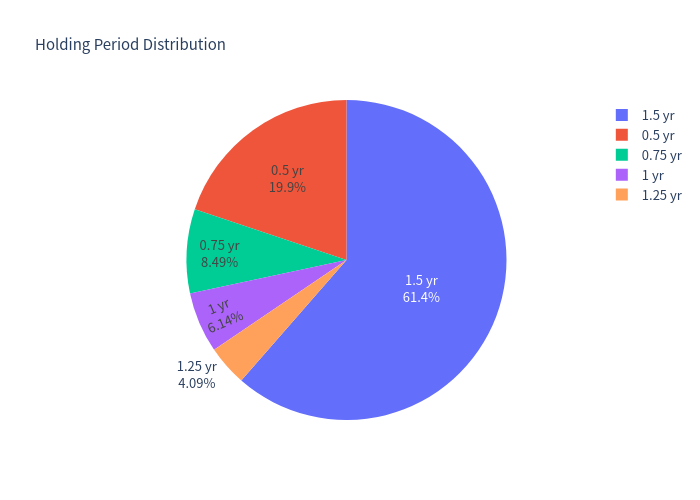
| Expected holding period | 14.4 months (≈ 1.20 years) |
| Expected total return over the realized holding period | 9.53% |
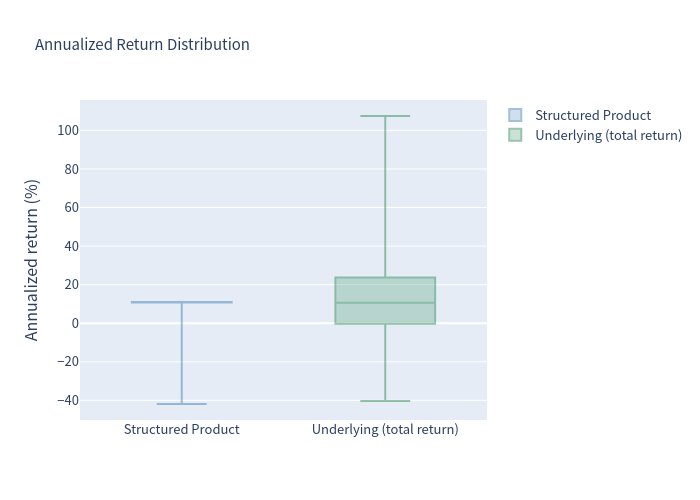
| Median annualized return | 10.72% |
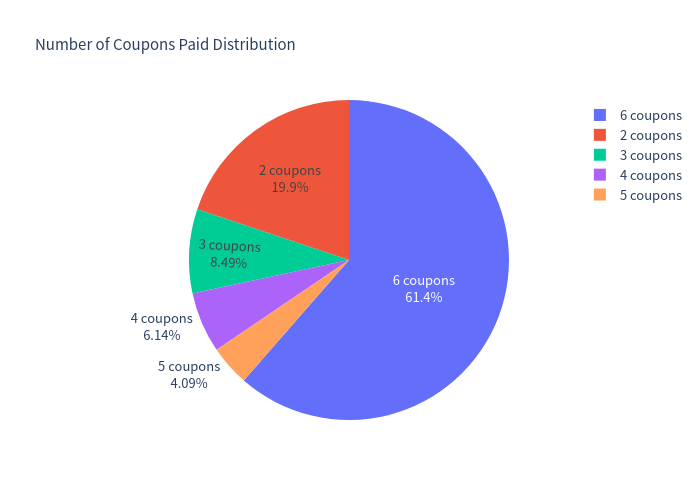
| Average coupons received | 13.17 index points (4.8 of 6 coupons) |
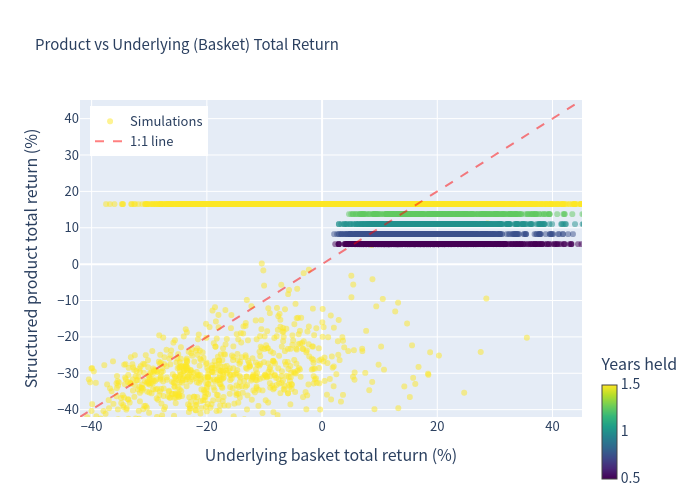
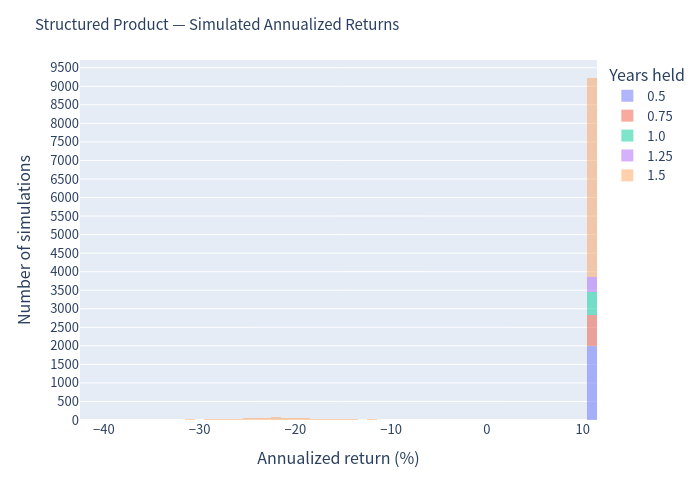
The product pays a fixed coupon and returns par in the large majority of outcomes, so annualized returns cluster around the capped ~10–11% maximum. In roughly 28% of simulations the product is redeemed within 9 months, which makes short, linearly-annualized figures look large and/or extreme — total return and holding period should be read together.
How It Works (Plain English)
- Fixed coupon. You receive 11.00% p.a. (CHF 27.50 per quarter per CHF 1,000, i.e. 2.75 index points) for as long as the product is alive — regardless of how the four shares move. Over the full 18-month life that is 16.50 points.
- Four-share, worst-of downside. The payoff is linked to the worst performer of ABB, Alcon, Kühne + Nagel and Zurich Insurance (all CHF-quoted, so there is no currency exposure).
- 55% continuous barrier. If none of the four shares ever trades at or below 55% of its starting level (monitored continuously), you get your par (100) back at maturity plus every coupon.
- If the barrier breaks. At maturity you either (a) receive par — if the worst-performing share has recovered to ≥ 100% of its start — or (b) you are delivered the worst-performing share and therefore absorb its fall below 100%.
- Issuer call. The issuer may redeem early on a quarterly basis (first callable at month 6). If called, you receive par plus the coupon, and nothing thereafter.
- Upside is capped: the maximum you can ever receive is par plus the fixed coupons. There is no participation in share-price gains.
Key Statistics (Annualized, Simulated)
| Expected annualized return | Annualized volatility | Probability of loss | 99% VaR (1 yr) | |
|---|---|---|---|---|
| Structured Product | 8.32% | 8.83% | 7.74% | –28.09% |
| Underlying basket (price) | 10.38% | 17.90% | 31.48% | –22.94% |
| Underlying basket (total return, incl. dividends) | 12.76% | 17.90% | 25.76% | –20.56% |
| CHF risk-free rate (1-yr avg) | –0.05% | 0.00% | – | – |
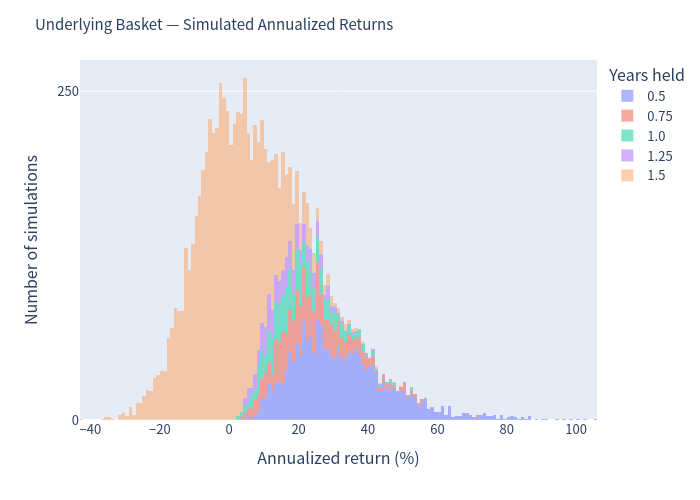
Underlying = equal-weight basket of the four shares, measured over the same holding period as the product in each simulation. Because early redemption happens precisely when the market is strong, these per-simulation underlying figures are flattered by the call; on a pure 18-month buy-and-hold basis the same basket returns ≈5.50% p.a. (price) / ≈7.89% p.a. (total return).
Charts
Product vs underlying outcome
Each dot = one simulation; 1:1 line for reference.
Underlying basket — distribution of annualized returns
Structured product — distribution of annualized returns
Scenario probabilities (structured product)
Risk vs return
Annualized return distribution (box plot)
Holding-period distribution
Number-of-coupons distribution
Investment Commentary
Pros
- High visible coupon (11.00% p.a.) in a market where CHF cash rates are around zero — a large pickup versus deposits.
- Coupons are paid in almost all states of the world — even if the shares fall sharply — provided the product has not been called early (a barrier event does not stop the coupons).
- Par is returned in the large majority of paths: ≈92% of simulations redeem at exactly par (100) plus coupons; only ≈7.7% suffer a capital loss.
- Meaningful downside cushion: the 55% barrier plus the ~16.5 points of total coupons means the four shares can fall materially before capital is at risk. The probability of a capital loss is only ≈7.7%, versus ≈25–35% for owning the basket outright.
- Much lower volatility (≈8.8% annualized) than the underlying basket (≈17.9%) — the coupon-plus-par profile smooths most outcomes.
Cons / Points to Watch
- Worst-of linkage and a hard barrier. Although losses are rare, when they happen they are severe: the product participates fully in the worst performer below 100% once the 55% barrier is breached. This creates a fat left tail — the 99% VaR (–28.1%) is actually worse than the underlying basket's (–22.9%), despite the lower loss probability.
- Capped upside and an issuer call that bites asymmetrically. You never share in rallies, and the issuer is assumed to call the product precisely when the shares are doing well (first callable at month 6; ≈39% of paths are called early). You are therefore left holding the product longest exactly when markets are weakest.
- Concentrated, correlated Swiss exposure. All four names are Swiss; ABB, Zurich and Kühne + Nagel in particular are cyclically correlated, so "four shares" diversifies less than it appears when it matters.
- Credit and liquidity risk. Returns assume the issuer performs; secondary-market pricing is at the issuer's discretion.