
Multi Barrier Reverse Convertible (Worst-of) on CoreWeave, Nvidia & Oracle — Quanto CHF
1. Headline Simulation Results
| Metric | Result |
|---|---|
| Expected annualized return | 20.69% |
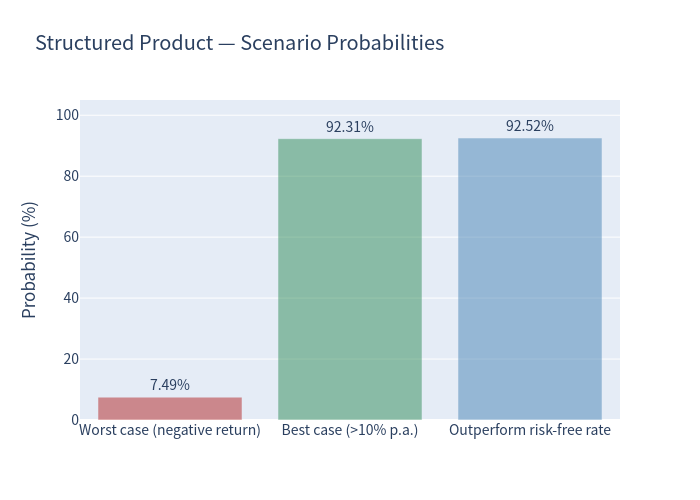
| Probability of a negative return | 7.49% |
| 99% confidence VaR (1 year) | -24.87% |
| Expected total return over the realized holding period | 19.36% |
| Expected holding period | 11.56 months (median 15 months) |
| Coupon rate (paid in any case) | 24.20% p.a. (CHF 60.50 quarterly per CHF 1,000) |
| Probability the barrier is breached | 7.84% |
| Probability of early redemption (issuer call) | 44.30% |
The product offers a very high fixed coupon in exchange for contingent downside exposure to the worst-performing of three technology names. In the simulation the coupon income dominates: the strategy is expected to return about 20.69% per year, comfortably above the equal-weighted underlying basket (15.20% p.a. total return), and it loses money in only about 7.5% of paths. However, when the worst-of falls through the 49% barrier the losses can be severe, producing a 99% VaR of -24.87%, and a return profile with a hard cap and a fat left tail.
2. Product at a Glance
| Feature | Detail |
|---|---|
| Issuer | Leonteq Securities AG, Guernsey Branch |
| Underlyings (Worst-of) | CoreWeave Inc. (CRWV), NVIDIA Corp. (NVDA), Oracle Corp. (ORCL) |
| Coupon | 24.20% p.a. — CHF 60.50 per CHF 1,000, paid quarterly, in any case |
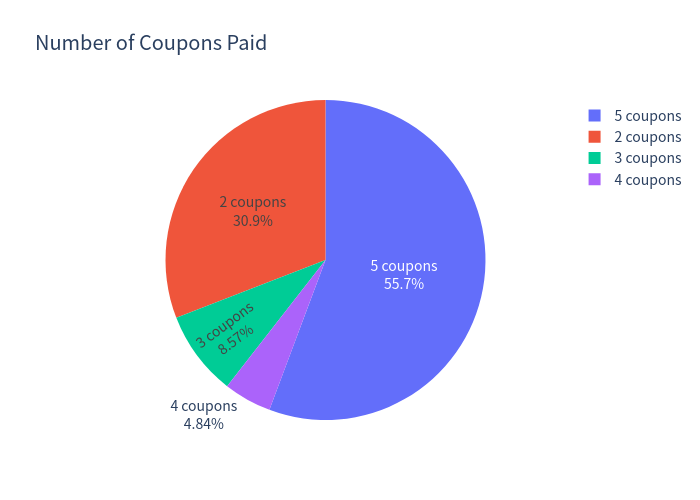
| Coupon dates | Dec-2026, Mar-2027, Jun-2027, Sep-2027, Dec-2027 (5 payments) |
| Barrier (kick-in) | 49% of initial, observed continuously over the whole life |
| Strike | 100% of initial |
| Early redemption | Issuer call (discretionary) on 3 quarterly observation dates (Mar/Jun/Sep-2027), paying par + coupon |
| Upside | Capped — no participation above par + coupons |
| Settlement | Quanto CHF (USD underlyings, FX fixed) |
| Maturity | Dec-2027 (15 months) |
| Denomination | CHF 1,000 |
3. How It Works (in plain terms)
The investor buys a high-yield note linked to three tech stocks. Three things can happen:
- Coupons are always paid. Every quarter the investor receives CHF 60.50 per CHF 1,000 no matter how the stocks perform. Over the full term this totals CHF 302.50 (30.25% of par).
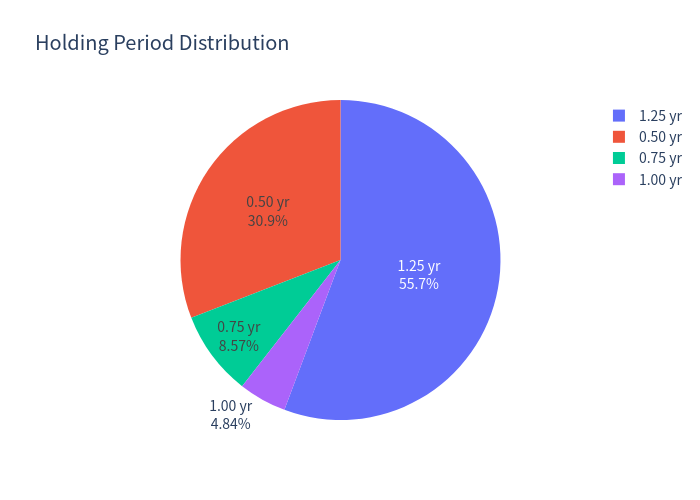
- The issuer can call the note early. On each of three quarterly dates the issuer may redeem at par plus the current coupon. In the model this happens in ~44% of paths (when all three stocks are trading at or above their starting levels), cutting the term short at ~6, 9 or 12 months.
- At maturity the downside depends on the 49% barrier. If the worst of the three stocks never traded at or below 49% of its starting level, the investor gets par (100%) back plus coupons. If the barrier was breached and the worst performer is below its starting level at maturity, the investor receives the worst-performing stock's performance — i.e., they take the full downside of the weakest name from its starting level, paid in cash, plus coupons. If the barrier was breached but the worst performer has recovered to at least its starting level by maturity, the investor still receives par (100%) plus coupons.
The trade-off: a market-leading coupon versus only 51% of downside cushion and full "worst-of" exposure to three volatile, highly-correlated names if that cushion is broken.
4. Key Statistics
| Metric | Structured Product | Underlying (Equal-weight basket, total return) |
|---|---|---|
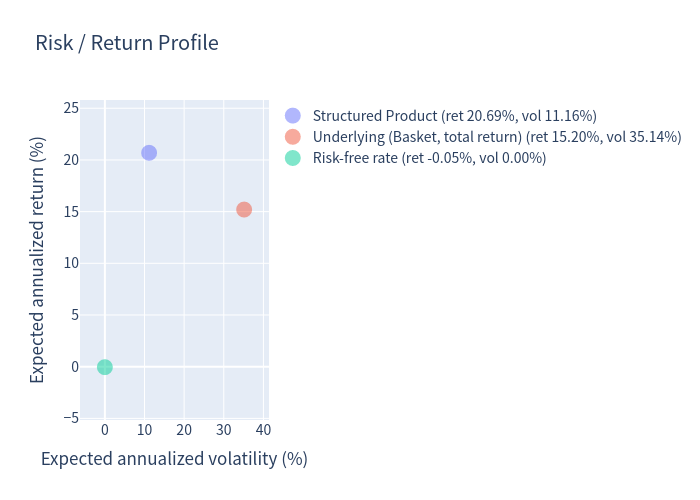
| Expected annualized return | 20.69% | 15.20% |
| Expected annualized volatility | 11.16% | 35.14% |
| Probability of loss | 7.49% | 39.17% |
| 99% confidence VaR (1 year) | -24.87% | -40.76% |
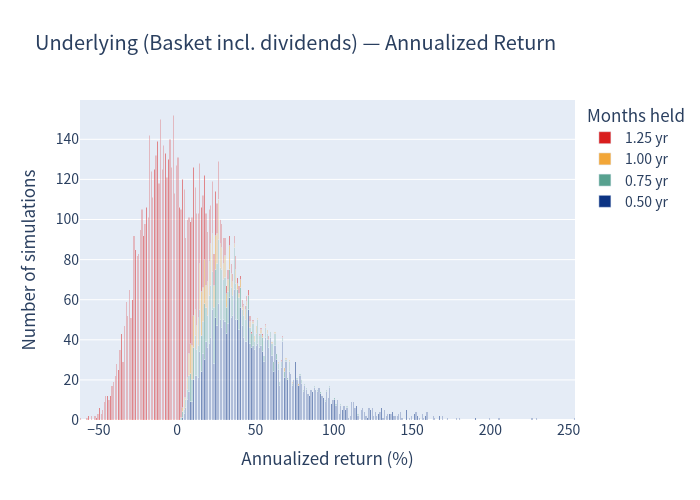
The basket represents an equal-weighted, quarterly-rebalanced holding of the three underlyings including dividend income (0.62% blended yield).
5. Simulation Charts
5.1 Outcome scatter — product vs underlying
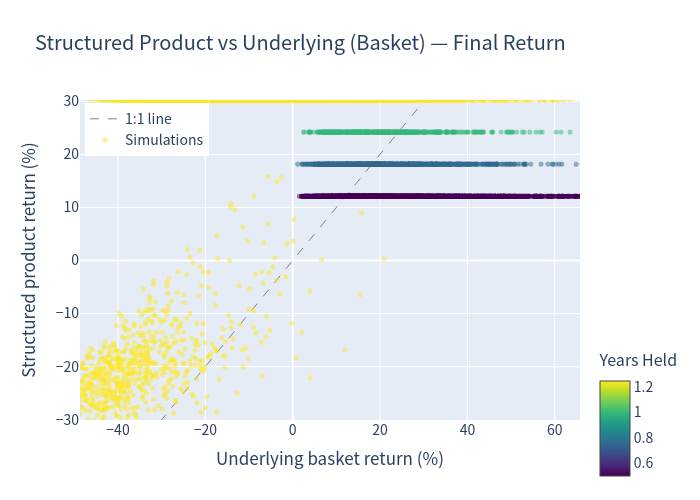
Each point is one simulated path; colour shows holding period. The product's return is capped on the upside and tracks the basket downward only when the barrier has been breached (points below the 1:1 line).
5.2 Underlying basket — annualized return distribution
5.3 Structured product — annualized return distribution
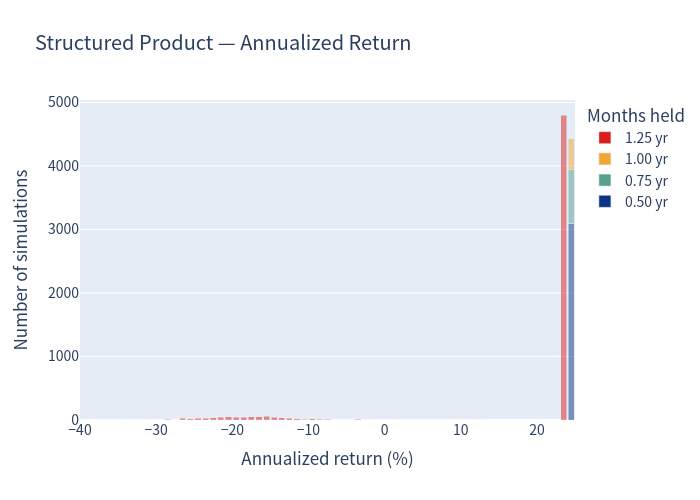
Note the dense mass at ~+20–25% (coupon accrual) and the small, separate left tail representing barrier-breach losses.
5.4 Risk / return profile
The product sits far to the left of the underlying basket — much lower volatility for a higher expected return — while offering a large yield pick-up over the near-zero CHF risk-free rate.
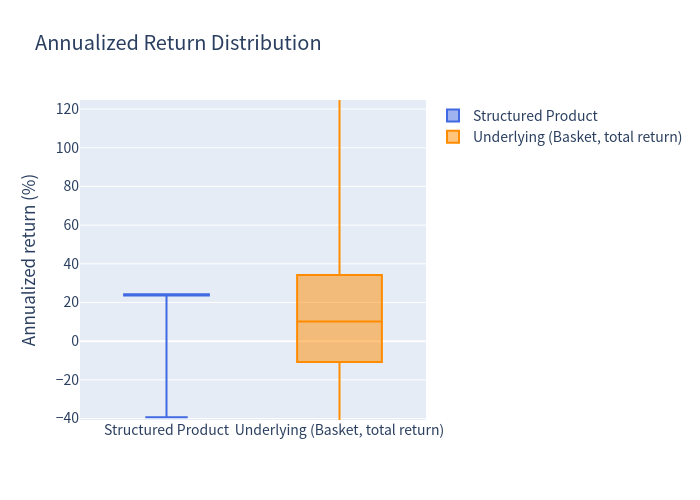
5.5 Annualized return distribution (box plot)
5.6 Scenario probabilities
5.7 Holding period & coupon distributions
6. Investment Commentary
Points in favour
- Market-leading income. A 24.20% p.a. headline coupon, paid regardless of market direction, is among the highest available in the current rate environment (CHF risk-free rate ≈ 0%).
- 51% downside cushion before losses begin. The barrier sits at 49% of each starting level — the worst-of must fall more than 51% before capital is at risk, and even then the loss is limited to the worst performer's performance (not leveraged).
- Favourable risk-adjusted profile in simulation. Because coupons dominate, the product shows higher expected return (20.69% vs 15.20%) at roughly one-third of the basket's volatility (11.16% vs 35.14%), with a much smaller probability of loss (7.49% vs 39.17%).
- Defined, capped exposure with a fixed maturity (Dec-2027). No leverage and no margin calls; principal is at risk of the worst performer's depreciation (up to 100% principal loss if it goes to zero), less the coupons already received.
- Tax efficiency (Switzerland). The bulk of the coupon is treated as an option-premium component (capital gain), generally tax-exempt for Swiss private investors.
Points to note
- "Worst-of" concentration. Exposure is to the single weakest of three highly correlated, high-beta technology names; the barrier is a union event — it only takes one name to break it.
- Continuous barrier, no recovery. Being observed continuously, an intra-day spike below 49% triggers the downside even if the stock recovers; a touched name does not un-trigger.
- Capped upside. Any rally is fully forgone above par + coupons.
- Issuer call limits income. Early redemption truncates the coupon stream — the ~31% of paths ending at 6 months receive only two coupons.
- Fat left tail. The 99% VaR of -24.87% (per annum) reflects that breach scenarios cluster losses.
- Issuer credit risk (Leonteq, Fitch BBB-) applies to all payments.