
EURO STOXX 50® Dual Directional Buffered PLUS — Investment Analysis
Headline Simulation Results
| Metric | Structured Product |
|---|---|
| Expected annualized return | 11.91% |
| Probability of a negative return | 8.18% |
| 99% confidence VaR (1-year) | −7.31% |
| Expected total return over the 5-year term | 88.21% |
| Expected annualized volatility | 9.41% |
| Probability of outperforming the risk-free rate (3.68%) | 76.78% |
| Probability of an annualized return above 10% | 56.43% |
The security is a zero-coupon, five-year note linked to the EURO STOXX 50® Index. Over the 10,000 simulated five-year paths it produced a positive total return in 91.82% of outcomes, with its worst 1%-tail annualized loss limited to about −7.31% — materially shallower than a direct holding of the index.
Product Basics — How It Works
The note makes a single payment at maturity (no coupons, no early redemption) determined by where the EURO STOXX 50® Index finishes versus its starting level:
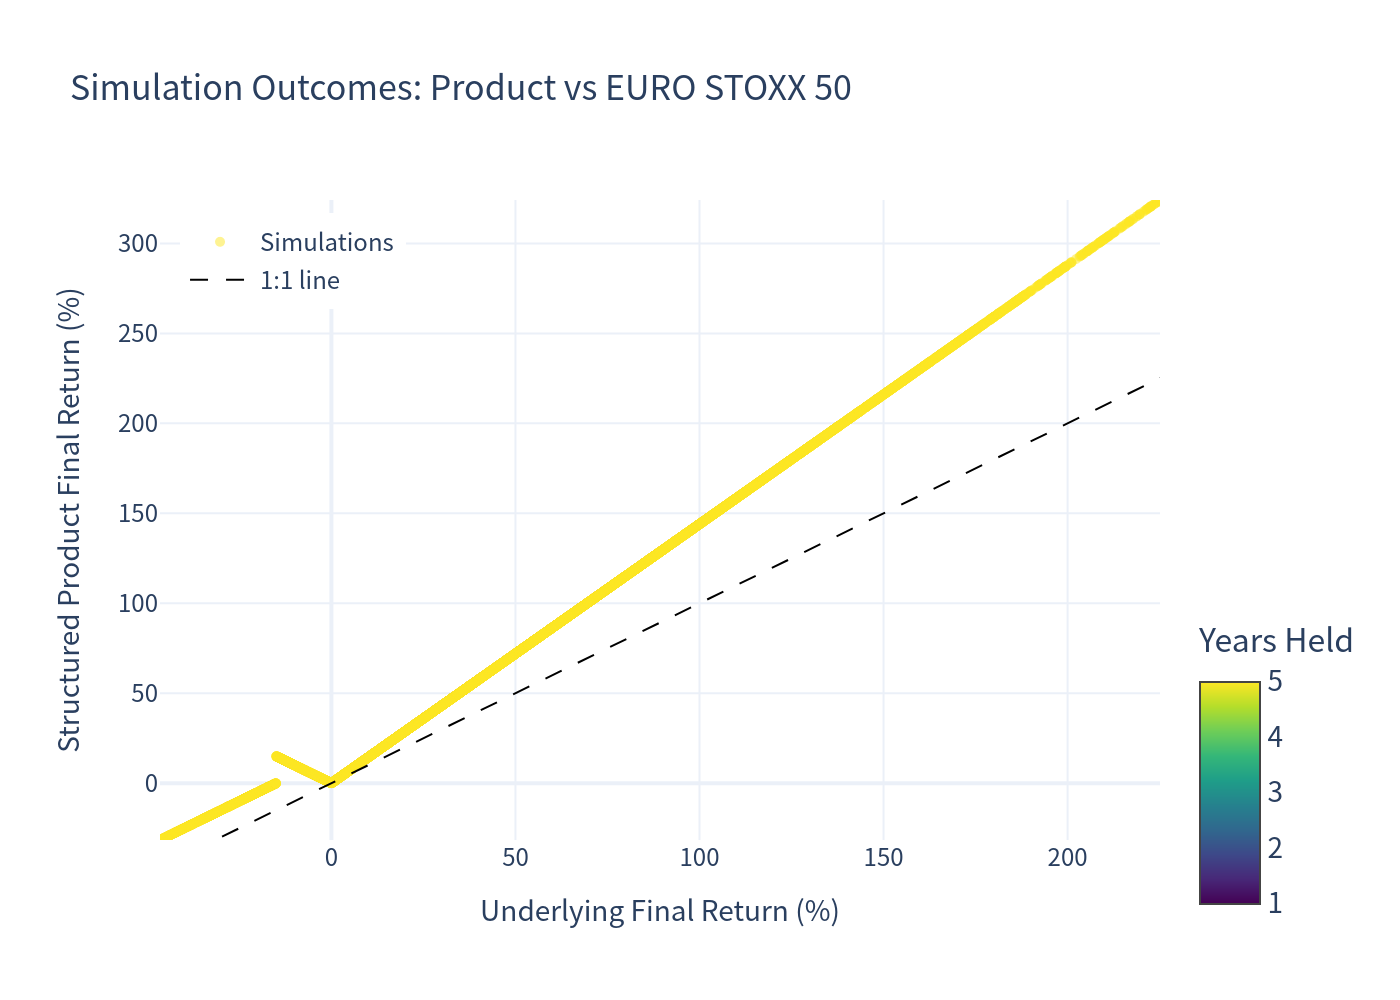
- Index up: you receive your principal plus 144% of the index gain (upside is not capped).
- Index flat to down by up to 15%: a "dual directional" feature pays you a positive return equal to the size of the decline (so a −5% index move pays +5%), up to a maximum of +15%.
- Index down more than 15%: the 15% buffer absorbs the first 15% of the decline, but you then lose 1% for every 1% the index falls beyond that, subject to a floor of 15% of principal.
Put simply, the note rewards both moderate up and moderate down moves in the index, cushions the first 15% of a sell-off, but leaves you exposed to — and capped only at — severe losses. Principal is at risk; losses can reach up to 85% of the amount invested.
Simulated Outcome Distribution
The scatter below shows every simulated outcome — structured-product return (vertical) against the index return (horizontal). Points above the dashed 1:1 line represent simulations where the note beat the raw index. The characteristic "dual directional" pattern (note positive while the index is modestly negative) and the buffered floor on the left are clearly visible.
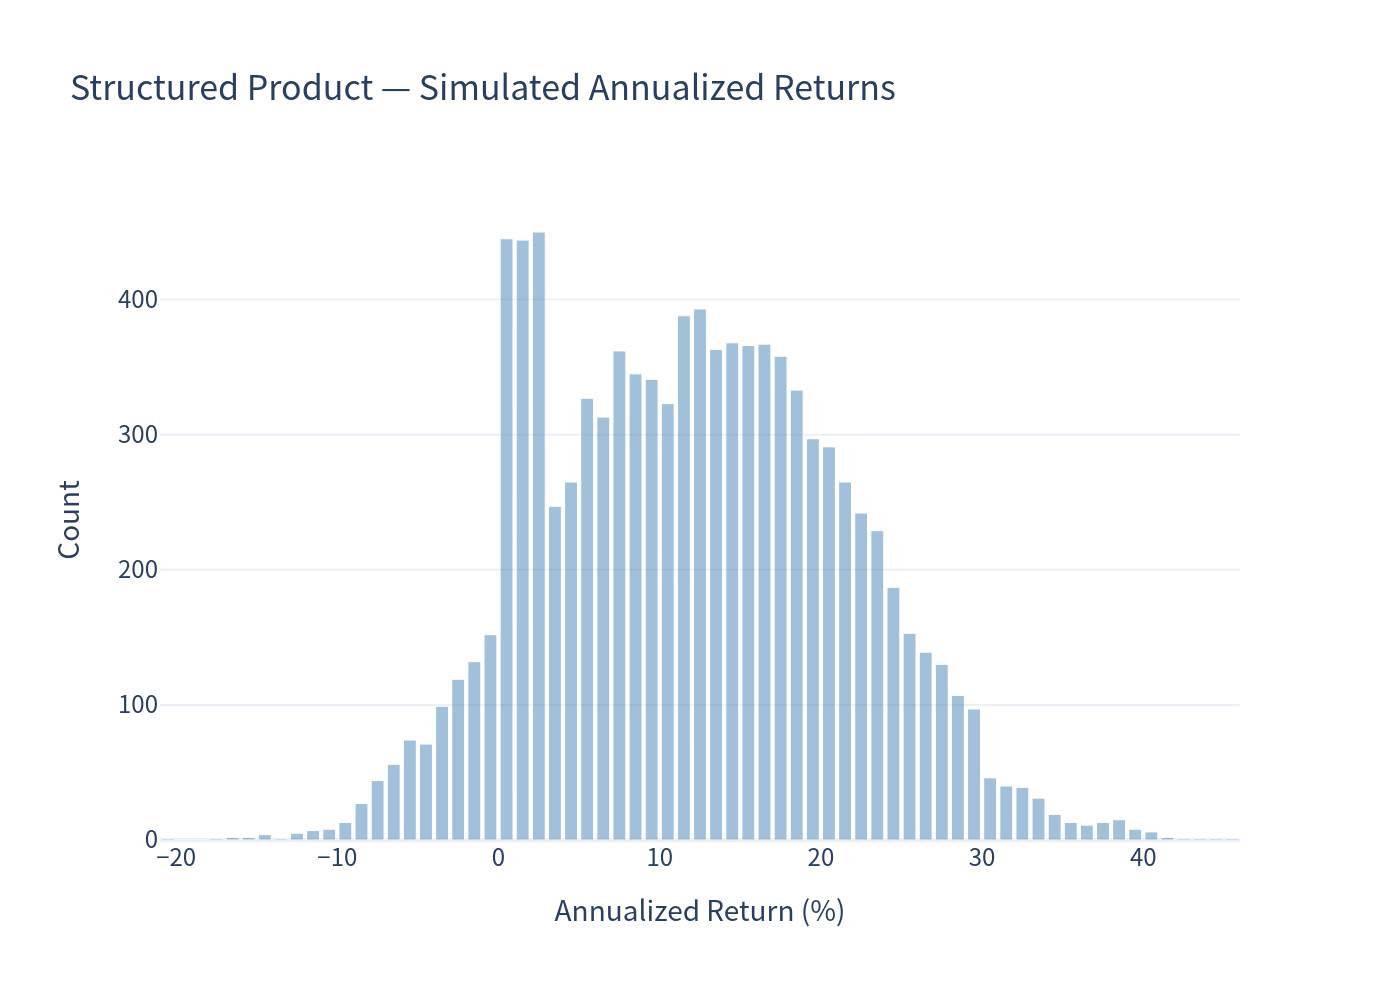
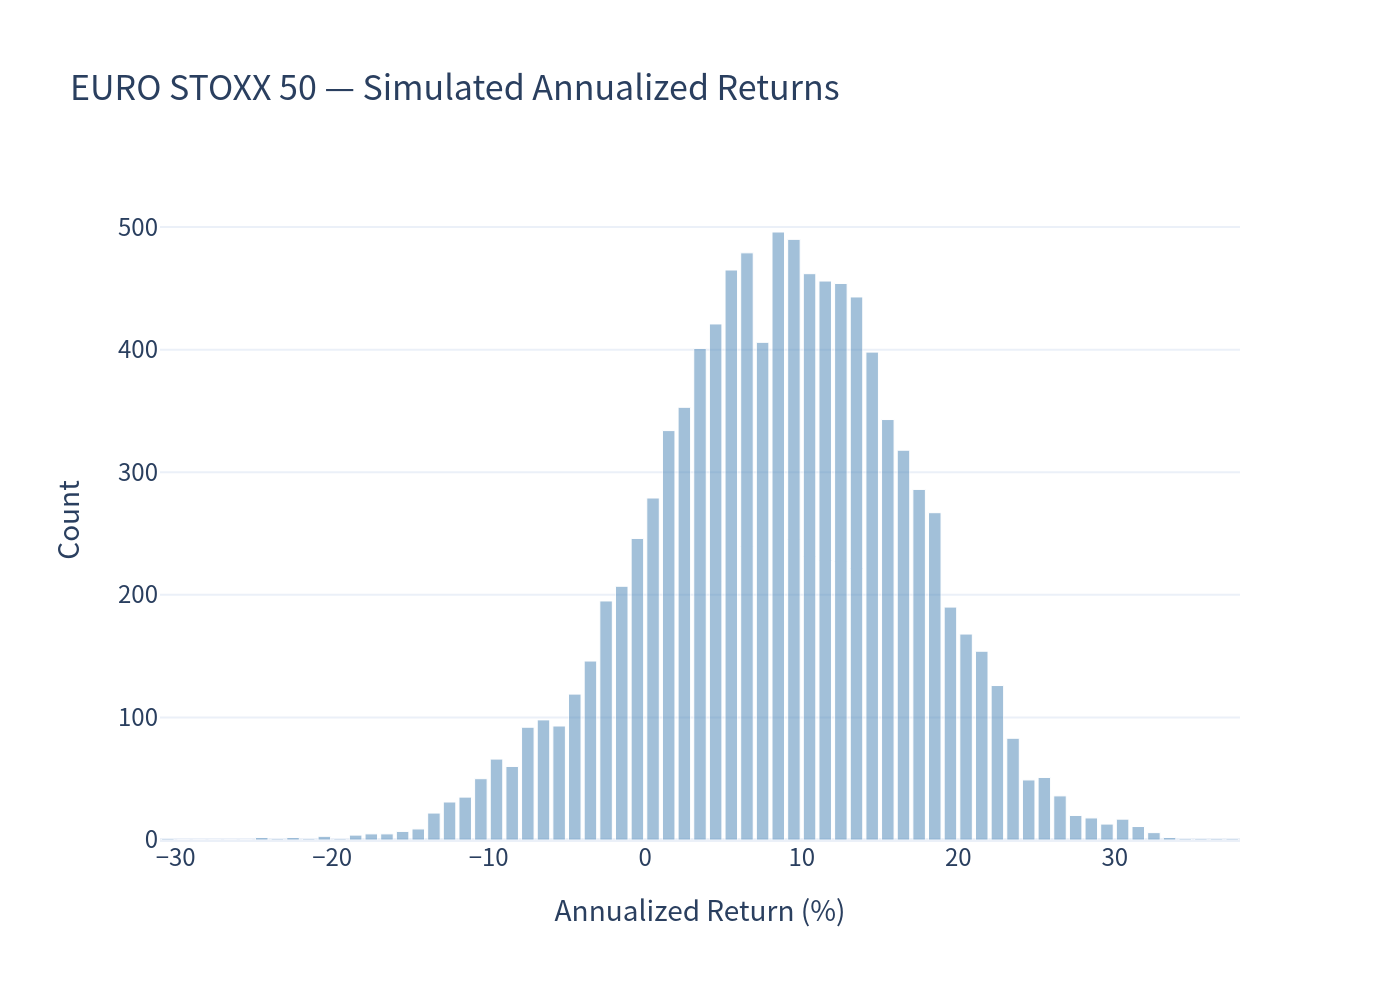
The annualized-return histograms confirm the shape of the two distributions: the note is right-shifted relative to the index (higher expected return) and its left tail is truncated by the buffer, while the 144% upside leverage keeps its overall dispersion (volatility) slightly higher than that of the index.
Structured Product Annualized Return Distribution
EURO STOXX 50 Annualized Return Distribution
Key Statistics — Product vs Underlying
| Metric (annualized) | Structured Product | EURO STOXX 50 (price) | EURO STOXX 50 (total return) |
|---|---|---|---|
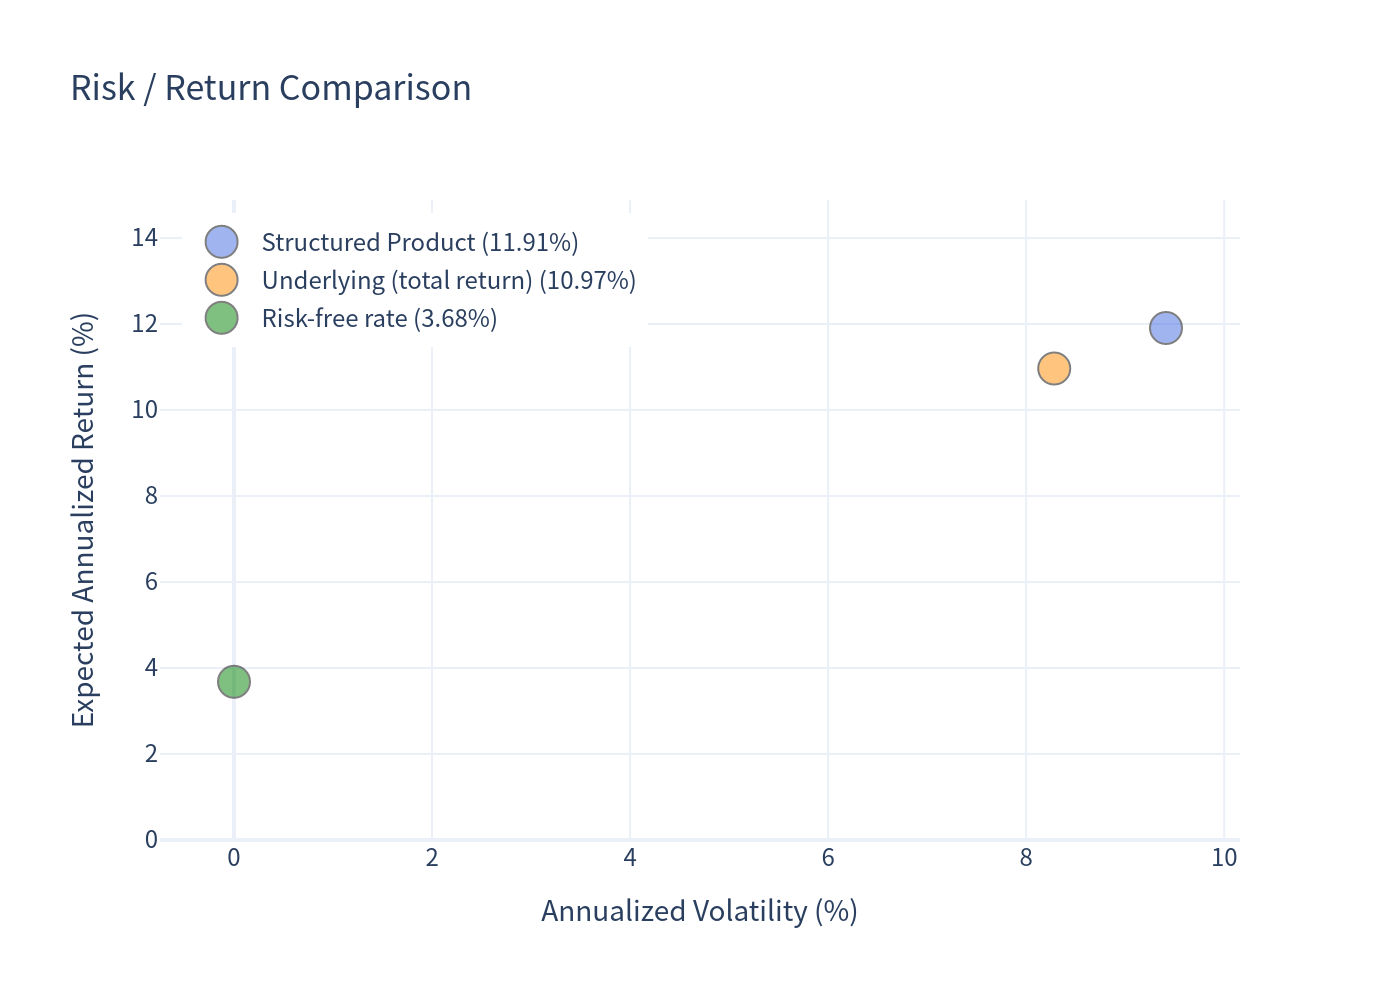
| Expected return | 11.91% | 8.46% | 10.97% |
| Expected volatility | 9.41% | 8.28% | 8.28% |
| Probability of loss | 8.18% | 15.01% | 9.49% |
| 99% confidence VaR (1-year) | −7.31% | −11.78% | −9.27% |
Index total return adds the current index dividend yield (≈2.51%). The risk-free rate is the 1-year average US T-bill rate, 3.68%.
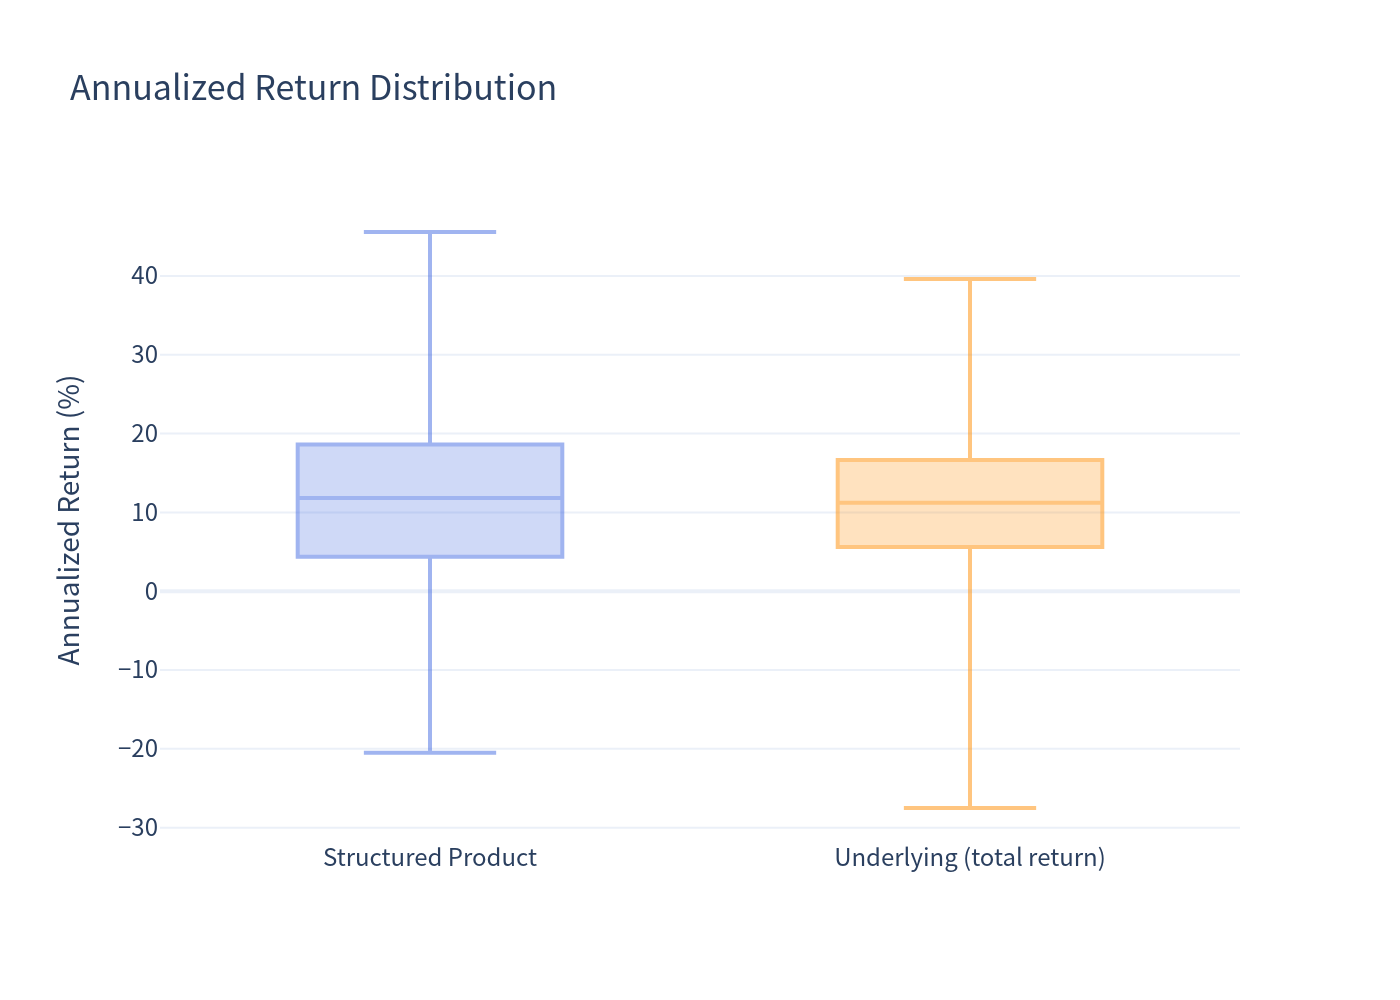
The note delivered a higher expected return than both the price and total-return index, while cutting the probability of a loss roughly in half and improving the 1-year 99% VaR by about 4.5 percentage points versus the price index.
Risk / Return Comparison
Annualized Return Box Plot
Scenario Probabilities
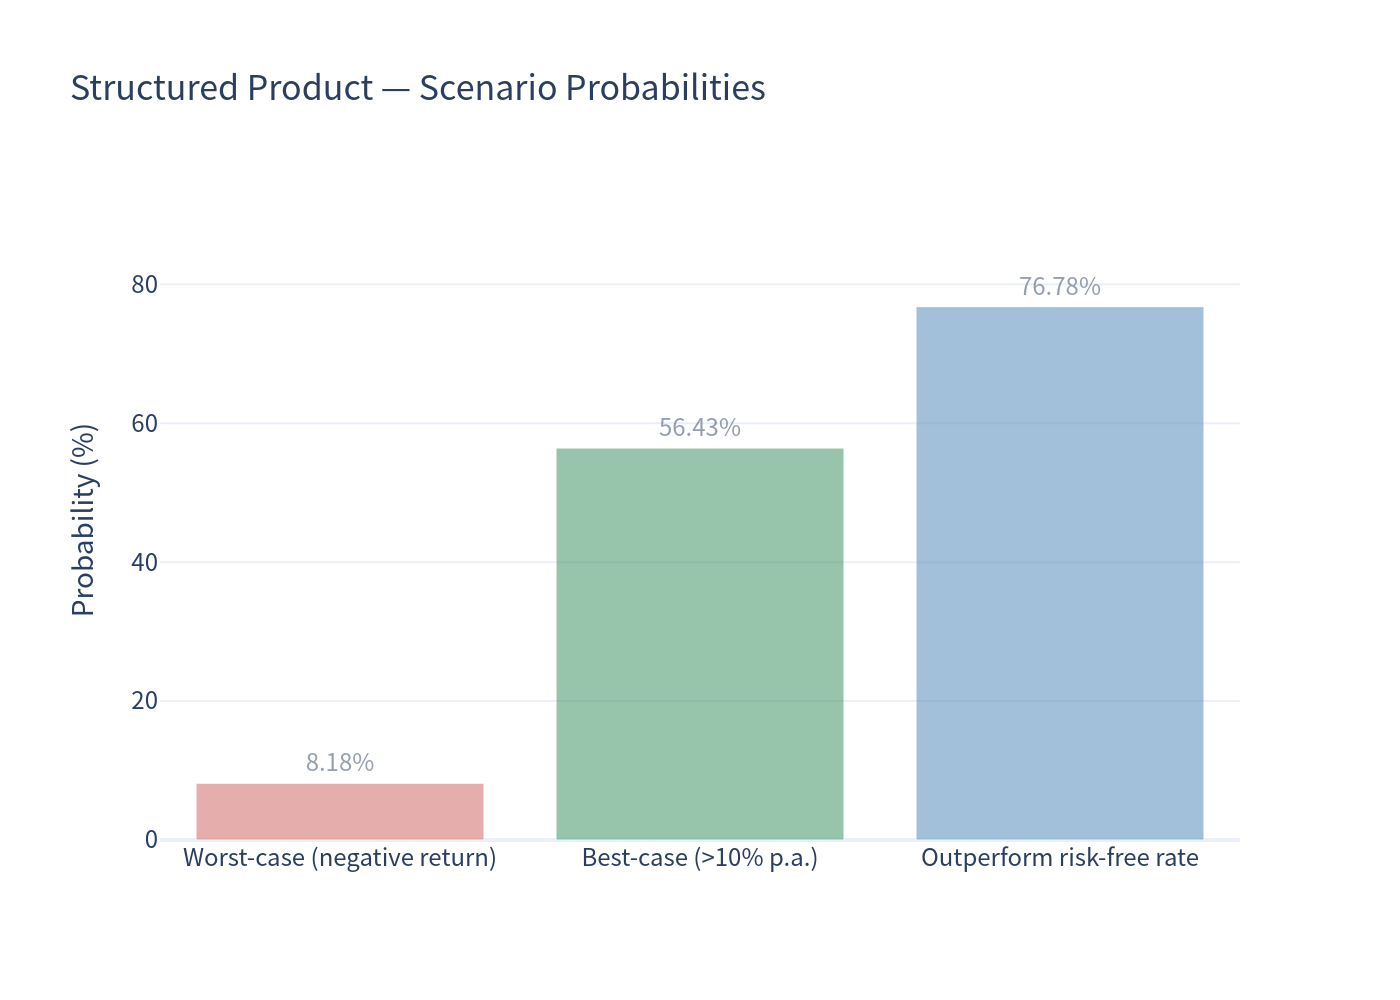
- Worst case (negative return): 8.18%
- Best case (annualized return above 10%): 56.43%
- Outperforms the risk-free rate: 76.78%
Investment Commentary
Favourable characteristics
- Built-in cushion: the 15% buffer means the note still returns principal or better for index declines of up to 15%, and the dual-directional feature actually profits from modest declines.
- Leveraged upside: 144% participation in index gains, with no cap on the upside.
- Favourable risk profile in simulation: higher expected return with a lower probability of loss than the underlying index, and a much shallower left tail.
- Defined floor: losses are capped at 85% of principal (a 15% floor), so the worst case is bounded.
Risks and drawbacks worth noting
- No income: the note pays no coupon; all return is back-loaded to maturity.
- Principal at risk: in severe market declines the investor can lose up to 85% of the amount invested.
- Issuer credit risk: payments depend on Morgan Stanley Finance LLC / Morgan Stanley; the securities are not principal-protected against issuer default.
- Unhedged currency exposure: the underlying is a EUR-denominated equity index while the payout is in USD, adding an FX component.
- Payoff "cliff" at the buffer: the dual-directional bonus peaks (+15%) exactly at the 15% decline level and drops immediately below it, so outcomes just past the buffer are notably worse than outcomes just inside it.
- Liquidity: the securities will not be listed on any exchange; there is no assurance of a secondary market.
Important Notes
This analysis is a quantitative simulation based on the terms of the preliminary pricing supplement and assumed market dynamics. It is provided for informational purposes only and does not constitute investment advice or a recommendation. Simulated results do not represent actual future outcomes, and past performance is not indicative of future results.