
7.20% p.a. Multi Barrier Reverse Convertible on AXA, Swiss Life & Swiss Re — Simulation Report
Headline Results
The product is a 27-month (≈2.25-year), CHF-denominated yield-enhancement note on a basket of three European insurers (AXA, Swiss Life, Swiss Re). It pays a fixed 7.20% p.a. coupon (CHF 90 per CHF 5,000 par, paid quarterly) regardless of how the underlyings perform, combined with conditional downside protection.
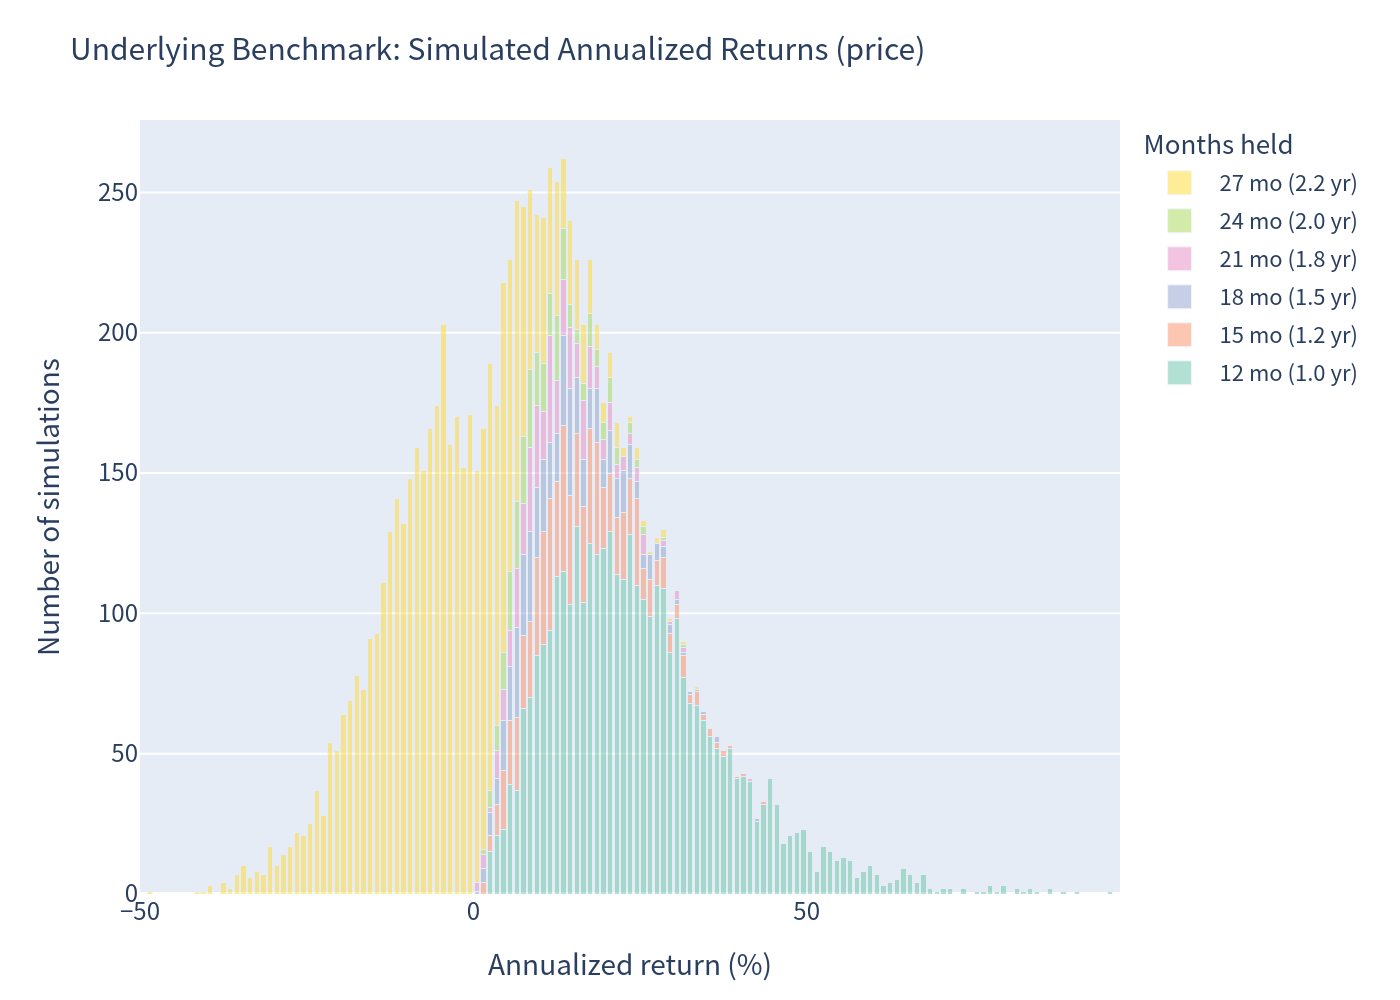
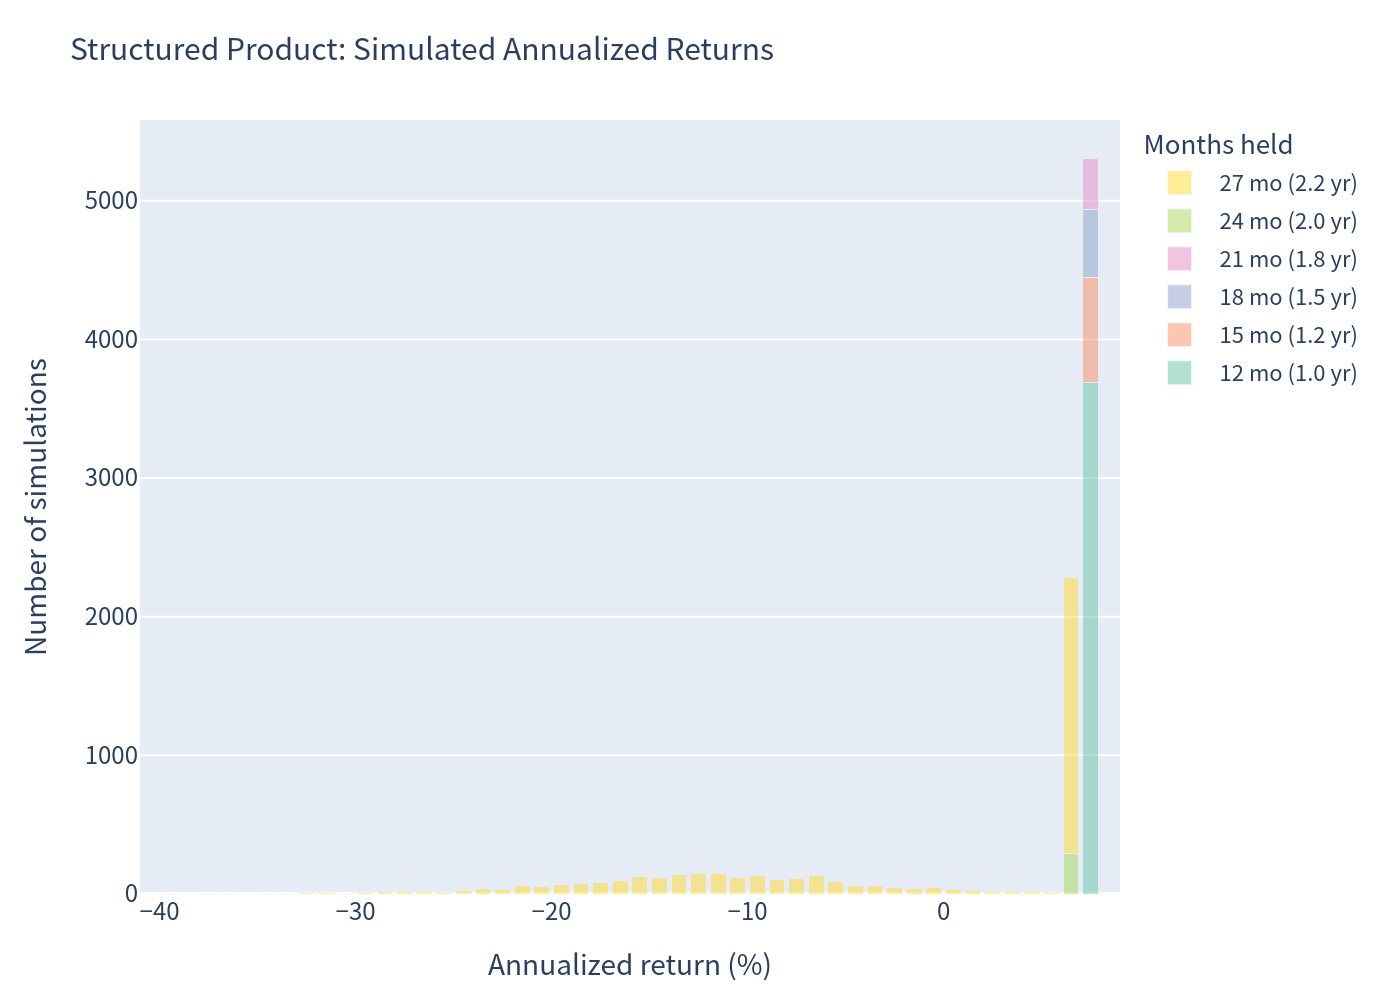
In the base-case simulation the product is held, on average, 19.81 months (≈1.65 years) before being either called by the issuer or reaching maturity. Over that realized horizon the expected total return is 2.07% (median 7.20%). The average of the per-simulation annualized (CAGR) returns is 2.45% — note this is a mean of pathwise annualized returns and is not the same as annualizing the 2.07% average total return (~1.25%), because holding periods vary and the distribution is skewed. The annualized figure is therefore best read together with the expected holding period and total return.
Basic Product Information
How it works (in plain terms)
You invest CHF 5,000 per note. Every quarter you receive a fixed CHF 90 coupon (1.8% of par, i.e. 7.20% per year) — these coupons are paid in any case, even if the shares fall. The issuer (Leonteq) has the right to redeem the note early on five dates from month 12 onward; if it does, you get your CHF 5,000 back plus that quarter's coupon. If the note runs to maturity (month 27):
- If no underlying ever traded at or below 59% of its starting level during the life of the product (a continuous barrier), you receive 100% of your capital back.
- If the barrier was breached and the worst-performing underlying ends below its starting level, you receive the worst-performing shares instead of cash — this is where principal is lost. The loss equals how far below par the worst share has fallen.
- If the barrier was breached but the worst-performing underlying still ends at or above its starting level, you again receive 100% of capital back.
Payoff dependency: worst-of — redemption depends on the lowest-performing of the three underlyings. Upside is capped: the note never pays more than par plus coupons, and an early call also caps total return at the coupon stream.
Key modelling note: early redemption is an issuer right (no market-condition trigger is specified in the term sheet). This analysis assumes the issuer calls at the first observation date at which the worst-of underlying stands at or above its initial level (100%), consistent with the issuer's incentive to redeem at par once the embedded put is worthless.
Key Statistics (Simulated, 10,000 paths)
| Metric | Structured Product | Underlying Equal-Weight Basket* |
|---|---|---|
| Expected annualized return | 2.45% | 14.35% |
| Expected annualized volatility | 9.00% | 17.67% |
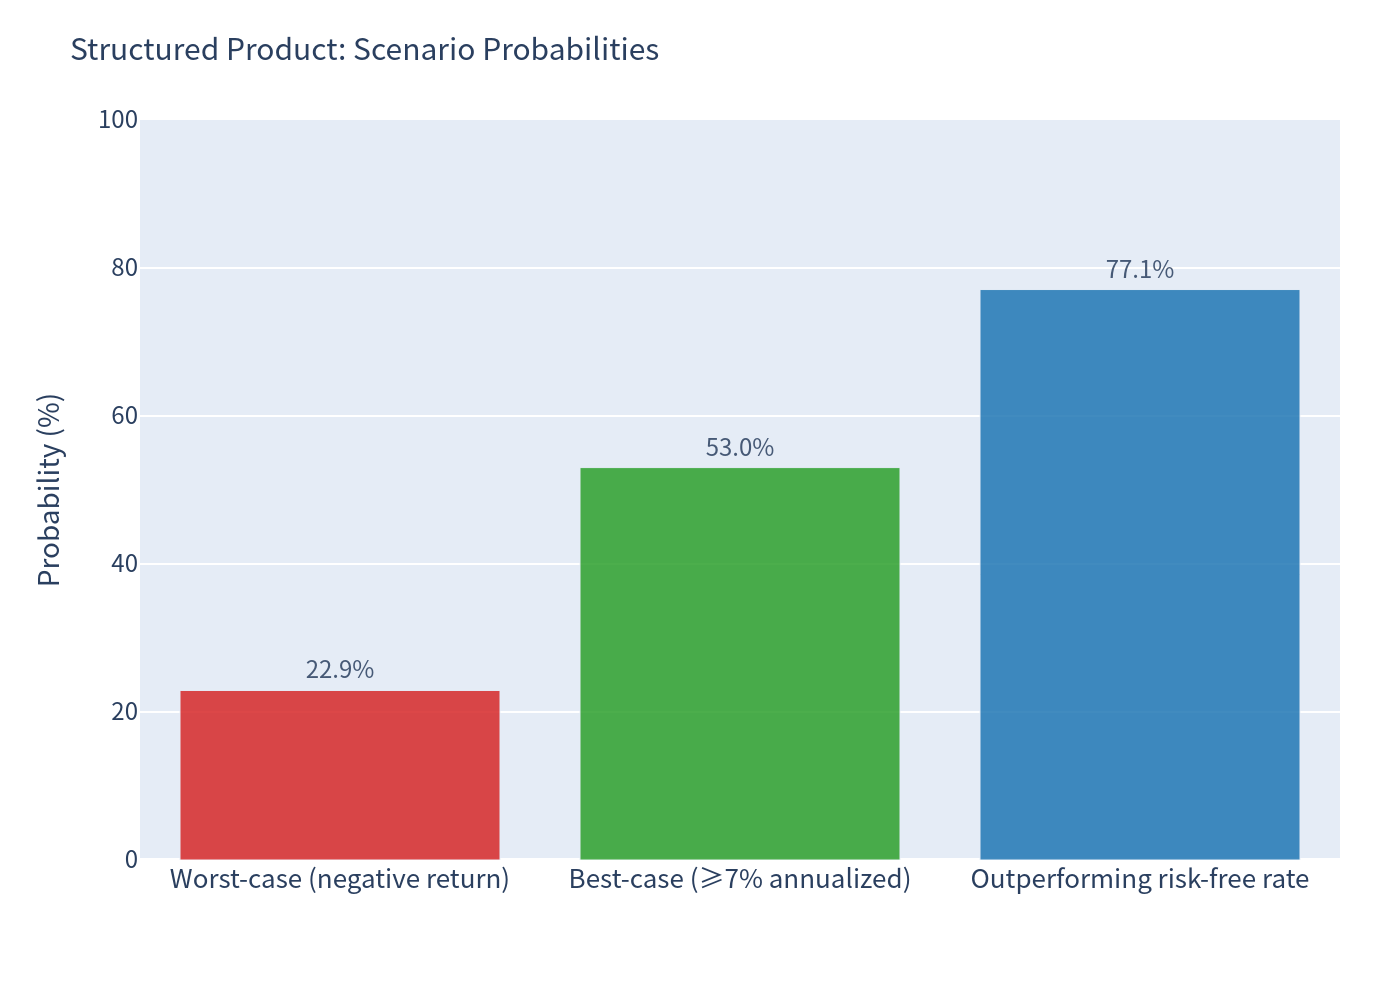
| Probability of loss | 22.91% | 29.81% |
| 99% confidence VaR (1 year) | -26.24% | -22.95% |
| Expected total return (realized horizon) | 2.07% | 9.37% |
| Expected holding period | 19.81 months (1.65 yrs) | — |
*Equal-weight basket of AXA, Swiss Life and Swiss Re, total return (price appreciation + average dividend yield of 4.57%). Product and underlying returns are computed over the same holding period per simulation (the product's termination month).
Outcome profile
- Called early by the issuer: 55.92% of paths — in these cases total coupon income is 7.2–14.4 index points.
- Held to full maturity: 44.08% of paths — full coupon income of 16.2 index points.
- Barrier event (some underlying ≤ 59% of initial at any point): 27.45% of paths.
- Share delivery at maturity (barrier breached and worst-of below par): 24.16% of all paths; among notes held to maturity, 54.81%. In delivery cases the average redemption value is 59.35 index points (≈ 40.65 points below par).
- Average coupon income: 11.89 index points on a 100 notional.
- Worst simulated total return: -67.62%; best simulated total return: +16.20%.
- 5th–95th percentile of total return: -35.72% to 16.20%.
Charts
Simulated Outcomes — Product vs Underlying
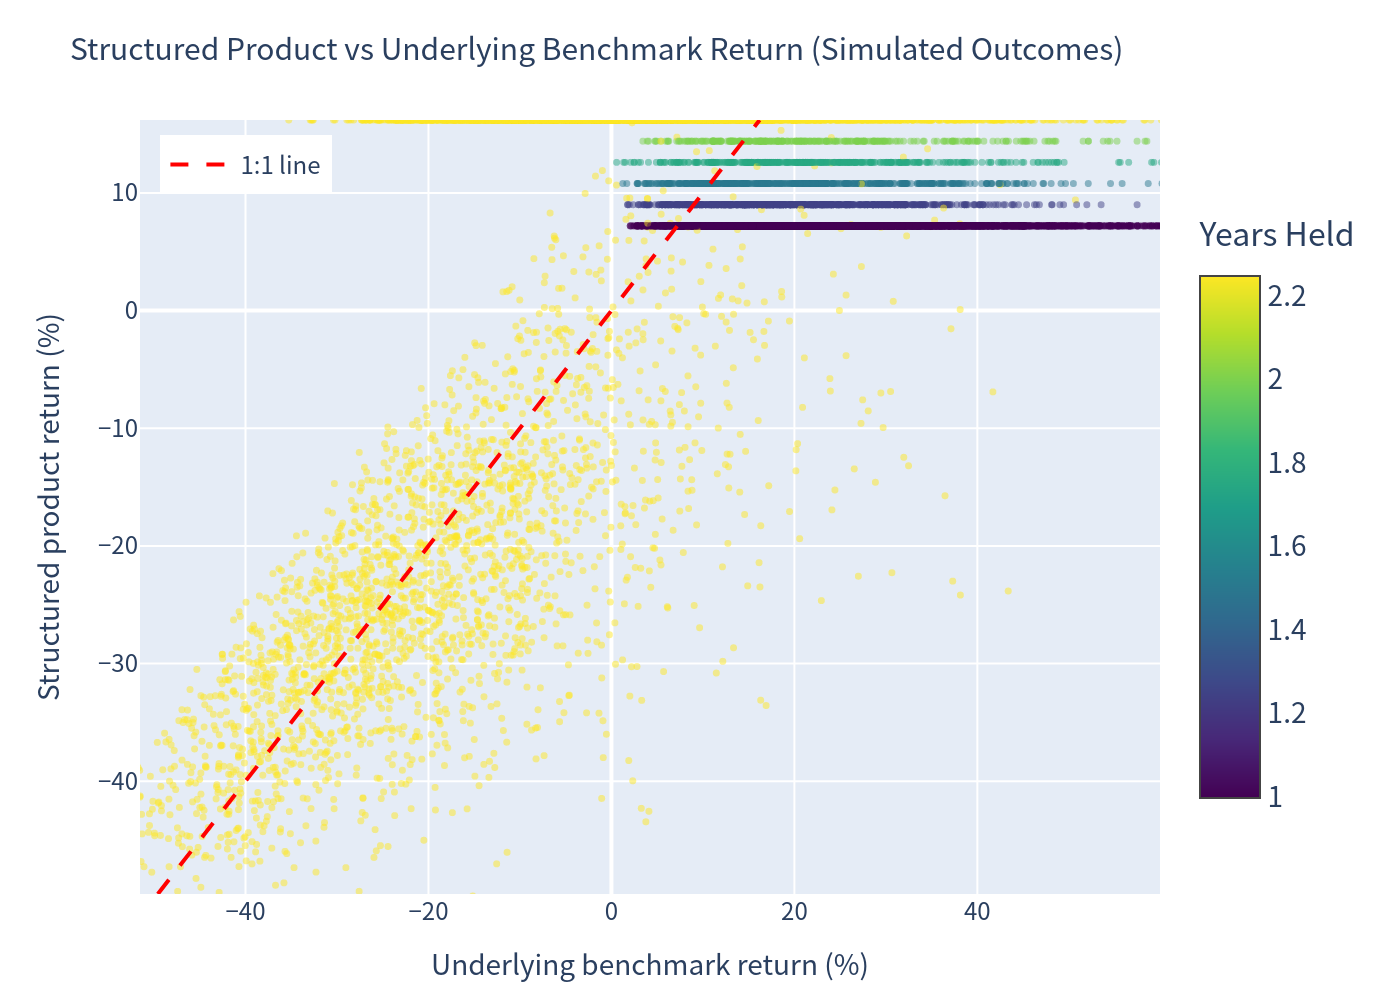
Scatter of simulated total returns: structured product against the equal-weight underlying basket.
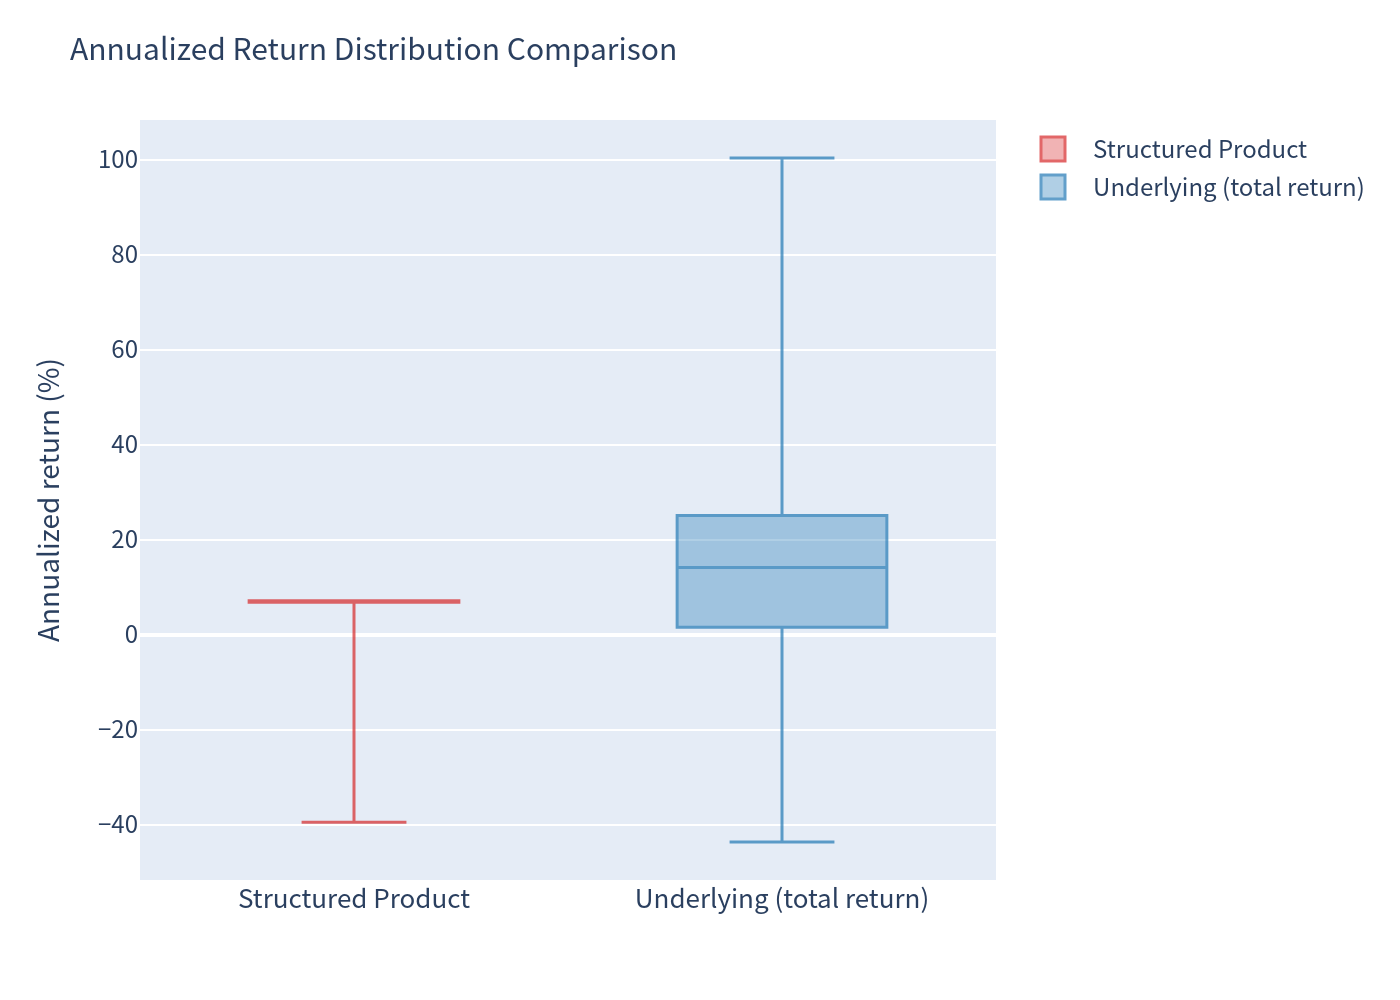
Annualized Return Distributions
Distribution of pathwise annualized (CAGR) returns for the underlying equal-weight basket and for the structured product.
Scenario Probabilities
Share of simulated paths by scenario: called early, held to maturity, barrier breach and share delivery.
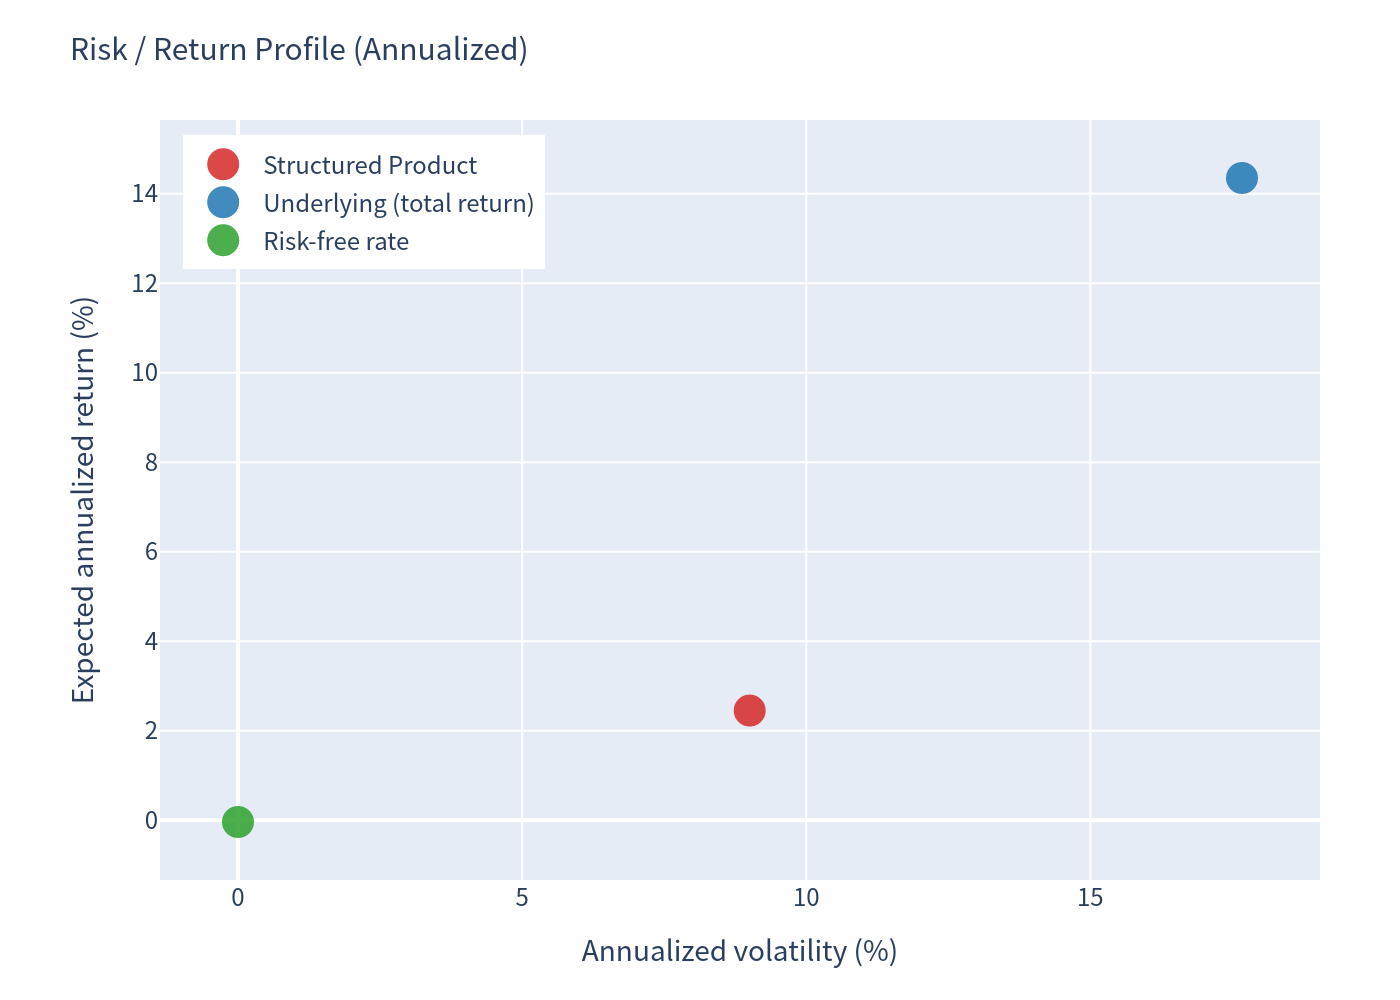
Risk / Return Profile
Positioning of the structured product versus the underlying basket on the risk (volatility) / return plane.
Distribution Comparison (Box Plot)
Box-plot comparison of total-return distributions for the product and the underlying basket.
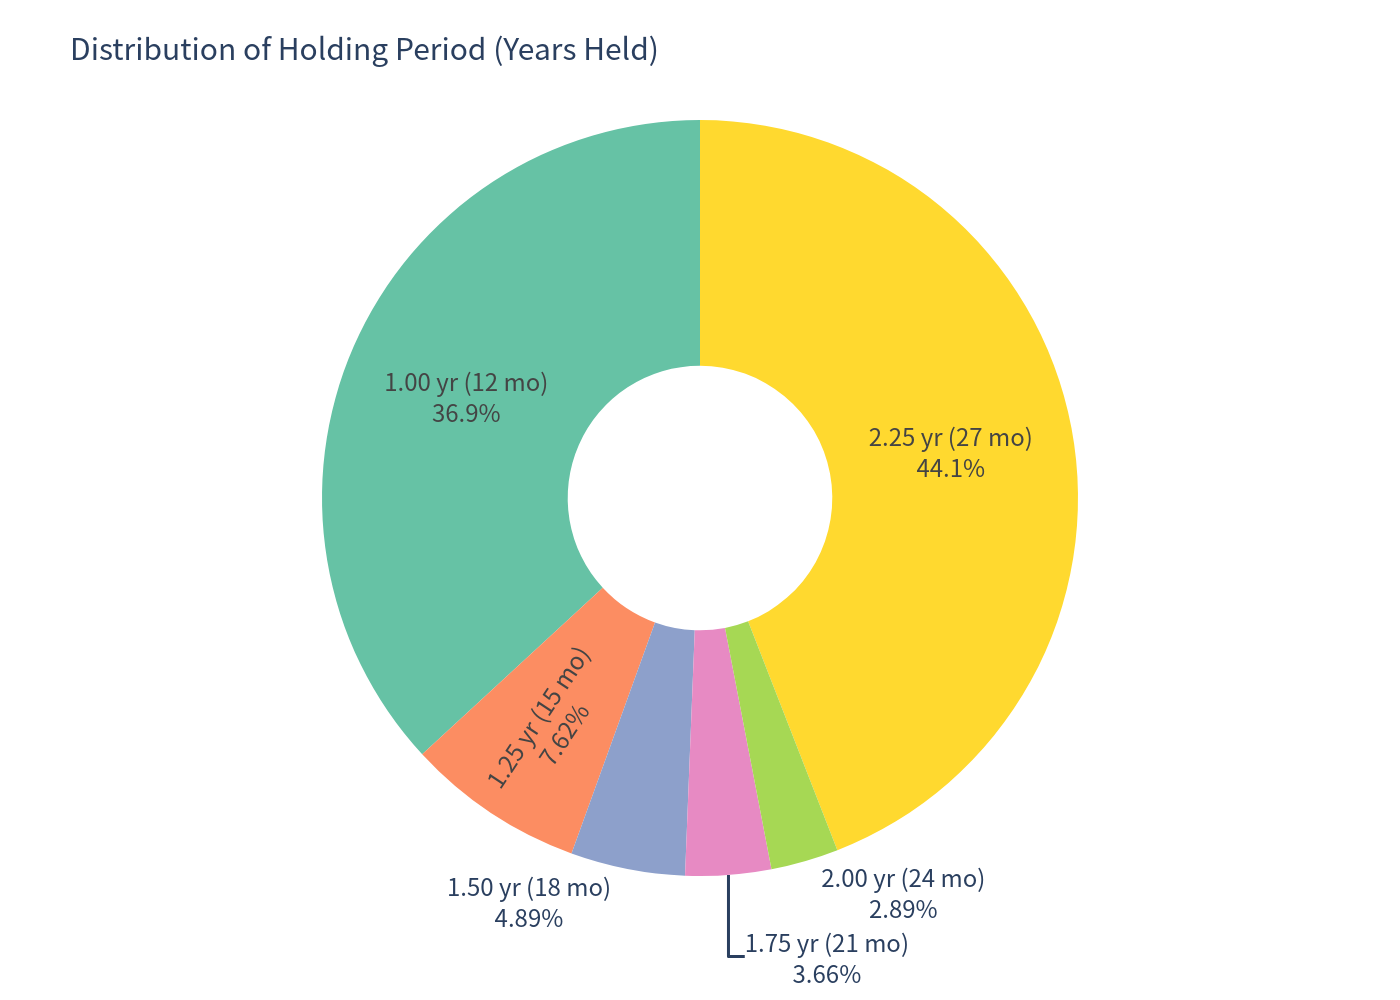
Holding Period & Coupon Count
Distribution of the product's holding period across simulated paths.
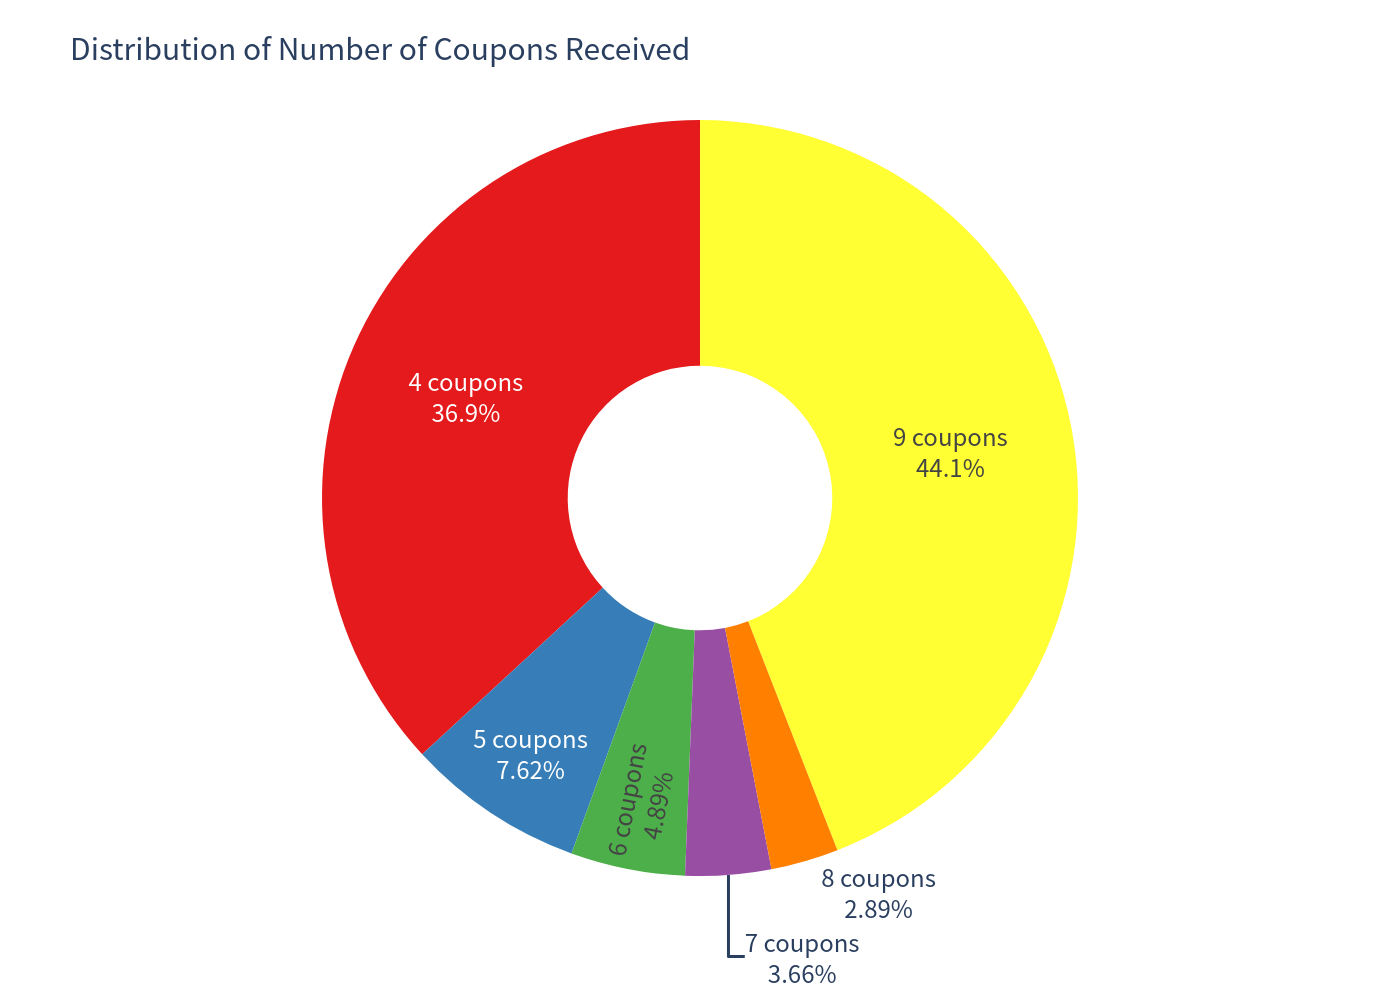
Distribution of the number of coupons received across simulated paths.
Investment Commentary
Good points worth mentioning
- A 7.20% p.a. coupon is paid in cash each quarter regardless of underlying performance — income arrives as scheduled even in falling markets.
- The downside cushion is deep: capital is only at risk if at least one of the three insurers falls more than 41% from its starting level at any point during the product's life.
- Lower risk profile than direct equity exposure: simulated annualized volatility of the product (9.00%) is roughly half that of the share basket (17.67%), with a lower probability of loss (22.91% vs 29.81%).
- Quanto CHF structure removes EUR/CHF currency risk on the AXA leg.
- The median outcome is a 7.20% total return over the ~1.65-year average holding, and the product outperformed the (near-zero) CHF risk-free rate in 77.10% of simulated paths.
Trade-offs to be aware of
- Upside is capped: in strongly rising markets the issuer is expected to call early and the note returns only the coupon stream. The simulated expected annualized return of the product (2.45%) is well below the expected annualized return of holding the shares directly (14.35%), which is the price paid for the income and protection.
- Tail risk remains: in the worst simulated cases total return reached -67.62% (a deep barrier breach combined with a large drop in the worst share). The -26.24% 99% VaR and the 24.16% share-delivery probability illustrate the loss potential.
- Early call shortens the yield: 55.92% of paths are called before maturity, limiting total coupon income to at most 14.4 index points rather than the full 16.2 points.