
10.70% p.a. Multi Barrier Reverse Convertible on Mastercard, Pfizer & Verizon
Headline Simulation Results
Based on 10,000 Monte-Carlo simulations over the product's life (max 21 months):
| Expected annualized return | 6.92% |
| Probability of negative return | 15.63% |
| 99% confidence VaR (1 year) | −22.15% |
| Expected annualized volatility | 8.55% |
| Expected holding period | 15.1 months |
| Expected total return over realized holding period | 7.32% |
The 10.70% headline coupon is paid in full in the large majority of outcomes, but it is not the return you should expect: about one-third of the 10.70% headline coupon is given back to the risk of being left holding a depreciated worst-of underlying when the 65% barrier is breached — the expected return of ~6.9% is therefore roughly two-thirds of the headline coupon. Because ~25% of paths end after only 6 months, annualized figures can look amplified — read them together with the total-return and holding-period figures.
What This Product Is
A worst-of barrier reverse convertible: an income note that pays a fixed 10.70% p.a. coupon (CHF 26.75 per CHF 1,000 per quarter) regardless of how the three shares perform, in exchange for taking the downside of the worst-performing of Mastercard, Pfizer and Verizon if a protective 65% barrier is broken. The note is quantoed into CHF (so no FX risk to a Swiss investor) and is callable by the issuer on five quarterly dates.
How It Works (in plain terms)
- You receive coupons in any case — every quarter, as long as the note is alive, you collect 2.675% (CHF 26.75 per CHF 1,000). This is paid even if the shares fall and even on an early-redemption date.
- At maturity you normally get your money back (100%) — provided no barrier event has occurred. A barrier event happens if any one of the three shares trades at or below 65% of its starting level at any time during the ~21-month life.
- If the 65% barrier is breached, your capital protection disappears: at maturity you receive the worst share's downside. If the worst share finishes below its starting level, you take that loss (e.g. worst share down 30% ⇒ you lose ~30%, less the coupons received). If it finishes at or above its starting level, you still get 100%.
- You can be redeemed early: on each quarterly observation date the issuer may call the note, paying you 100% plus that quarter's coupon. This caps how long you can earn the coupon and removes the chance to recover from a later downturn.
- Your upside is capped at par plus coupons — you never participate in gains of the shares.
Key Statistics
| Structured Product | Underlying Basket (price) | Underlying Basket (total, + dividends) | |
|---|---|---|---|
| Expected annualized return | 6.92% | 10.88% | 15.36% |
| Annualized volatility | 8.55% | 16.82% | 16.82% |
| Probability of loss | 15.63% | 27.46% | 18.10% |
| 99% VaR (1 year) | −22.15% | −20.21% | −15.72% |
Underlying basket = equally-weighted Mastercard / Pfizer / Verizon (the product's underlying trio), with a blended dividend yield of ~4.49%. Risk-free rate ≈ 0% (CHF).
The structured product halves the volatility and meaningfully reduces the probability of a loss relative to a direct holding, thanks to the 65% barrier. However, it converts the upside into a fixed coupon: in strong rallies the basket's total return (including its high ~4.5% dividend stream) far exceeds the product's ~6.9% expected return.
Charts
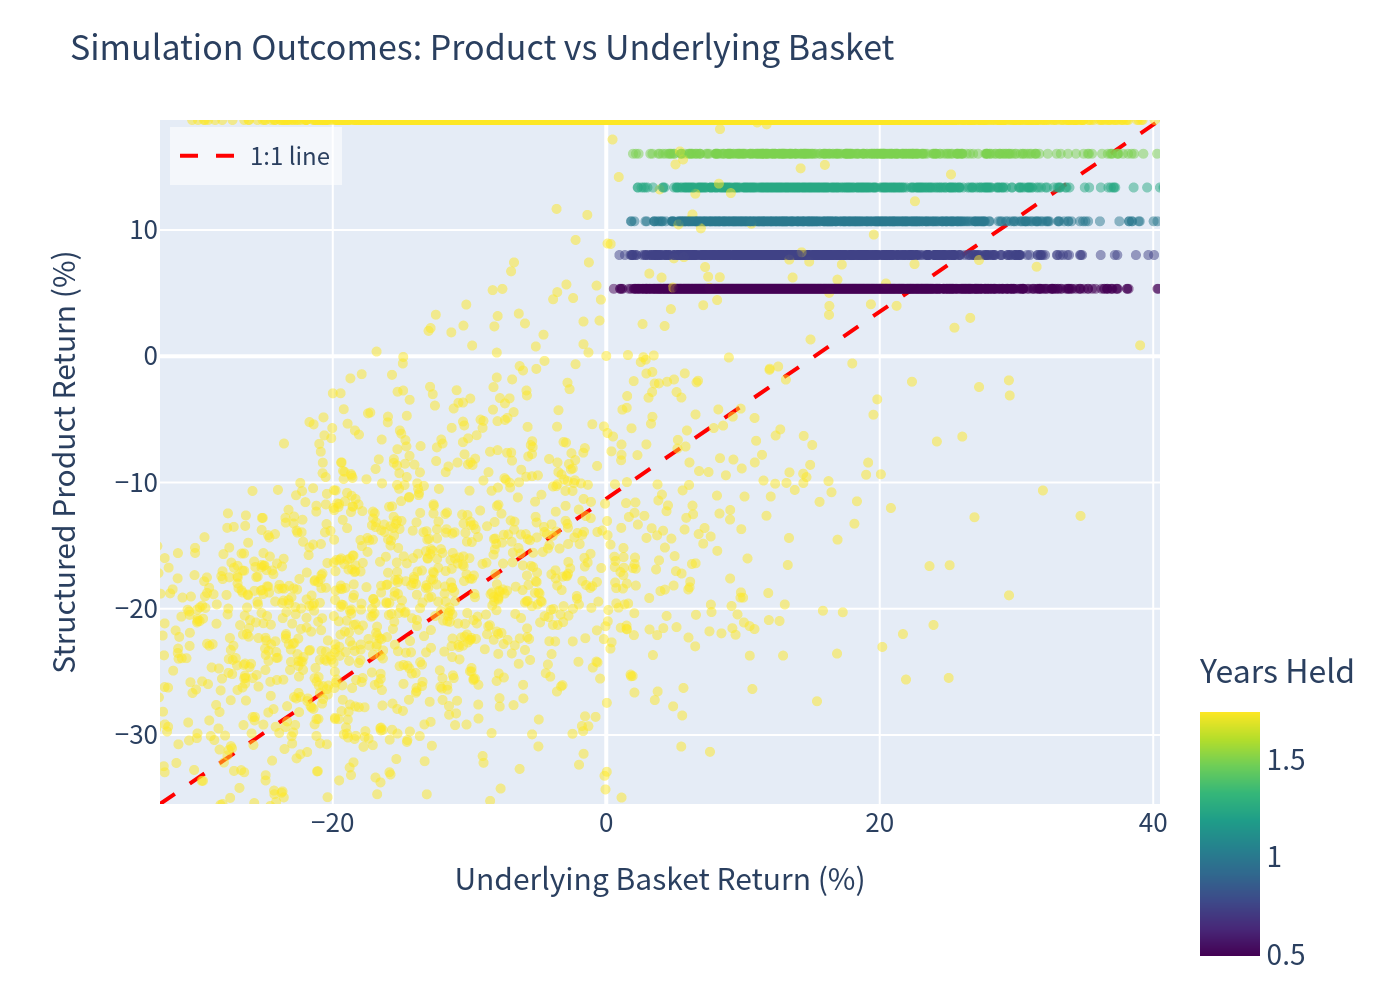
Simulation outcomes vs the underlying
Each point is one simulation; the x-axis is the underlying basket's return and the y-axis the product's return. The product only reaches its capped maximum (+18.7%) in the subset of paths that run to maturity; when the shares rise the issuer is assumed to call the note early, returning par plus only the coupons accrued to that date, and drops with the worst-performing underlying (not the basket) on the downside once the barrier is breached.
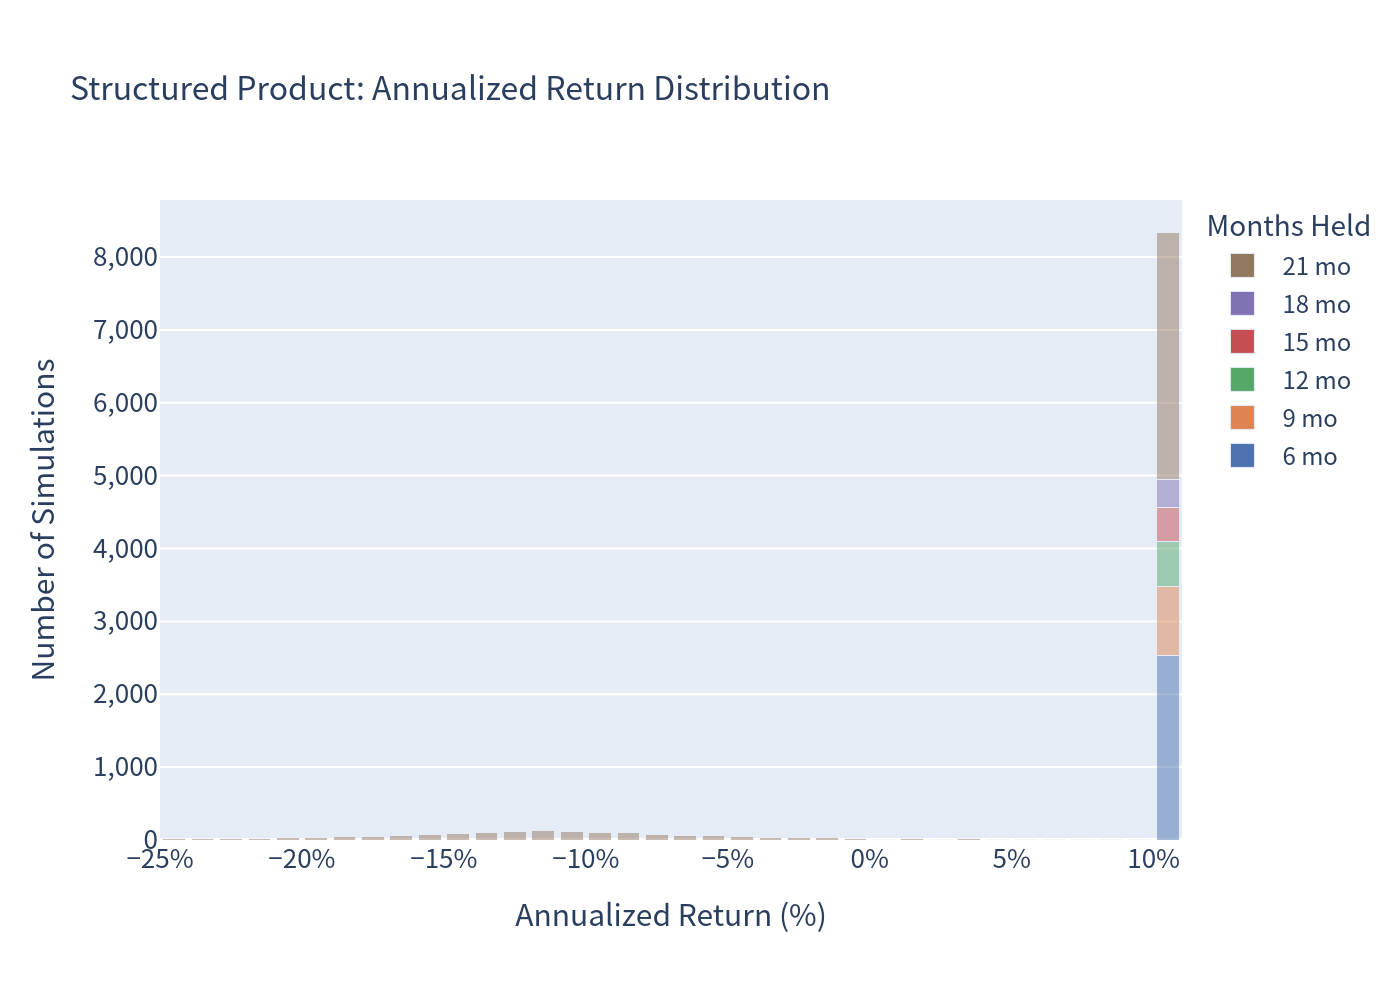
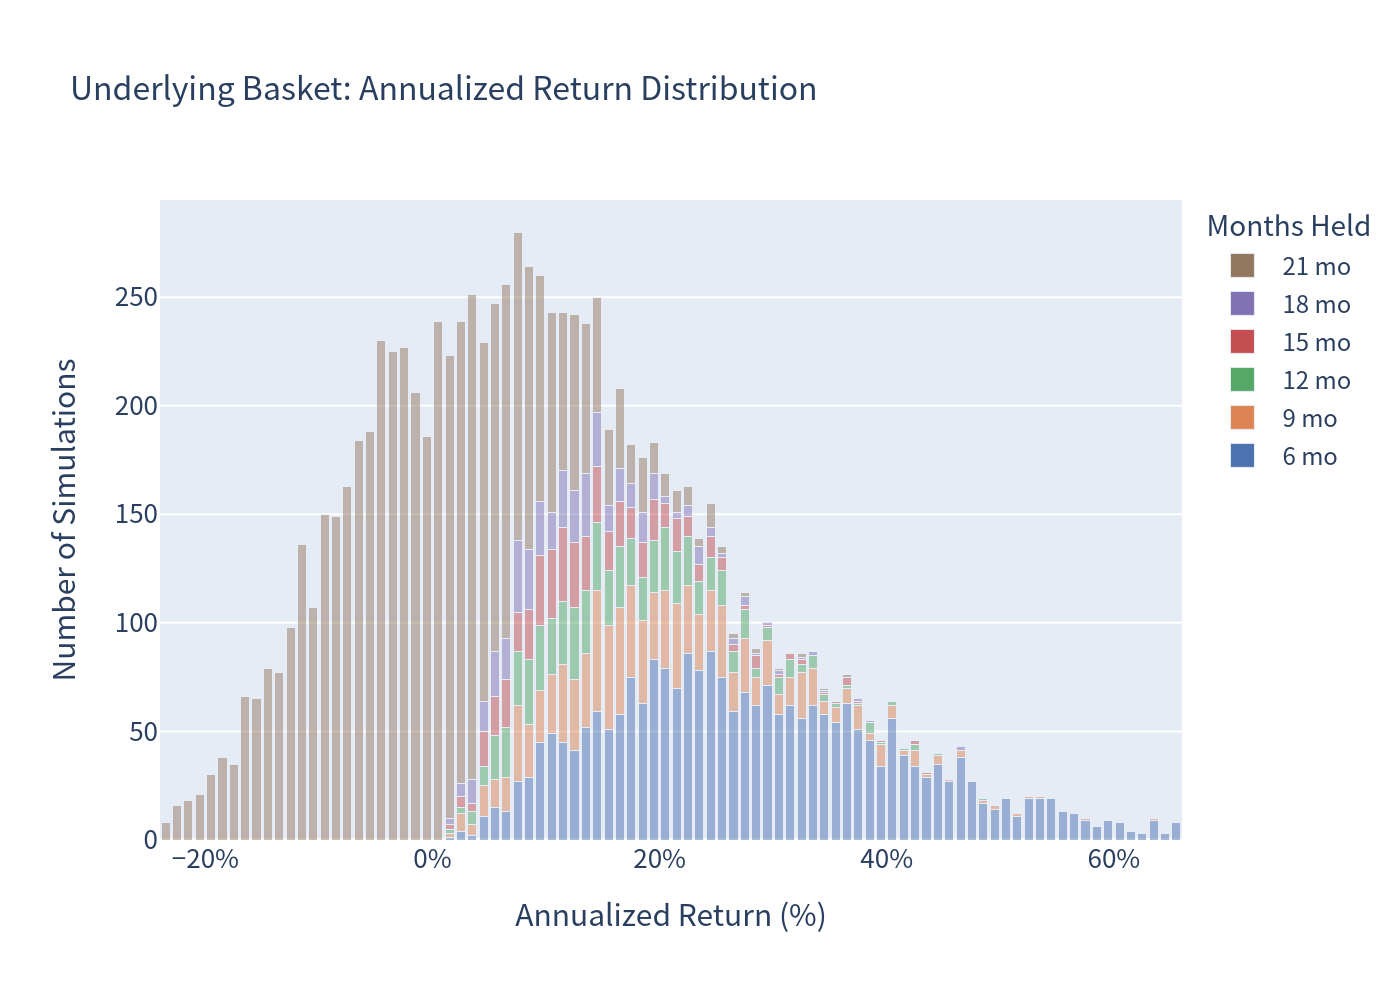
Annualized return distributions
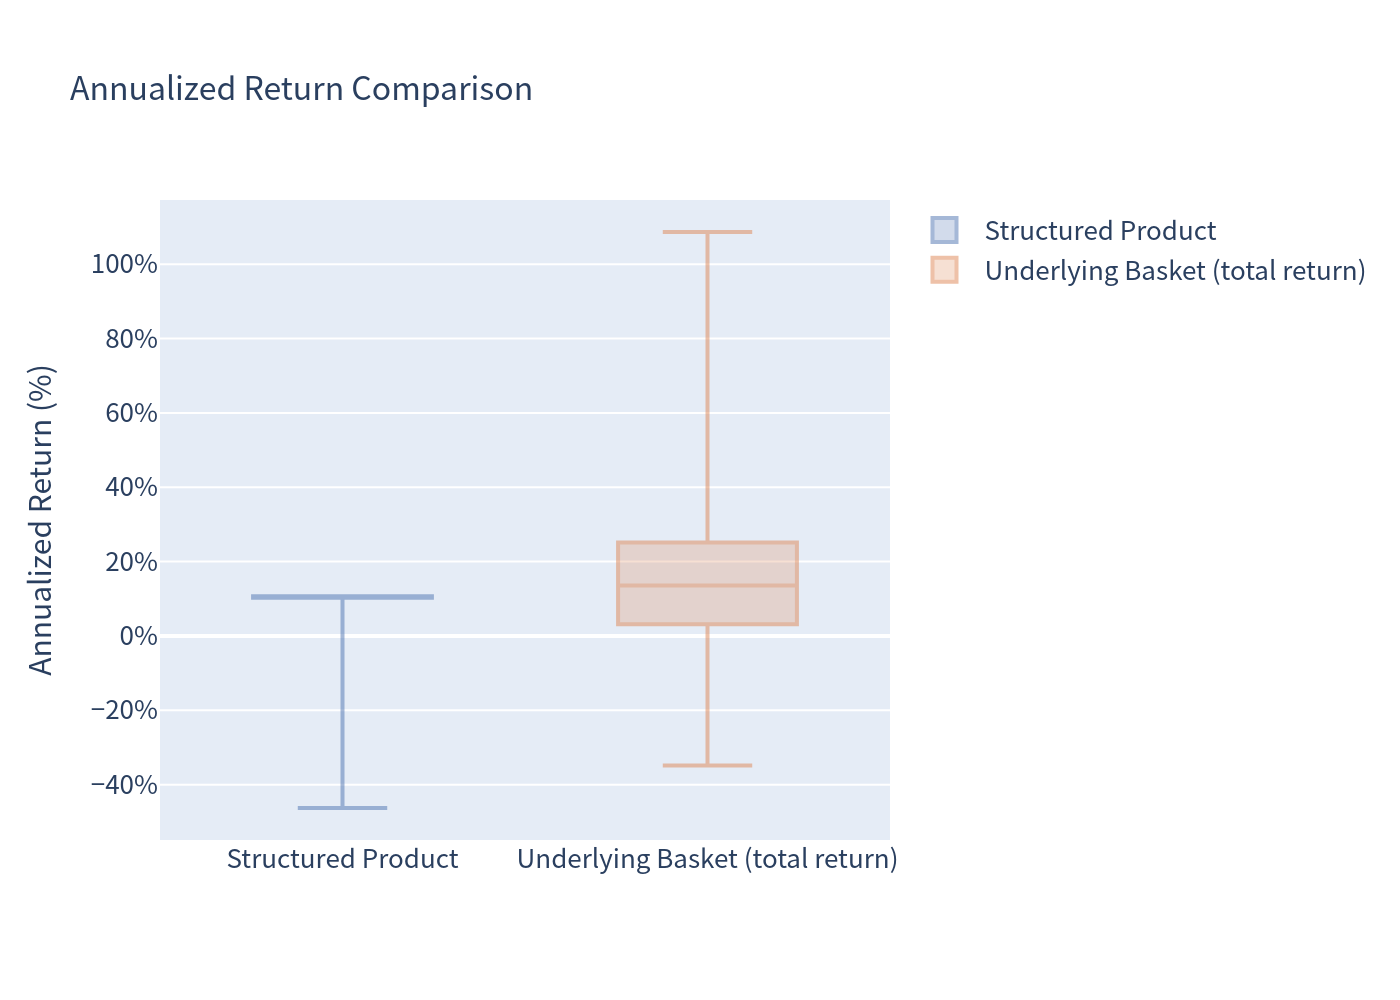
The product's distribution is sharply capped on the right (nothing above ~+10.7%/yr) with a long left tail, whereas the basket has a much wider and more symmetric spread.
Scenario probabilities
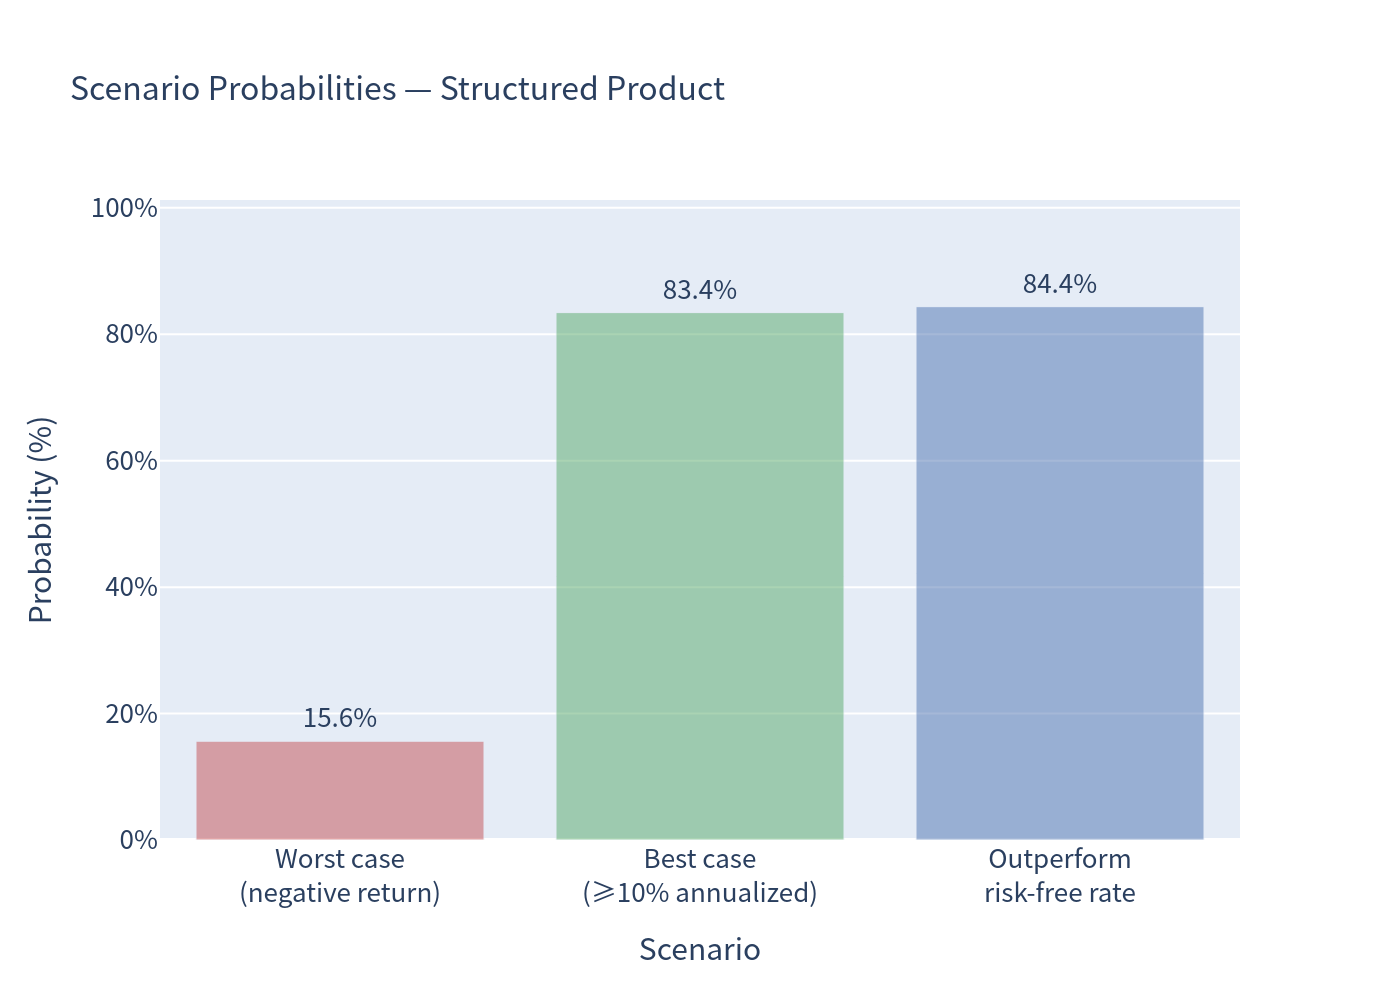
- Negative return: 15.63%
- Roughly the full coupon (≥10% annualized): 83.43%
- Beat the risk-free rate (~0%): 84.37%
- Achieve the capped maximum (+18.73% total, i.e. par + all 7 coupons): 33.95%
Risk / return profile
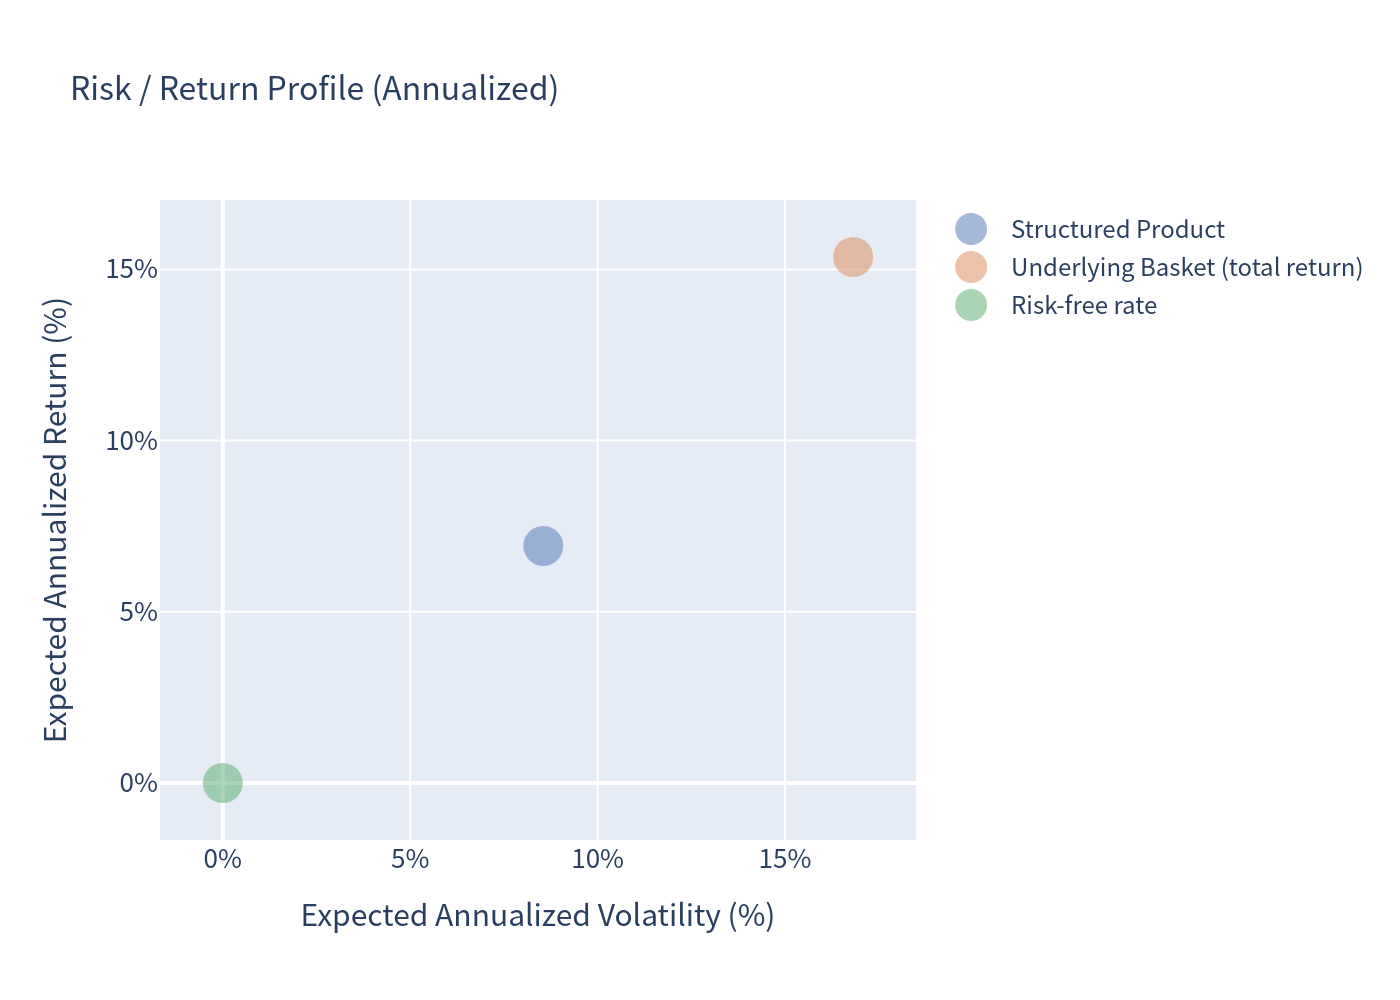
The product sits well to the left of the basket (much lower risk) but also below it on return. It offers a better return per unit of risk than the price-only basket, but a worse one than the basket's total return including its dividends.
Annualized return comparison
Holding period and coupon count
The product is not always held to maturity: it is called early in ~49% of paths.
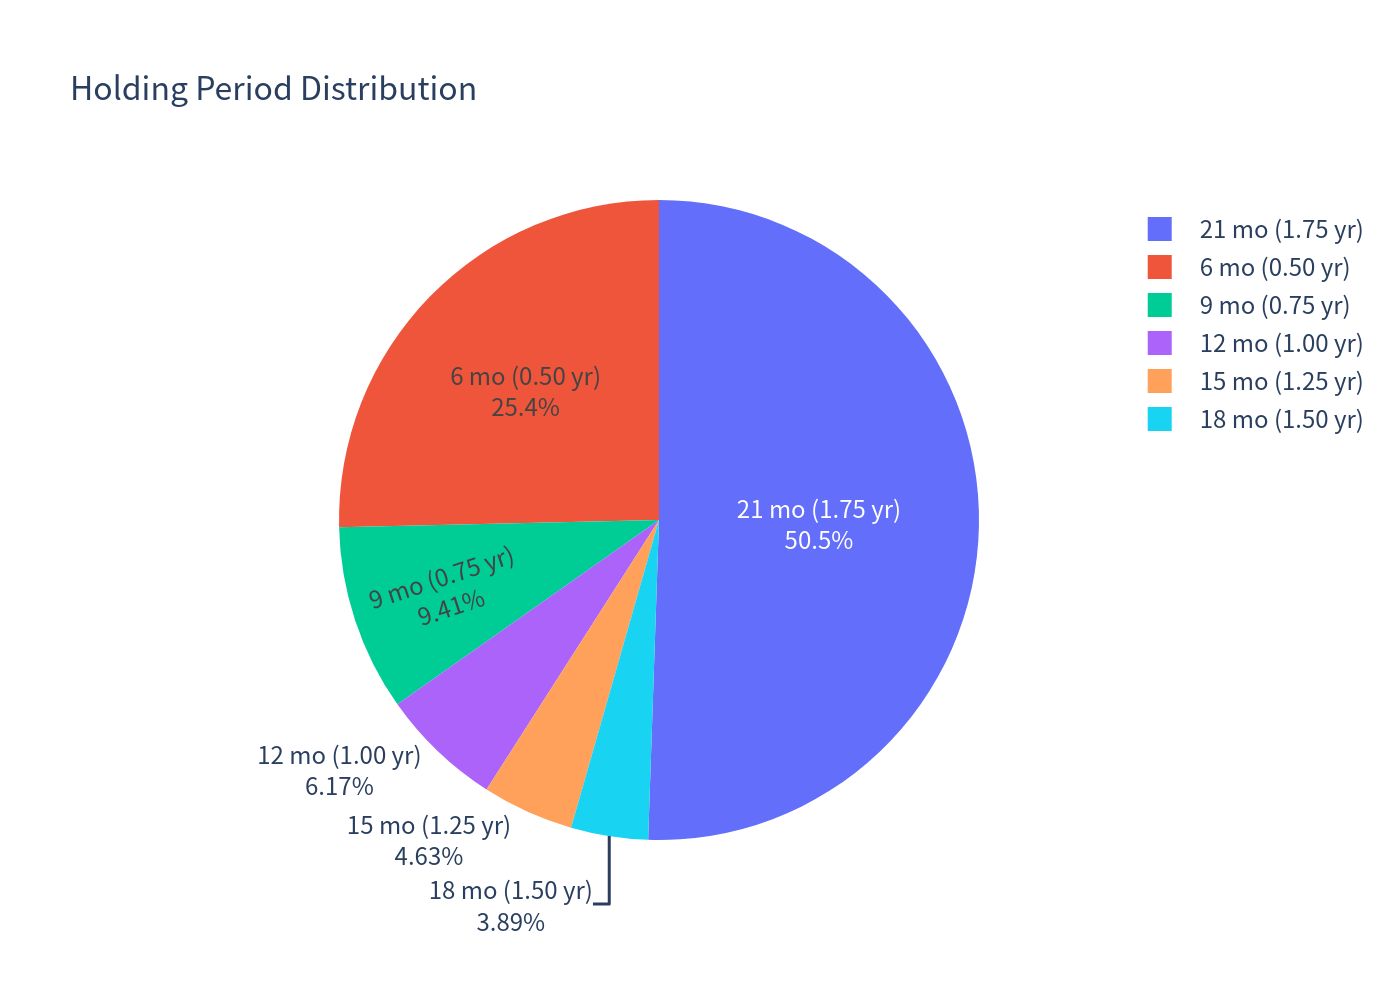
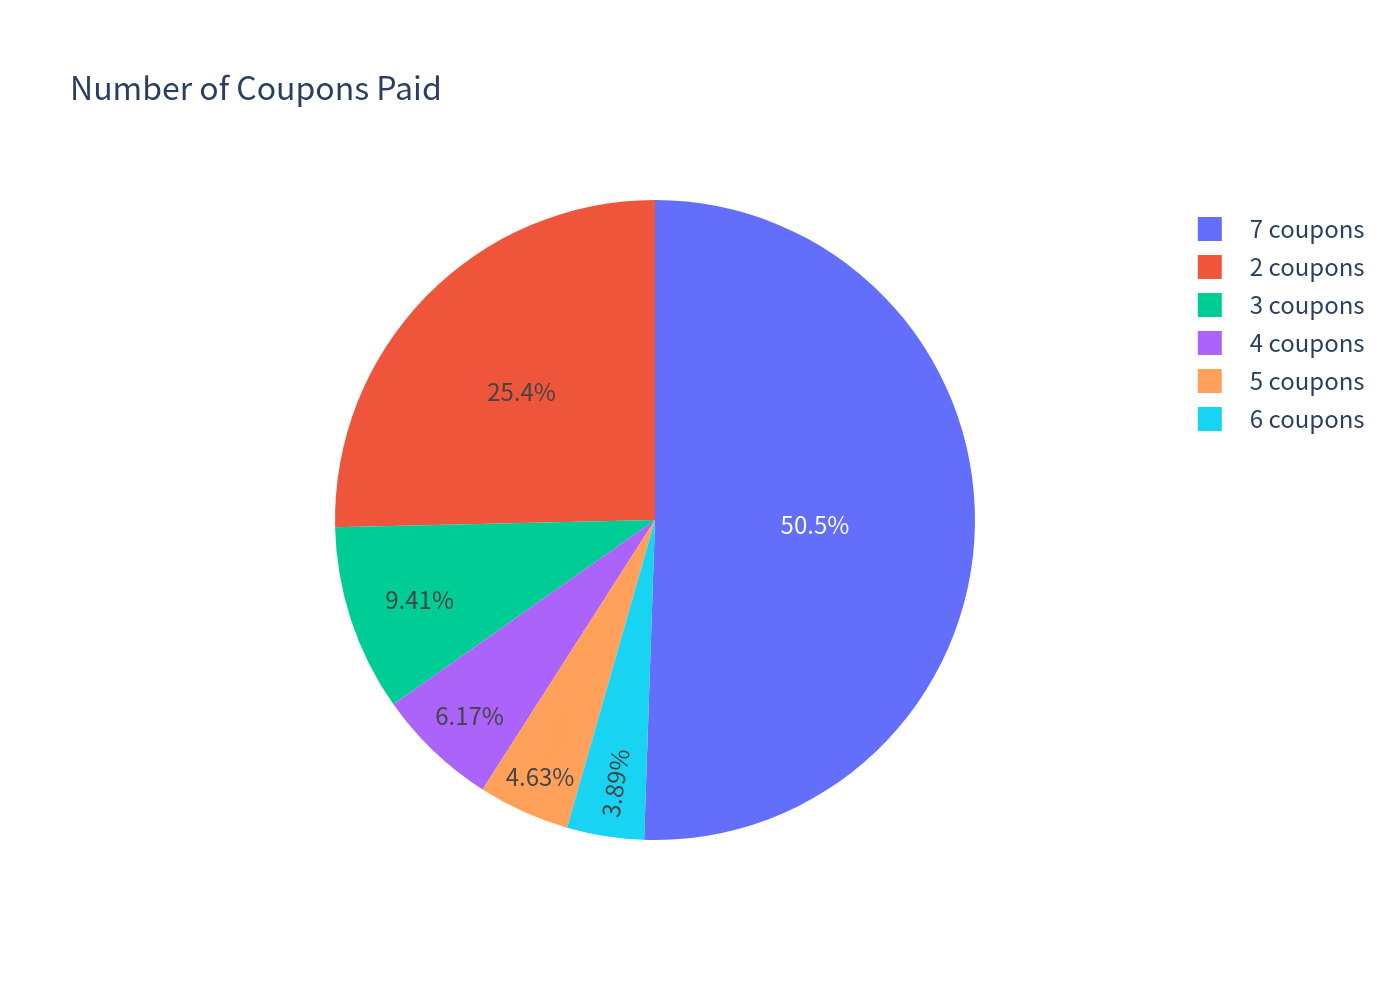
Most common early exit is at 6 months (25.4% of paths); ~50.5% of paths run the full 21 months and collect all 7 coupons.
Investment Commentary
Points in favour
- High, predictable income — a 10.70% p.a. coupon paid quarterly in all scenarios, including when the shares fall, which is well above CHF cash rates (~0%).
- Meaningful buffers — protection needs a one-third (35%) fall in the worst of three large-cap names to be breached, which is a high hurdle over only 21 months; ~84% of paths returned at least the risk-free rate.
- Low volatility / lower loss frequency — the barrier structure roughly halves the realized volatility versus holding the shares and cuts the probability of a loss from ~27% (price) to ~16%.
- Quanto CHF — no currency risk for a CHF-based investor; the coupon is fixed in CHF regardless of USD moves.
Points to be aware of
- Capped upside — you give up all capital gains on three stocks that historically include high dividend payers (Pfizer ~6.1%, Verizon ~6.8%); in an up-market the opportunity cost versus the basket is large (expected total basket return of ~15.4% vs ~6.9%).
- Barrier is continuously monitored and worst-of — a single intraday dip of any one name to 65% is enough to remove protection, and the payoff then locks onto the weakest name's performance.
- 99% VaR is worse than the basket (−22.2% vs −15.7%): when things go wrong, the product bears the full downside of the worst name with no share of the other two names' strength to cushion it.
- Issuer early call — the note is likely to be redeemed early precisely when the shares are strong (locking in 100% + coupon), which truncates the coupon stream and cap-limited upside; conversely you remain exposed when the shares are weak.
- Issuer credit risk (Leonteq, rated BBB−) — coupons and par depend on the issuer's ability to pay.
Figures are simulated outputs and are not a forecast. Percentages are annualized unless stated otherwise. This material is for information only and does not constitute investment advice.