Morgan Stanley Callable Jump Notes — Simulation & Risk Analysis
Headline Simulation Results
Basic Product Information
How it works (layman explanation)
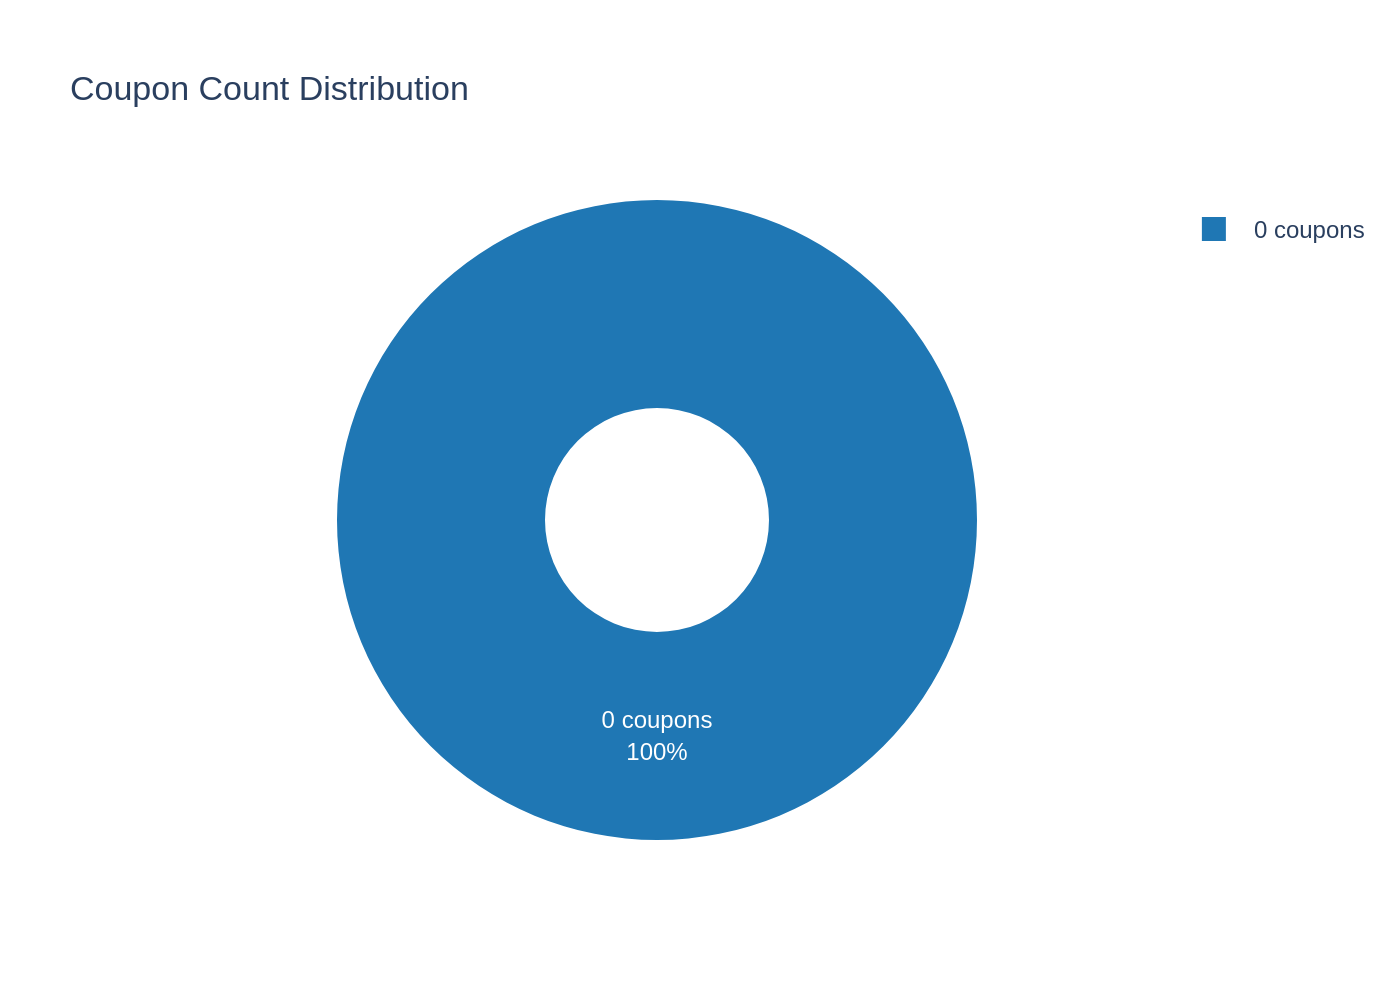
This is a callable "jump" note linked to the worst performing of the Russell 2000 and S&P 500 indices. It pays no coupons. Instead, investors earn a return in one of two ways:
- Early redemption (issuer call): Starting 12 months after issue and every month thereafter, Morgan Stanley may redeem the notes if its internal risk-neutral valuation model determines that redeeming is cheaper for the issuer than continuing to hold the notes. If called, investors receive a redemption payment that increases over time — from $1,110 per $1,000 (month 12) to $1,540.83 (month 59) — approximately an 11% per annum accrual. Once called, no further payments are made.
-
Payment at maturity (if never called):
- If both indices finish above their initial levels: principal + 100% participation in the worst performer's gain (uncapped).
- If either index finishes at or below its initial level: principal only ($1,000).
Because the issuer only calls when it is economic for it to do so, the notes tend to be redeemed early in rising markets (capping investor upside near the scheduled redemption payments) and held to maturity in flat or weak markets (where the payoff is principal, or a modest gain if both indices are up).
Simulation summary
| Outcome | Probability |
|---|---|
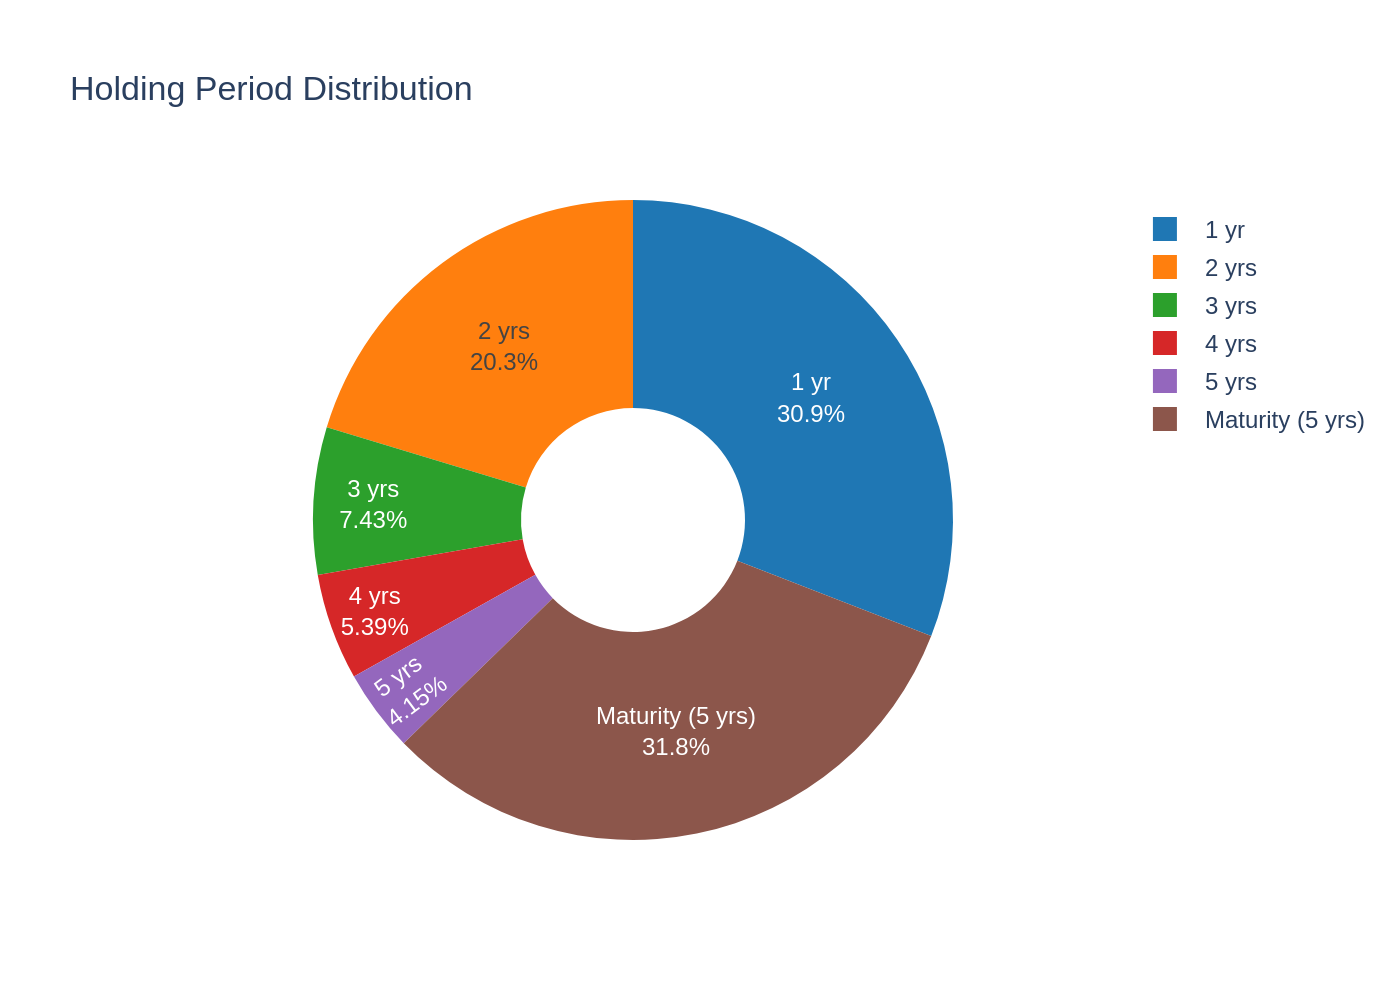
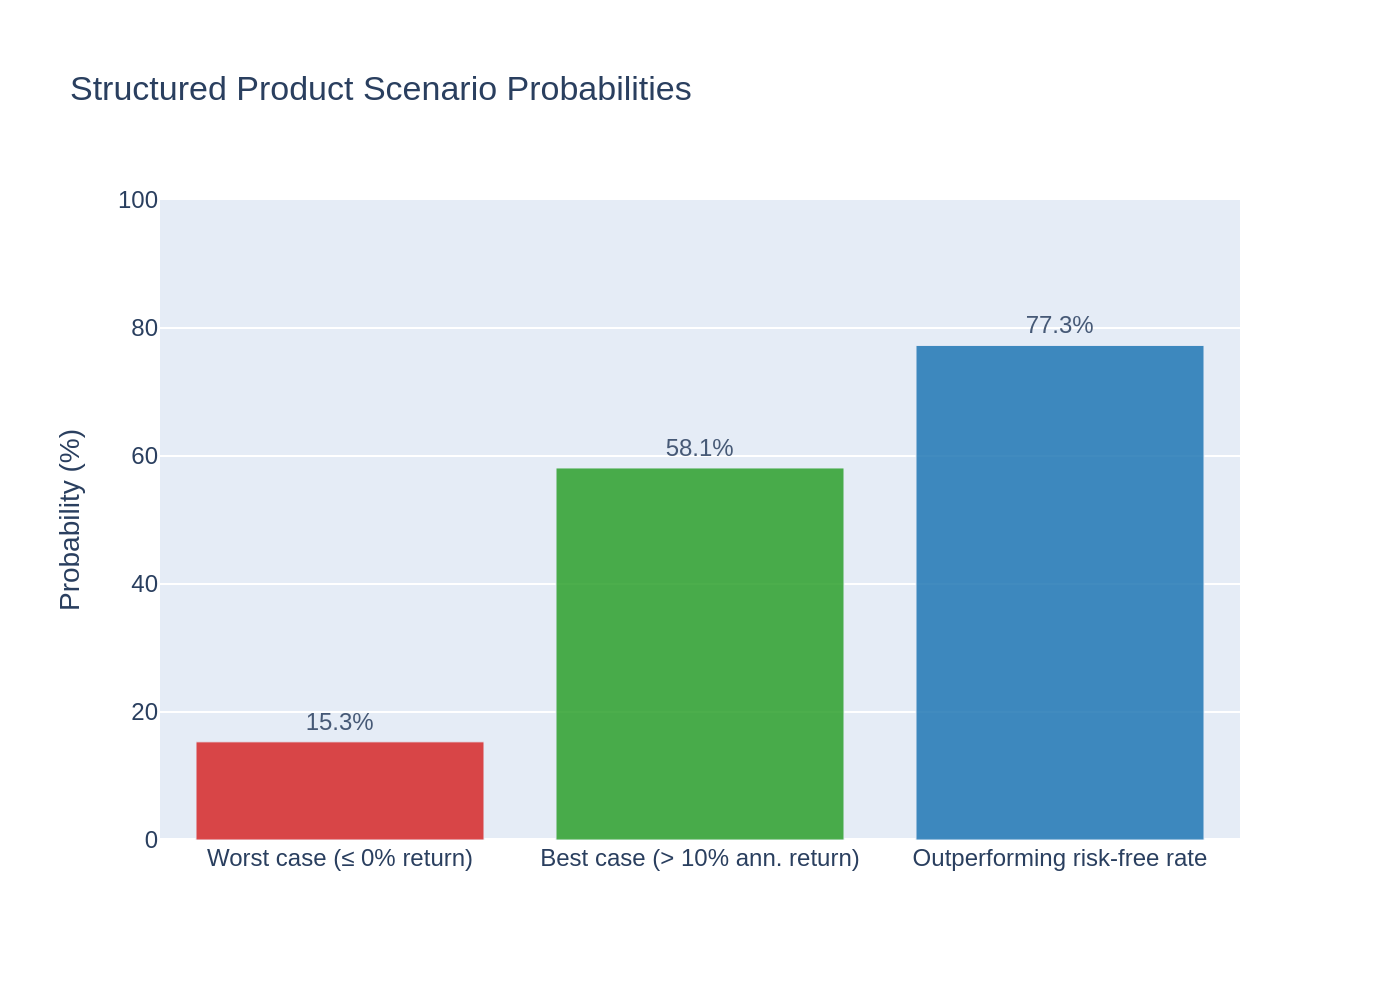
| Called early (average at ~20.4 months) | 68.20% |
| Held to maturity | 31.80% |
| — of which both indices up at maturity (gain = worst performer return) | 16.46% |
| — of which at least one index ≤ initial (principal only, 0% return) | 15.34% |
Key Statistics — Structured Product vs Underlying Basket
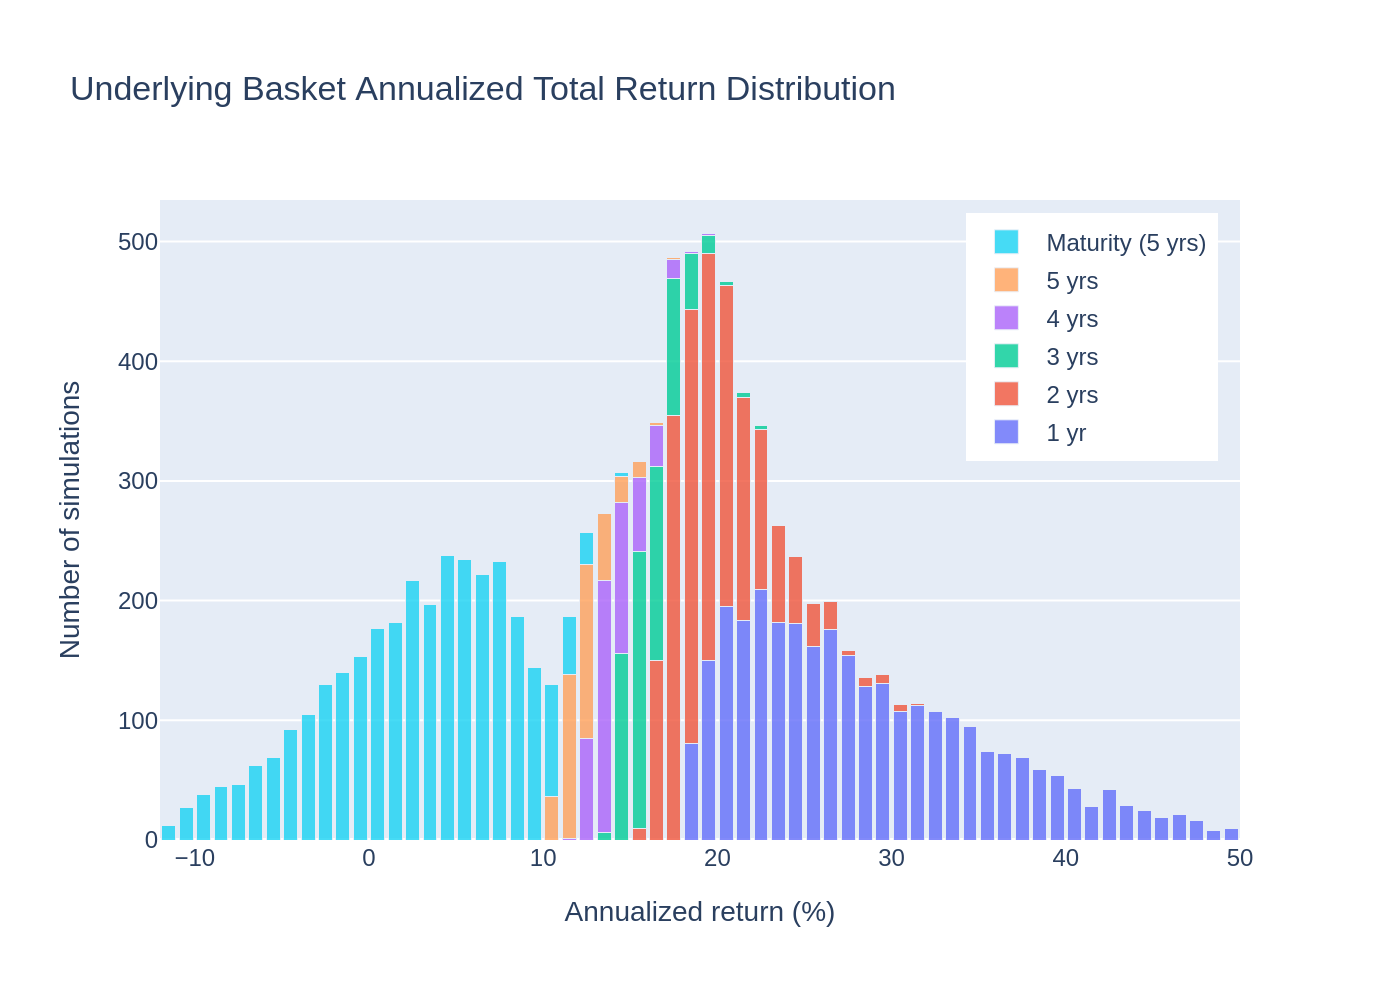
Statistics below are computed on annualized returns over each simulation's realized holding period (12–60 months). The underlying benchmark is an equal-weight basket of the two indices (50% Russell 2000 / 50% S&P 500), including reinvested dividends.
| Metric | Structured Product | Underlying Basket |
|---|---|---|
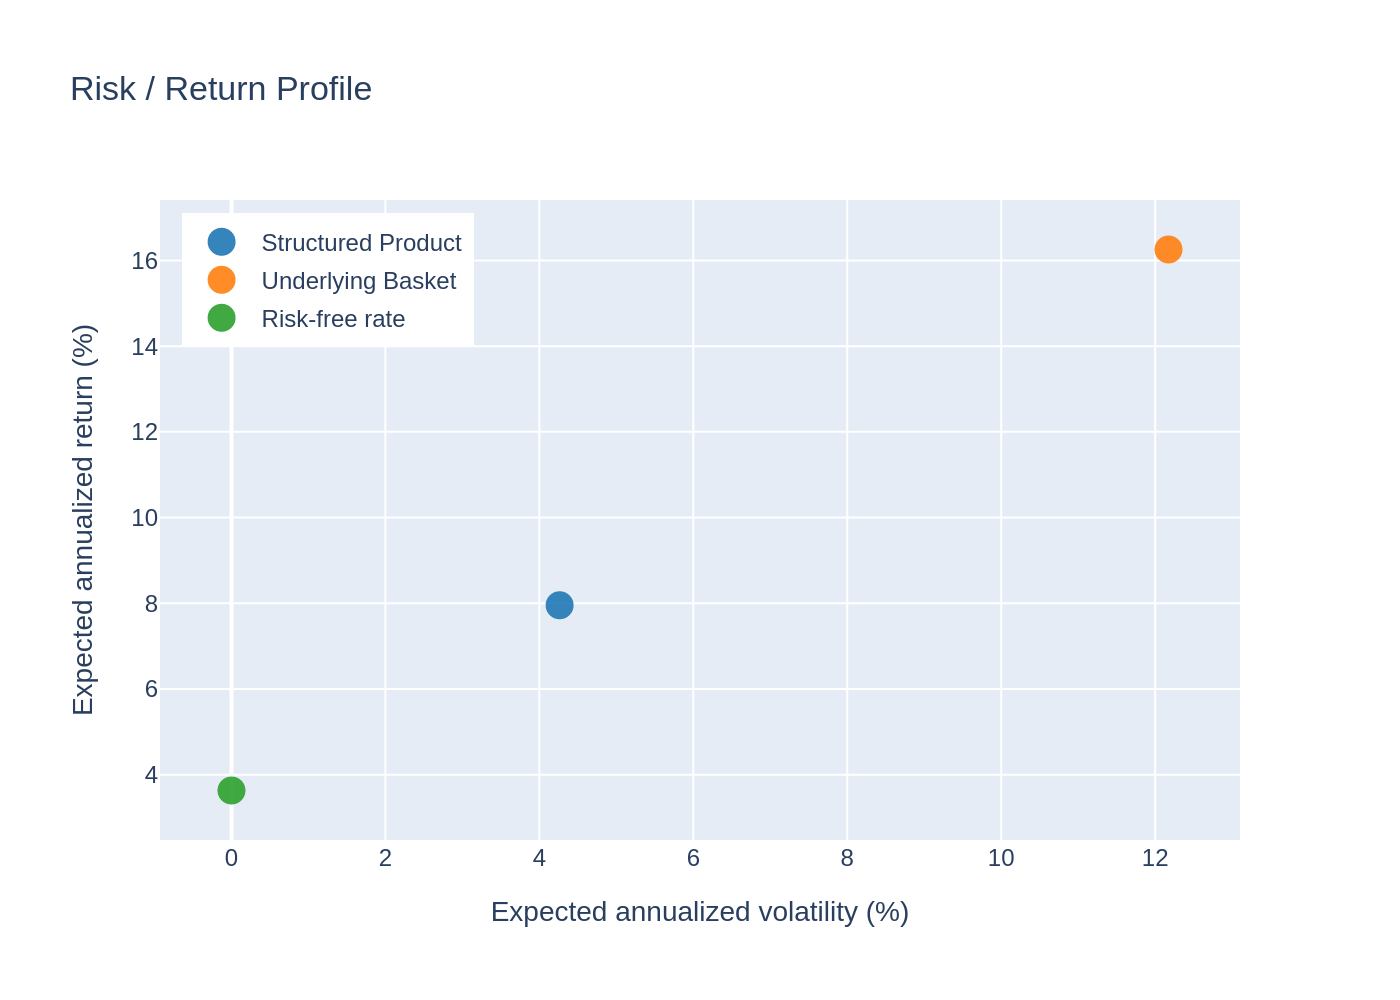
| Expected annualized return | 7.95% | 16.26%1 |
| Expected annualized volatility | 4.26% | 12.17% |
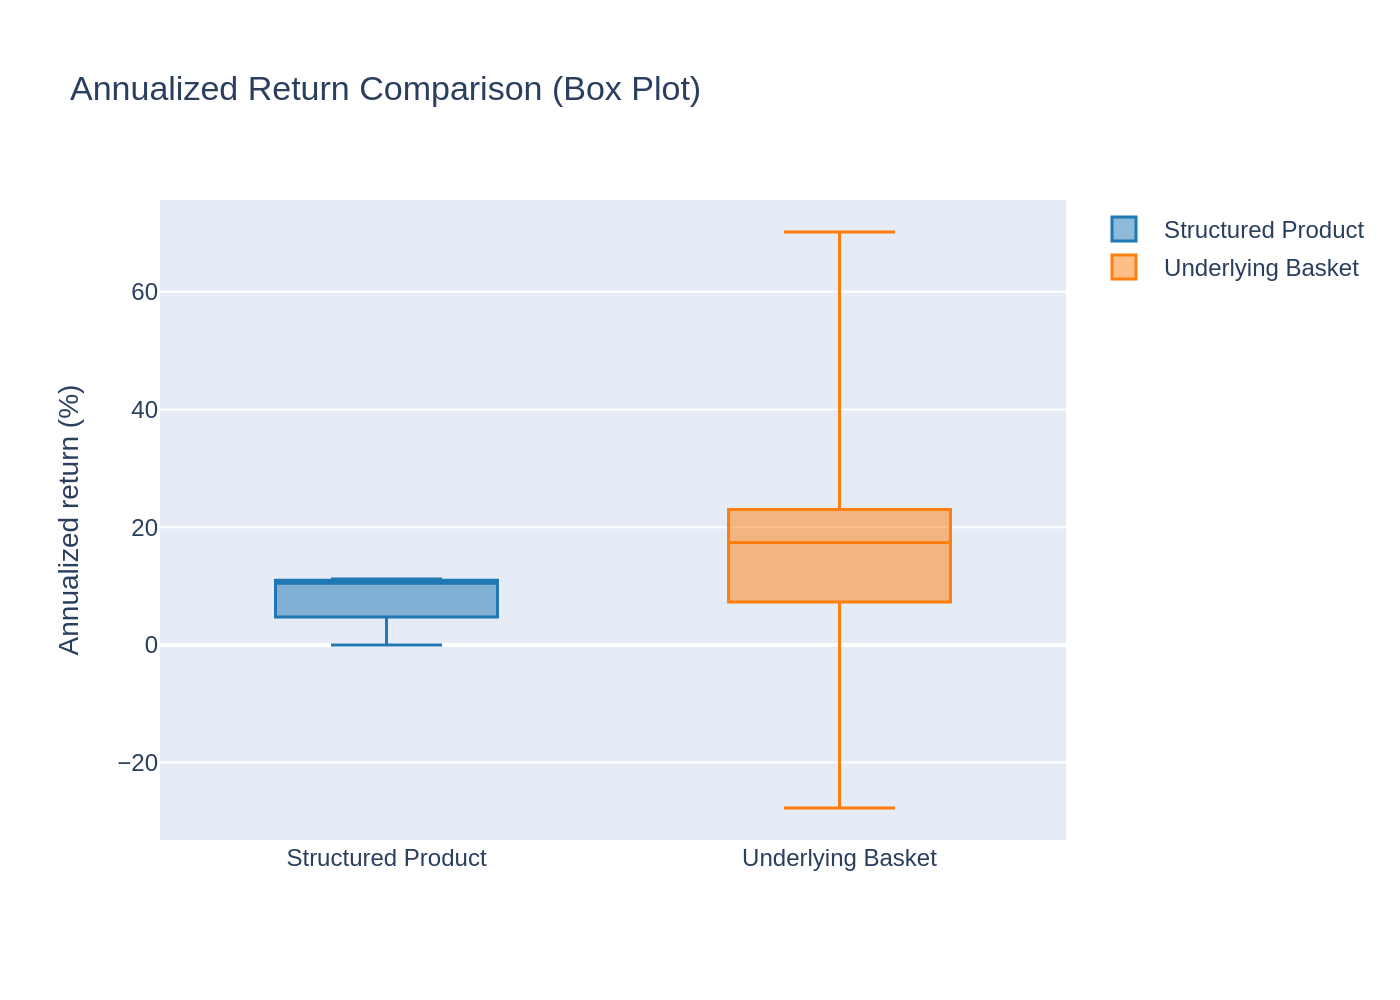
| Probability of loss | 0.00% | 9.74% |
| 99% VaR (1-year) | 0.00% | −9.71% |
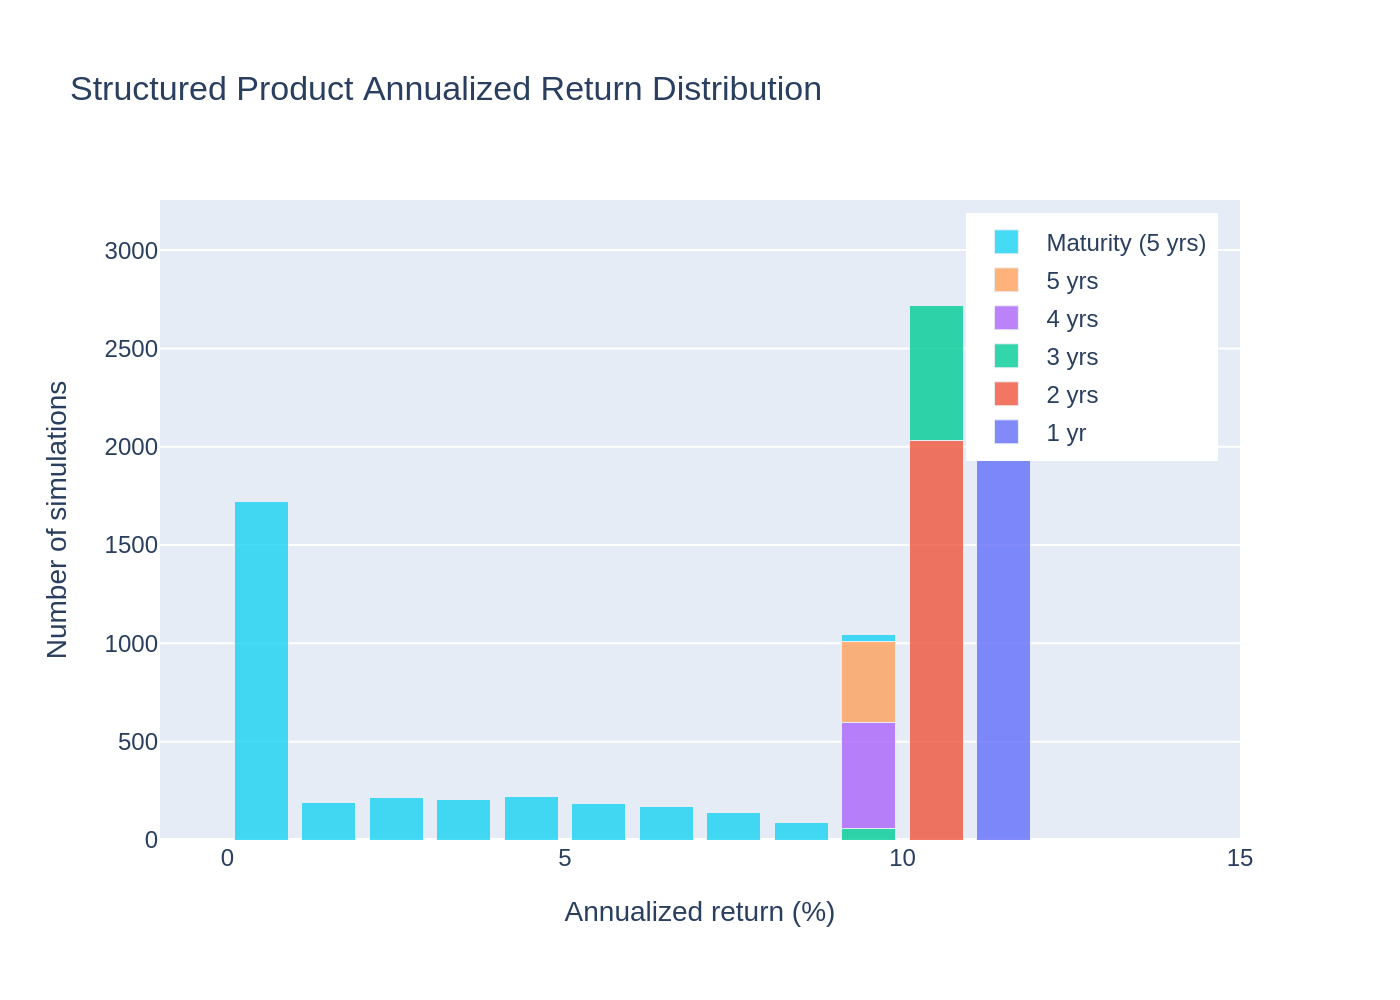
Reading the numbers together: the structured product offers a lower expected return than a direct basket investment but with zero downside and much lower volatility. Its return distribution is highly concentrated: roughly half of scenarios earn ≈11% per annum (early call at the scheduled redemption payments), while maturity scenarios earn 0% to modest upside.
Charts
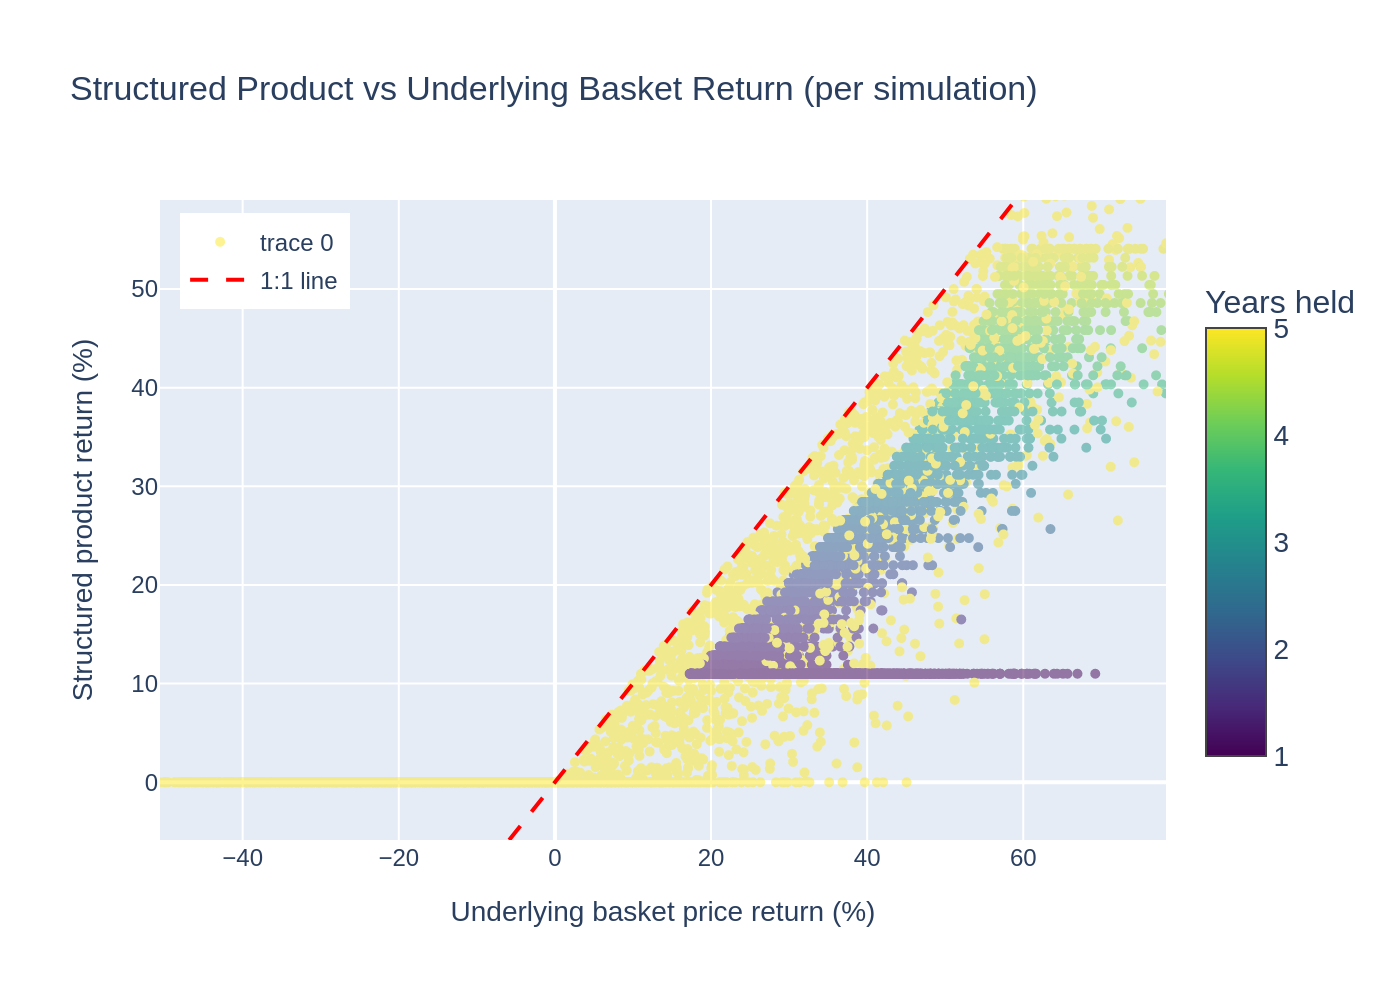
Simulation Outcomes Scatter
Each dot is one simulated path: structured product return vs. the underlying basket's price return over the same horizon, colored by years held.
Annualized Return Distributions
Stacked histograms (1% bins) of annualized returns, colored by holding period.
Scenario Probabilities
Risk / Return Profile
Annualized Return Comparison
Holding Period & Coupon Distribution
Left: probability of the notes being held for each number of years (or to maturity). Right: coupon payments — this product pays no coupons, so 100% of scenarios receive 0 coupon payments.