
Worst-of Russell 2000 & S&P 500 Callable Jump Notes — Simulation Analysis
Headline Simulation Results
Based on 10,000 Monte-Carlo simulations over the full 5-year horizon (monthly granularity):
| Metric | Structured Product | Benchmark (Equal-Weight RTY/SPX, total return) |
|---|---|---|
| Expected annualized return | 7.71% | 14.82% |
| Probability of negative return | 0.00% | 12.01% |
| 99% confidence VaR (1 year) | 0.00% | −11.04% |
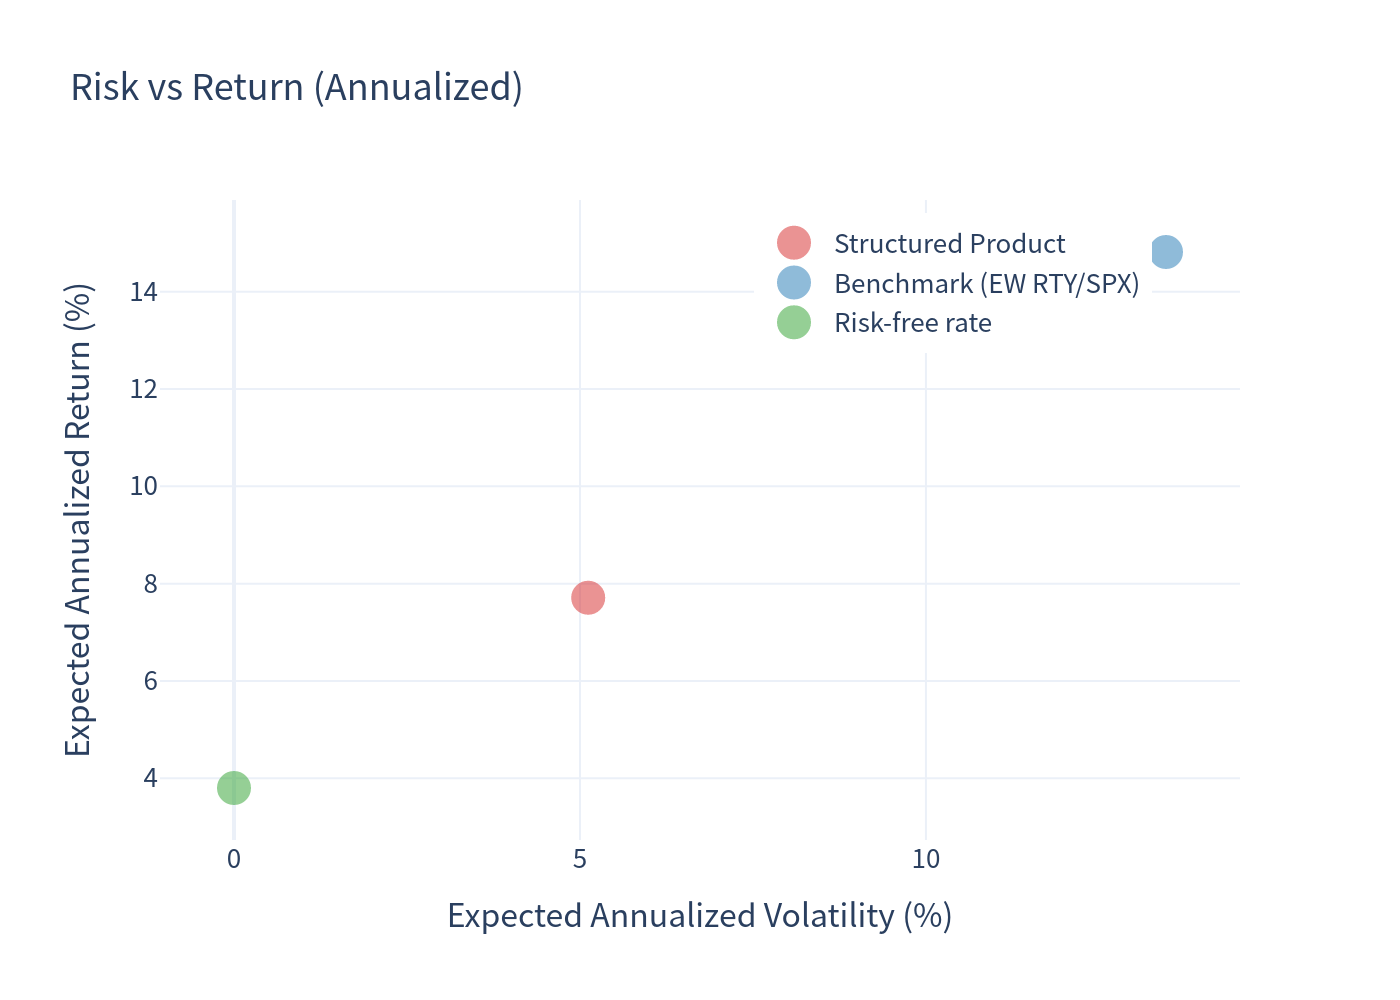
| Expected annualized volatility | 5.12% | 13.47% |
| Expected total return (over realized holding period) | 24.24% | 37.13% |
| Expected holding period | 3.63 years | 3.63 years |
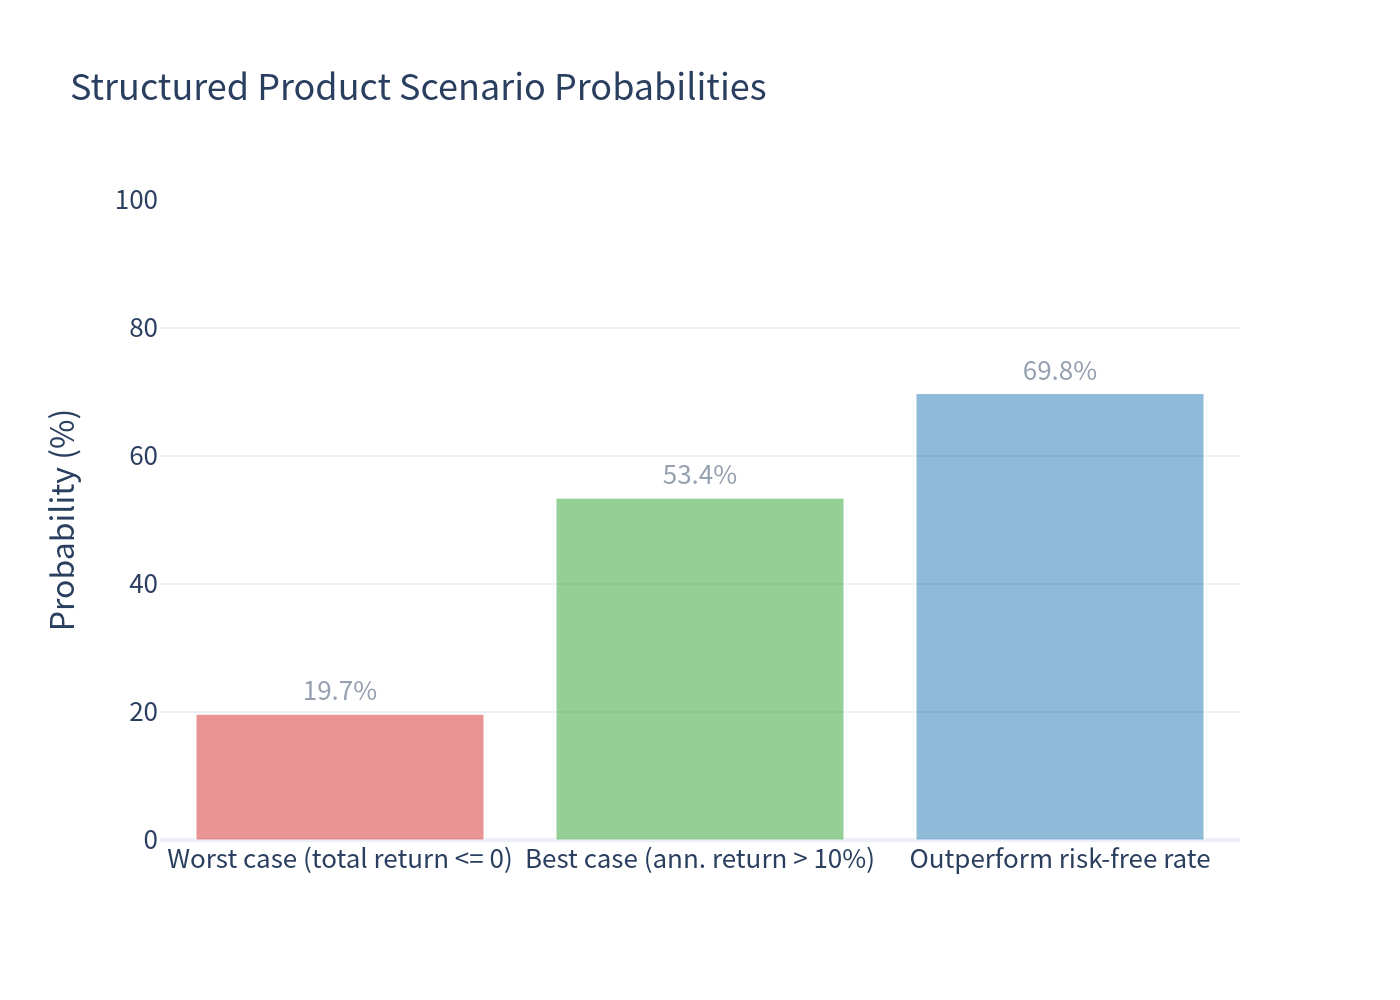
Key takeaways. The notes are fully principal-protected if held to maturity, so the simulated probability of a capital loss and the 1-year 99% VaR are effectively 0%. The trade-off is a materially lower expected return (+7.71% p.a.) than the equal-weight RTY/SPX basket (+14.82% p.a.), reflecting both (i) the cost of the downside protection and (ii) the issuer's call, which truncates the upside. The worst outcome is a flat 0% return (≈19.66% of paths), and the strategy beats the risk-free rate (~3.80%) in ~69.75% of simulations.
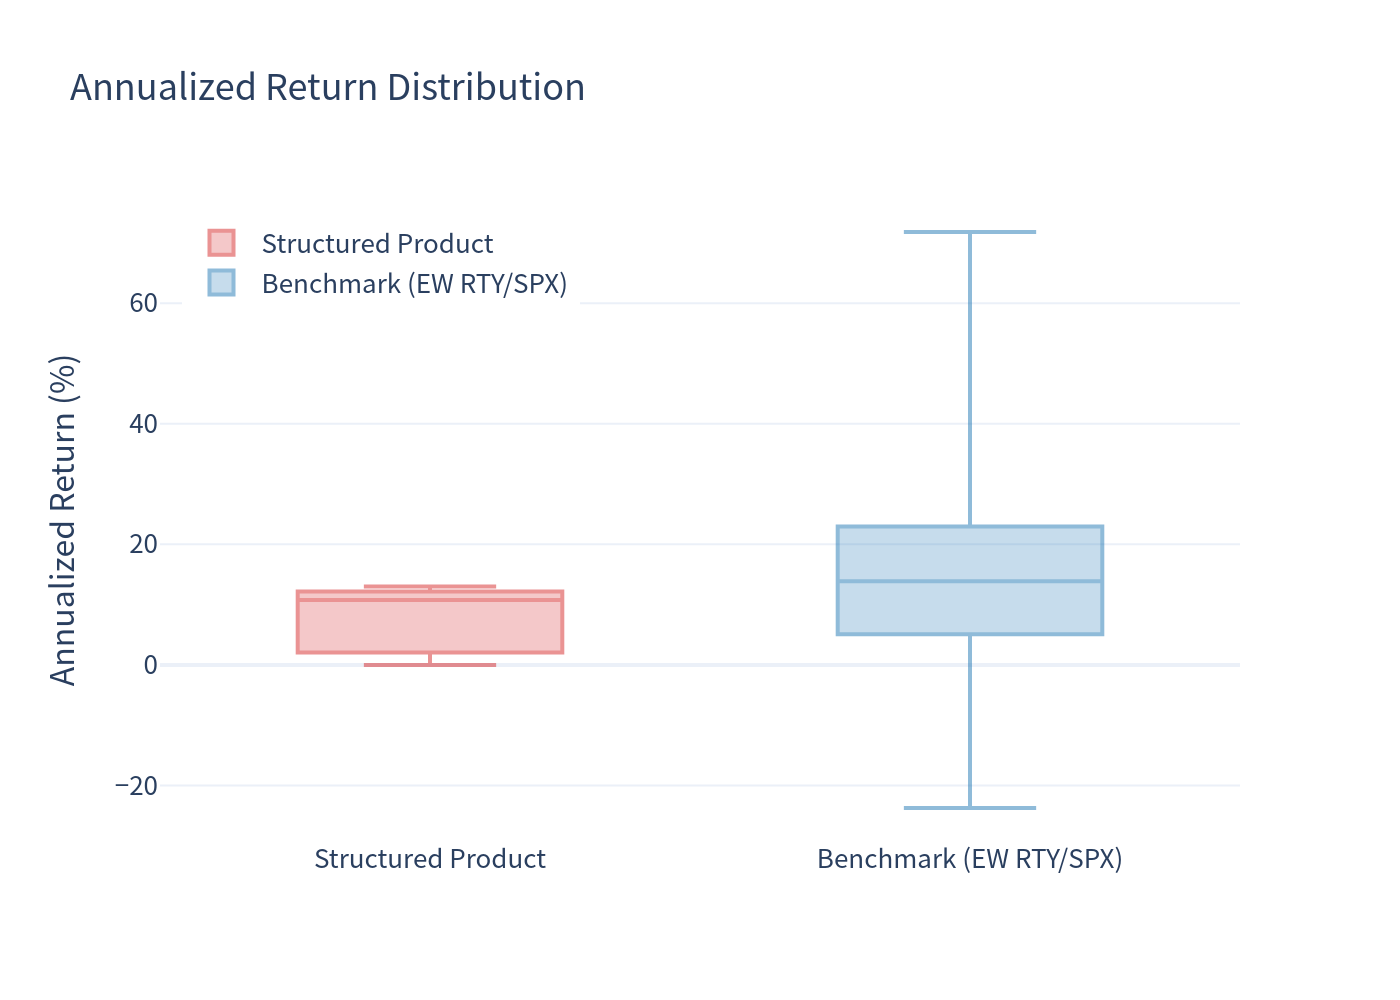
Reading the annualized numbers (important). Because the notes are callable, the holding period varies per simulation (3.63 years on average). Annualized figures are the mean of each simulation's own annualized (CAGR-type) return, while "total return" is the mean of the realized total returns over their own (shorter) horizons. The two are not a simple power relation. Early redemption happens because the markets rallied, so short holding periods coincide with sizeable trailing returns; those paths get annualized over a short window, which lifts the mean annualized return above the growth rate of the mean total return. For reference, the benchmark's realized total-return paths average +37.13% (≈+9.1% p.a. if grown smoothly over 3.63 years), yet the mean per-path annualized figure is +14.82%. Both describe the same simulations. The product's median annualized return is 10.78% vs. the benchmark's 13.89%.
The "99% VaR (1 year)" figure reflects hold-to-call-or-maturity outcomes (the payoff profile), not a forced sale at month 12; secondary-market prices before maturity could fall below par due to rate/credit moves, which is not modeled here.
What the Product Is (Plain-English)
The note is a 5-year, principal-protected participation note linked to the worse of two equity indices — the Russell 2000 (RTY) and the S&P 500 (SPX):
- Upside: You participate 100% in the return of the worst-performing of the two indices — but only to the upside (there is no leverage).
- Downside: There is no barrier and no kick-in. At maturity (if the note has not been called) you receive at least $1,000 back per note regardless of how far the indices fall — including a −100% worst-performer.
- Issuer call (the "jump"): Beginning after year 1, the issuer may redeem the notes monthly on any scheduled date if a risk-neutral valuation model deems it economically rational. The redemption price steps up over time (≈ $1,130 in year 1 rising to ≈ $1,639 by year 5). When the issuer calls, the note ends and you receive that fixed redemption amount — capping your remaining upside.
In short: you get your principal back (if held), you share in the upside of the weaker index, but the issuer can pull the notes away whenever the index performance makes that attractive to them.
Key Statistics
The product behaves like a capital-protected worst-of call. Relative to the underlying basket it converts equity risk into a much tighter distribution: the standard deviation of annualized returns falls from 13.47% to 5.12%, and downside tail risk is eliminated at maturity in exchange for a lower central expectation.
| Statistic | Structured Product | Benchmark |
|---|---|---|
| Expected annualized return | 7.71% | 14.82% |
| Median annualized return | 10.78% | 13.89% |
| Expected annualized volatility | 5.12% | 13.47% |
| Probability of loss | 0.00% | 12.01% |
| 99% VaR (1 year) | 0.00% | −11.04% |
| Probability of flat (0%) outcome | 19.66% | — |
| Probability of > 10% annualized | 53.42% | — |
| Probability of beating the risk-free rate | 69.75% | — |
| Probability of early redemption (issuer call) | 52.21% | — |
Charts
Simulation outcomes vs. the benchmark
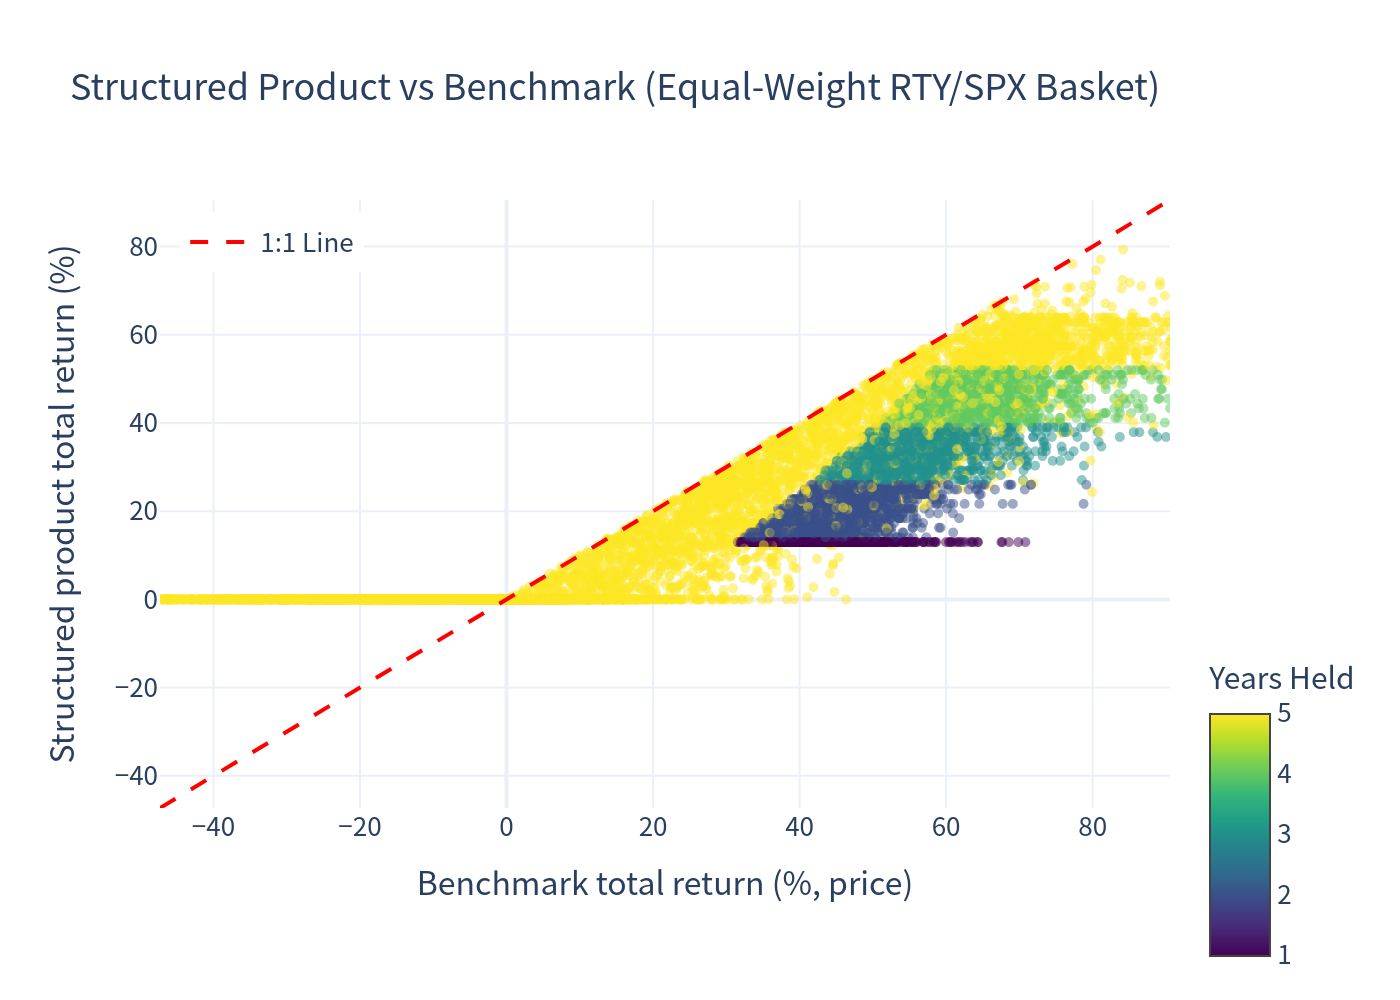
Each point is one simulation. Returns below the 1:1 line indicate under-performance versus the equal-weight basket (typical when the issuer calls and caps the upside); the floor at 0% reflects the principal protection.
Distribution of annualized returns
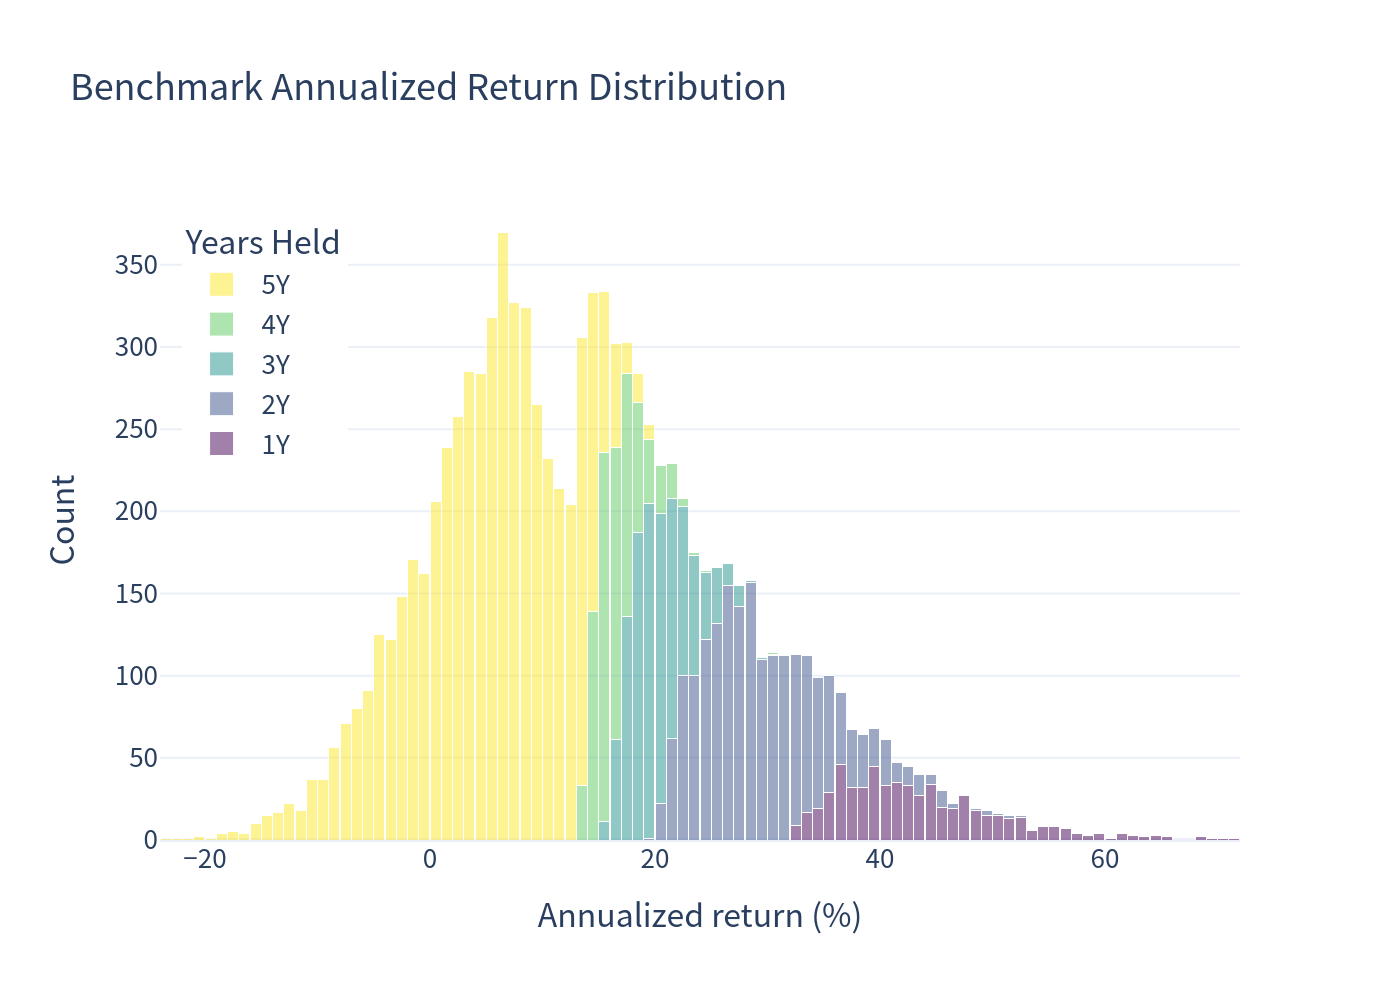
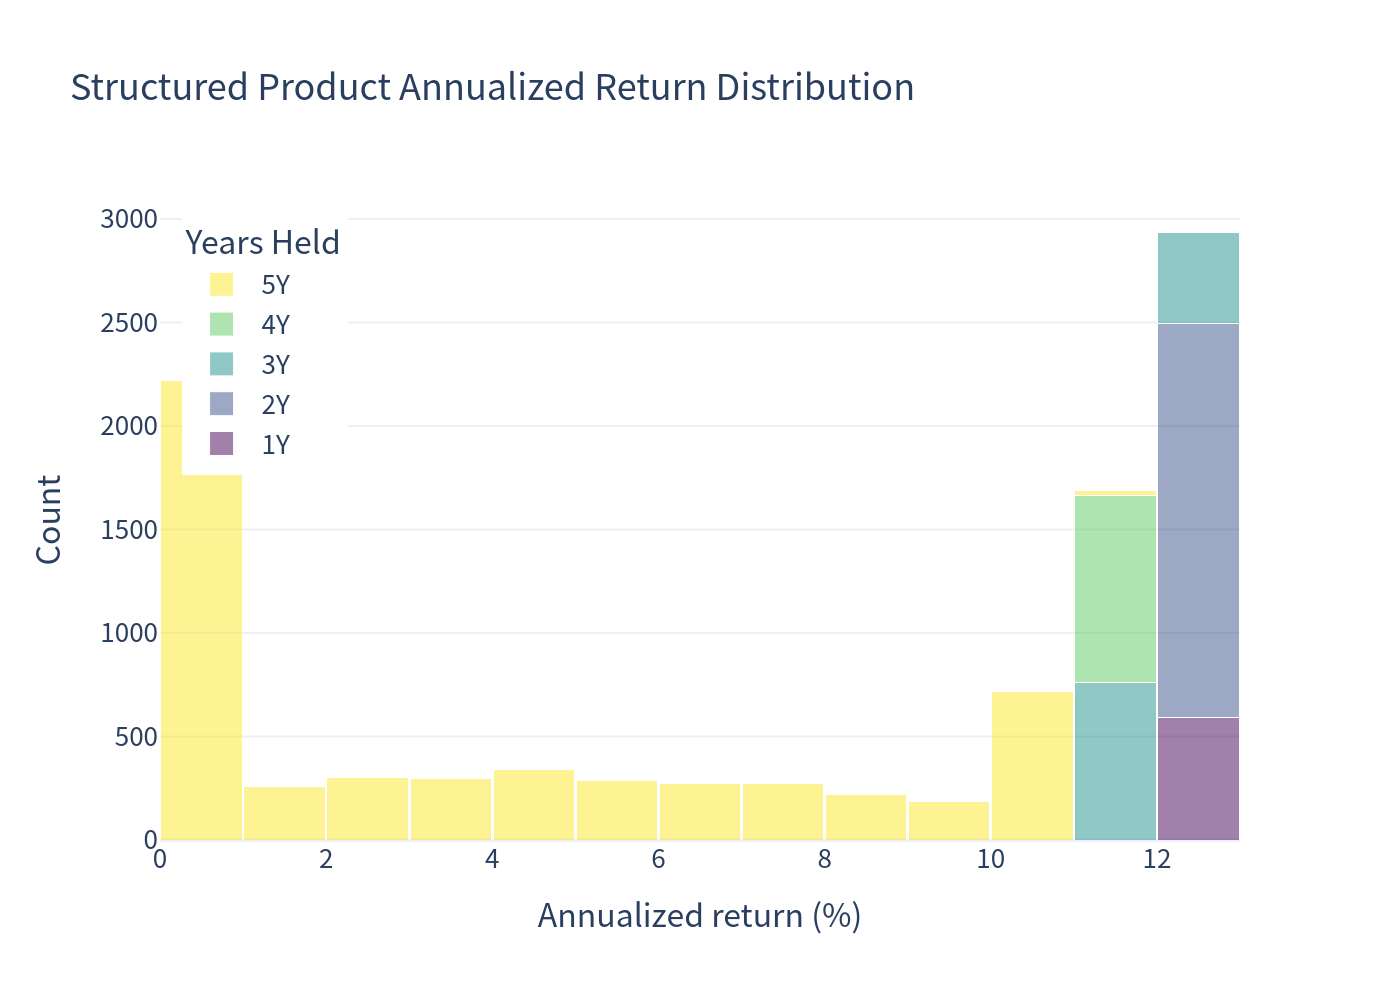
The benchmark has a wide, roughly symmetric bell with a left tail (losses in ~12% of paths). The product is tightly clustered in positive territory with a hard floor at 0% and a soft ceiling created by the issuer call.
Scenario probabilities
Risk vs. return
Annualized return comparison (box plot)
Holding-period distribution
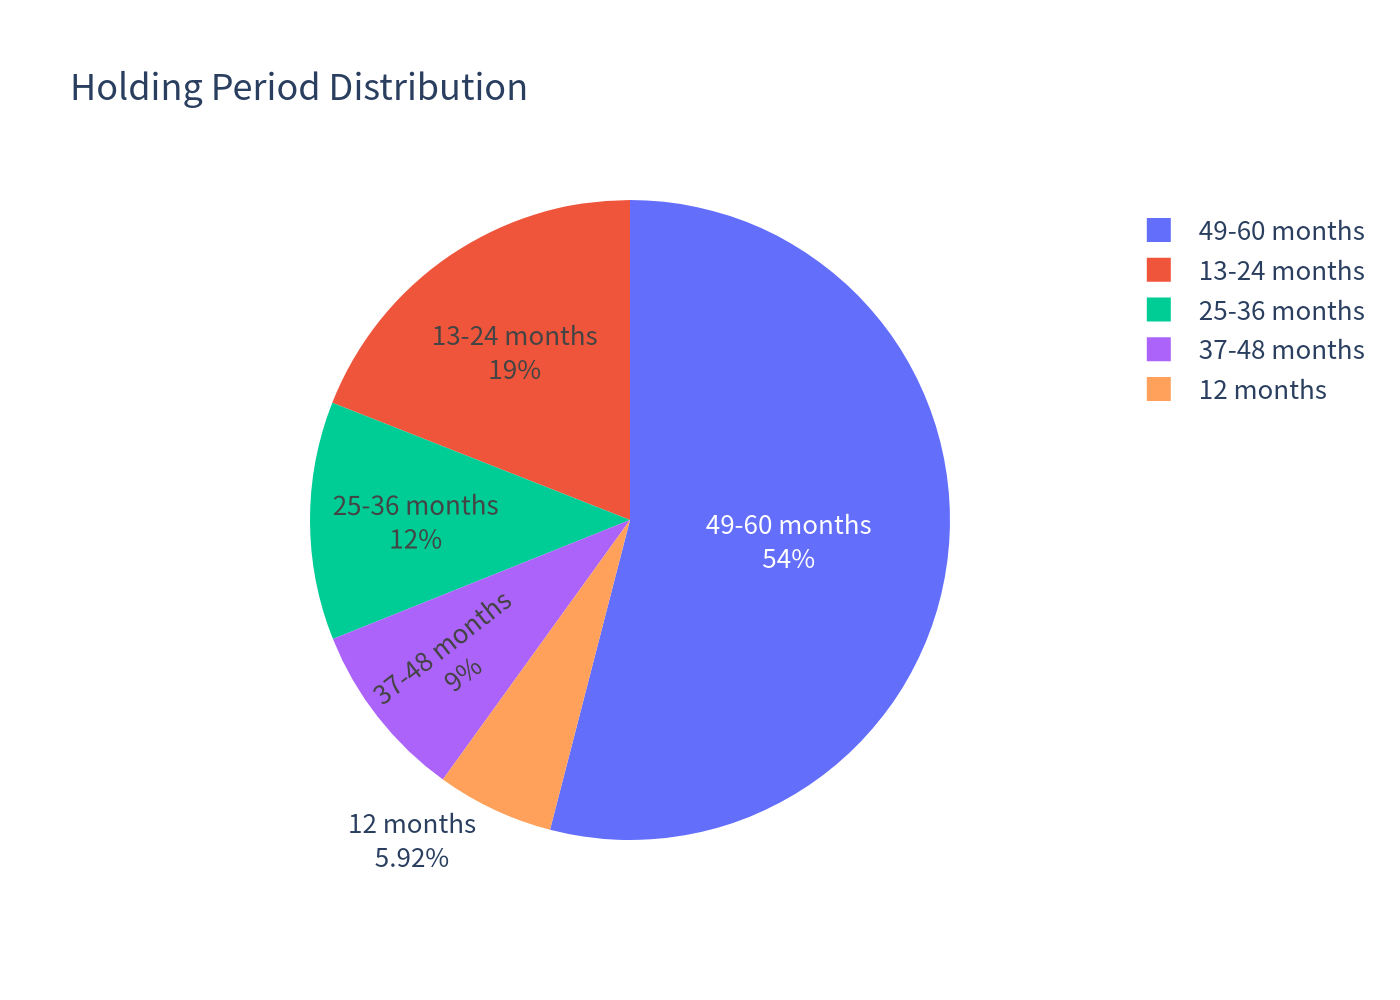
Because the notes are callable, holding period varies: ~47.8% are held all the way to maturity, while ~52.2% are redeemed early — about 5.9% after 12 months, 19.0% within 13–24 months, 12.0% within 25–36 months, and 9.0% within 37–48 months. Early calls cluster in the first two years, when the +13% call hurdle is easiest to clear.
Investment Commentary
Potential strengths
- Capital protection at maturity: the note returns at least par if held, so the simulated probability of a loss is 0% and the downside tail is removed — attractive for risk-averse profiles seeking equity-linked upside.
- Equity upside participation: 100% participation in the upside of worst-of RTY/SPX, with no leverage or knock-in risk, offers a defined-risk way to own equity beta.
- Positive expected excess return: the strategy is projected to beat cash (risk-free ~3.80%) in roughly seven out of ten simulations, with a comfortable probability of a double-digit annualized outcome.
Potential limitations
- Return is capped by the call: early redemption limits participation — 52.2% of paths are called, and the notes are most likely to be redeemed precisely when the indices have rallied, capping the best outcomes.
- Lower central expectation: the expected annualized return (7.71%) is well below the basket's (14.82%); the protection and call features cost roughly half the expected return.
- Worst-of linkage lowers the hurdle: linking to the weaker of two indices means the participation leg is "in the money" far less often than a single-index or best-of structure.
- Issuer / credit and early-redemption risk: payments depend on the issuer's credit, and the discretionary call can shorten the investment when you would least wish it.
Simulated results are hypothetical and depend on model and market-data assumptions. All figures are annualized unless stated otherwise.