
Morgan Stanley Contingent Income Auto-Callable Securities (Worst-of) — Analysis
Headline Simulation Results
| Metric | Value |
|---|---|
| Expected annualized return | 7.80% |
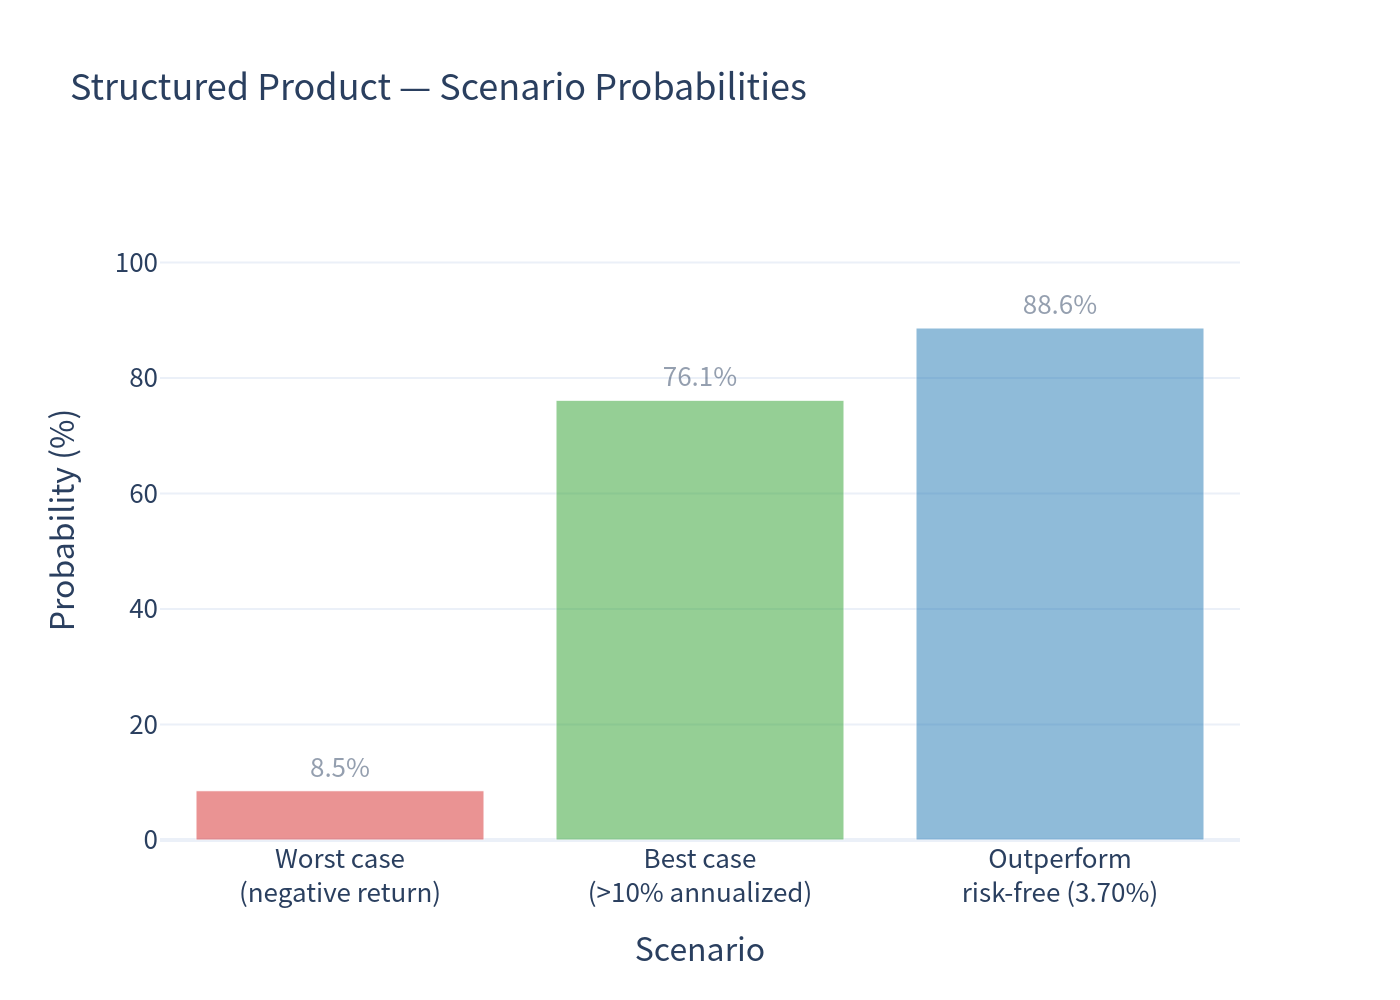
| Probability of a negative return | 8.53% |
| 99% confidence VaR (1-year, 1st percentile) | −31.40% |
| Probability of outperforming the risk-free rate (3.70%) | 88.65% |
| Expected holding period | ≈ 1.0 year (11.98 months) |
| Probability of early redemption (before maturity) | 76.95% |
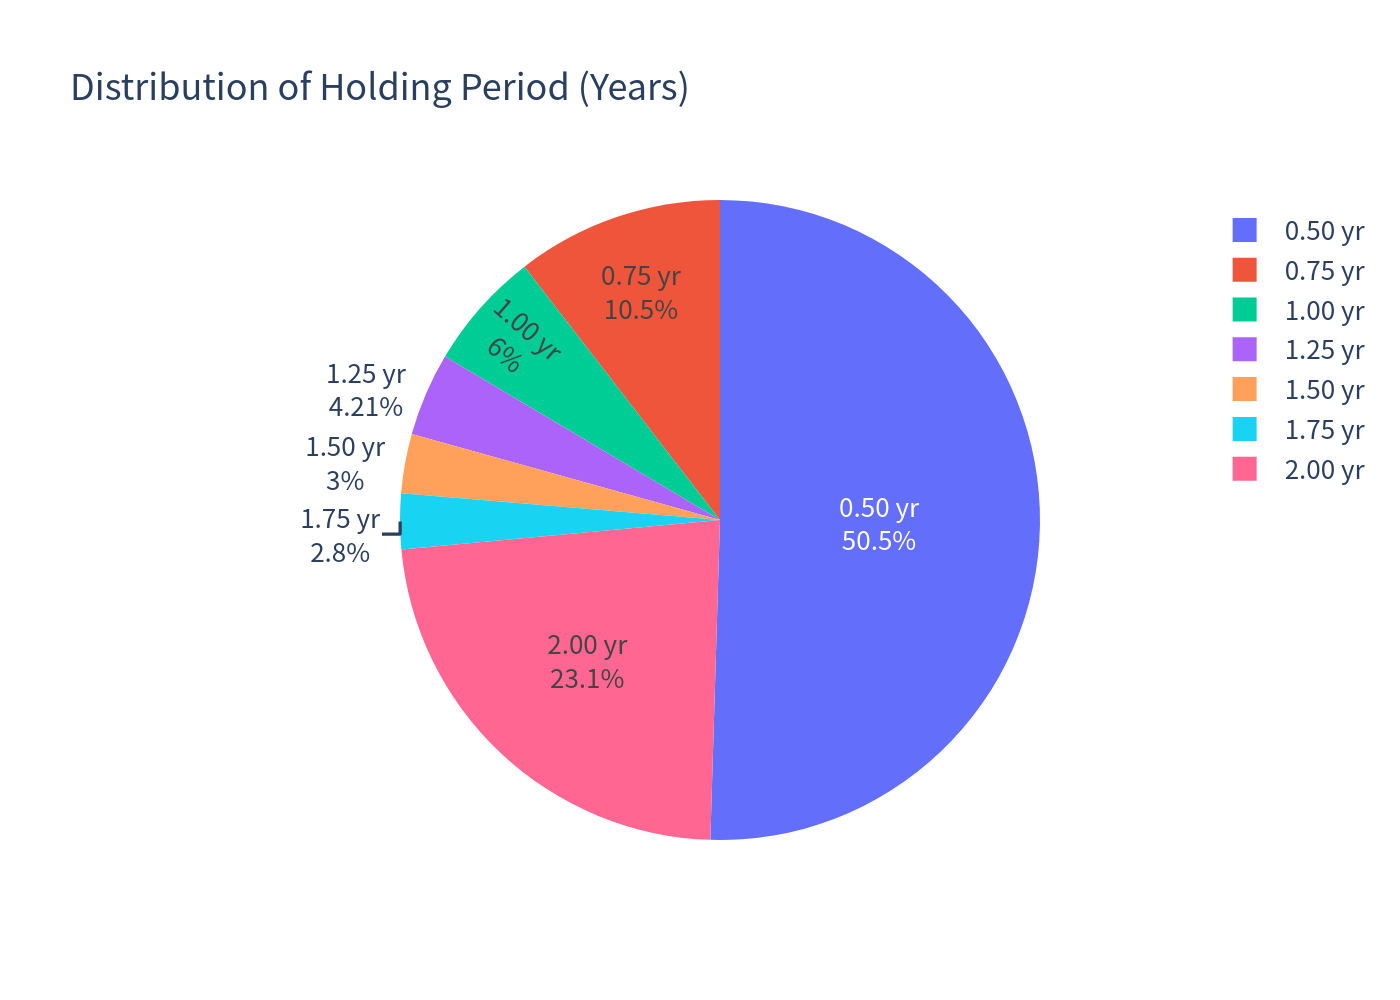
Over 10,000 path simulations, the note most often behaves like a short-dated, high-coupon bond: roughly half of all paths are called at the very first observation (≈ month 6), delivering a quick ~5.7-point coupon. The average realized total return across all paths is +4.84% over an average holding period of about 12 months.
Note the two figures use different averaging: the 7.80% is the mean of each path's own annualized return (which re-weights the many short, high-annualized early redemptions), while +4.84% is the plain average holding-period total return; they are consistent in direction but not simple conversions of each other. About 23% of paths run to maturity, and it is within this group that nearly all losses occur.
How the Note Works (plain language)
- You pay $1,000 per note. There is no participation in index upside — the best outcome is your principal back plus the coupons collected.
- Contingent coupon (~11.75%/yr, midpoint of the 11.25%–12.25% range): at each scheduled check, you receive a coupon only if all three indices are at or above 80% of their starting levels. If any index is below 80%, you get nothing for that period.
- Automatic early redemption: at each quarterly check (first at ≈ month 6), if all three indices are at or above 100% of their starting levels, the note is called — you receive your $1,000 principal plus that period's coupon, and it ends.
- At maturity (if never called):
- If all three indices finish at or above 70% of start → you get your $1,000 back (plus the final coupon if eligible).
- If any index finishes below 70% → you lose 1% of principal for every 1% the worst index is down (a full, un-cushioned loss that could approach 100%).
- The downside is driven by the worst-performing index; a decline in any single index is enough to hurt the payoff.
Key Statistics (simulated)
| Metric | Structured Product | Benchmark — same-horizon, incl. dividends | Benchmark — fixed 24-month, incl. dividends | Risk-free |
|---|---|---|---|---|
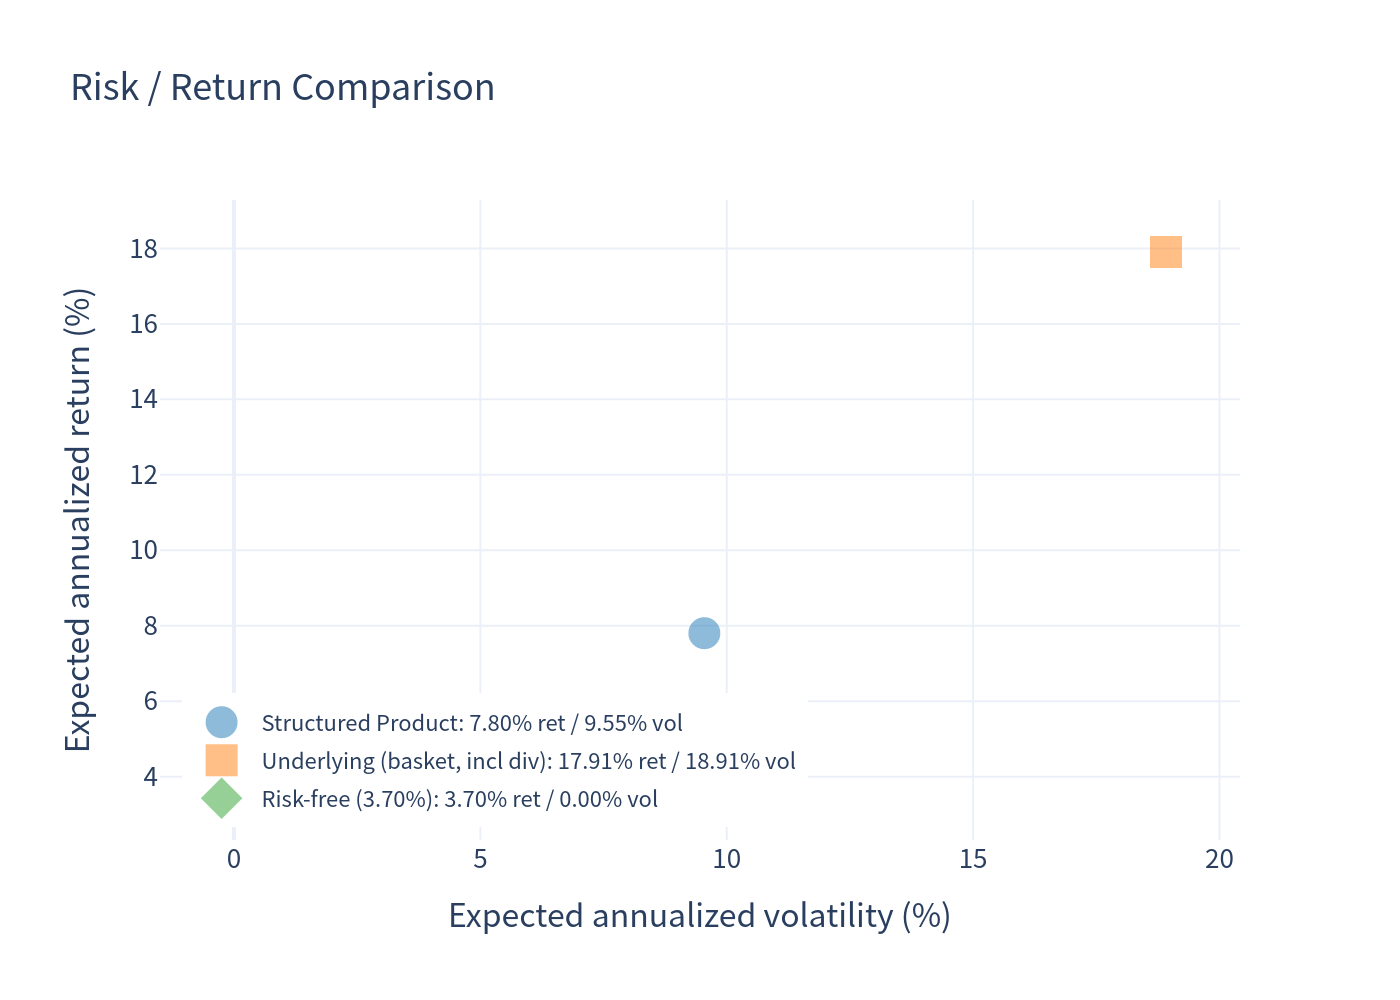
| Expected annualized return | 7.80% | 17.91% | 8.66% | 3.70% |
| Expected annualized volatility | 9.55% | 18.91% | 13.69% | 0.00% |
| Probability of loss | 8.53% | 15.14% | 25.67% | 0.00% |
| 99% VaR (1-year, 1st percentile) | −31.40% | −22.57% | −23.85% | 0.00% |
The benchmark is an equal-weight basket of the three indices (dividend yield ≈ 0.94%). Two benchmark views are shown because the note's life is path-dependent: it is terminated early precisely when the market is strong. Measuring the benchmark only over each path's (often very short) life therefore flatters it — the "same-horizon" figure (17.91%) is upward-biased by this conditioning, whereas the fixed 24-month figure (8.66% annualized, 13.69% volatility) is the fairer unconditional reference.
Simulation Charts
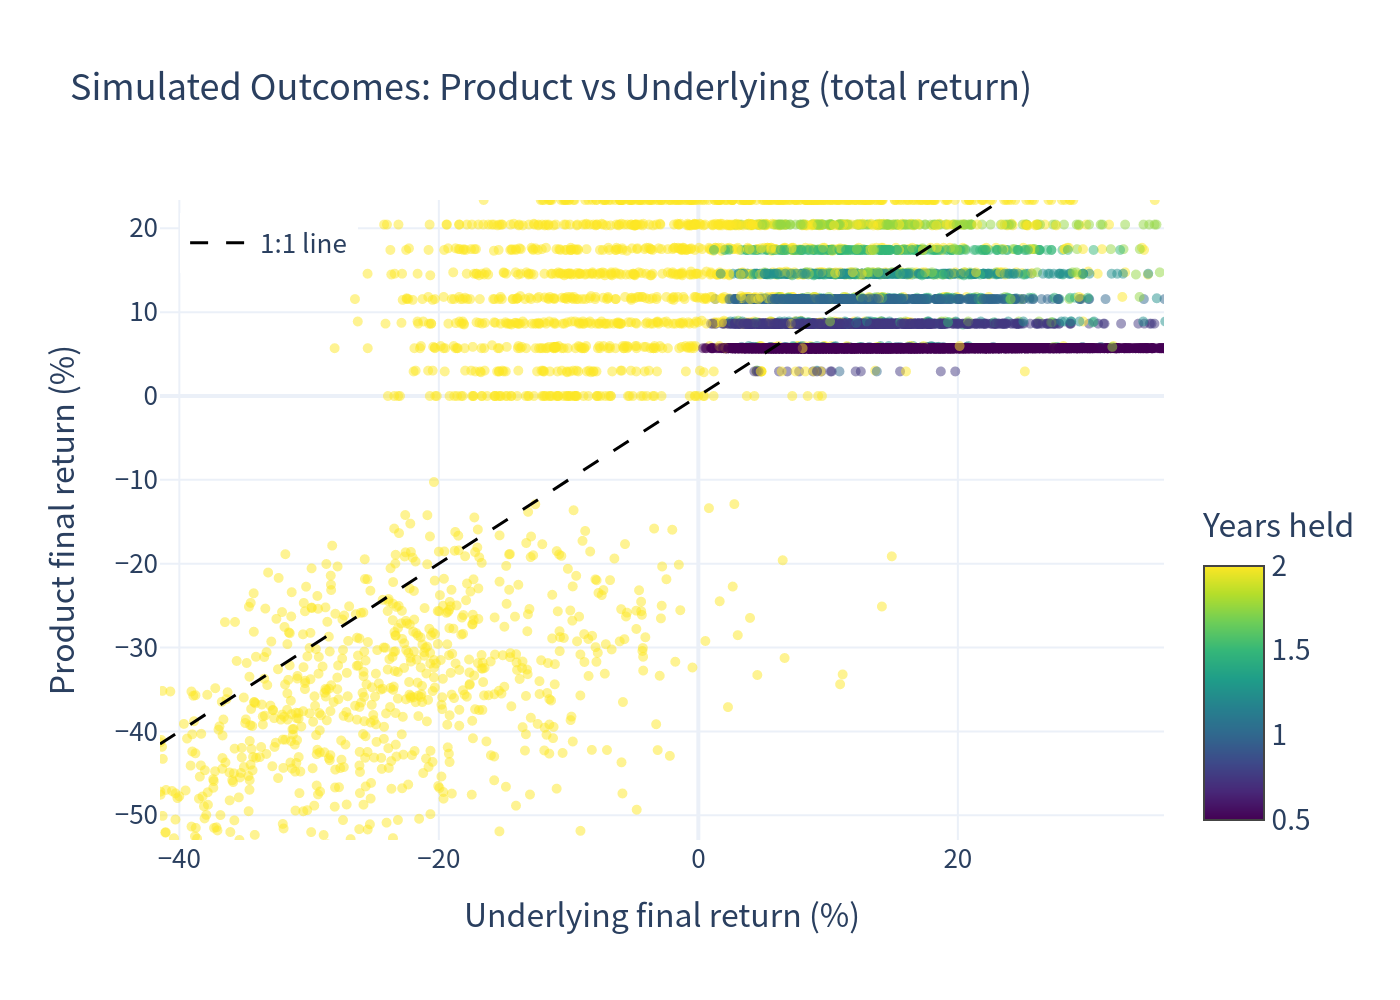
Outcome scatter — each dot is one simulation (color = years held)
Points below the dashed 1:1 line mean the note underperformed the underlying; the flat cluster near y ≈ +4% to +6% (right side of the chart) captures the many early-called paths that return principal + coupon while the index kept rising.
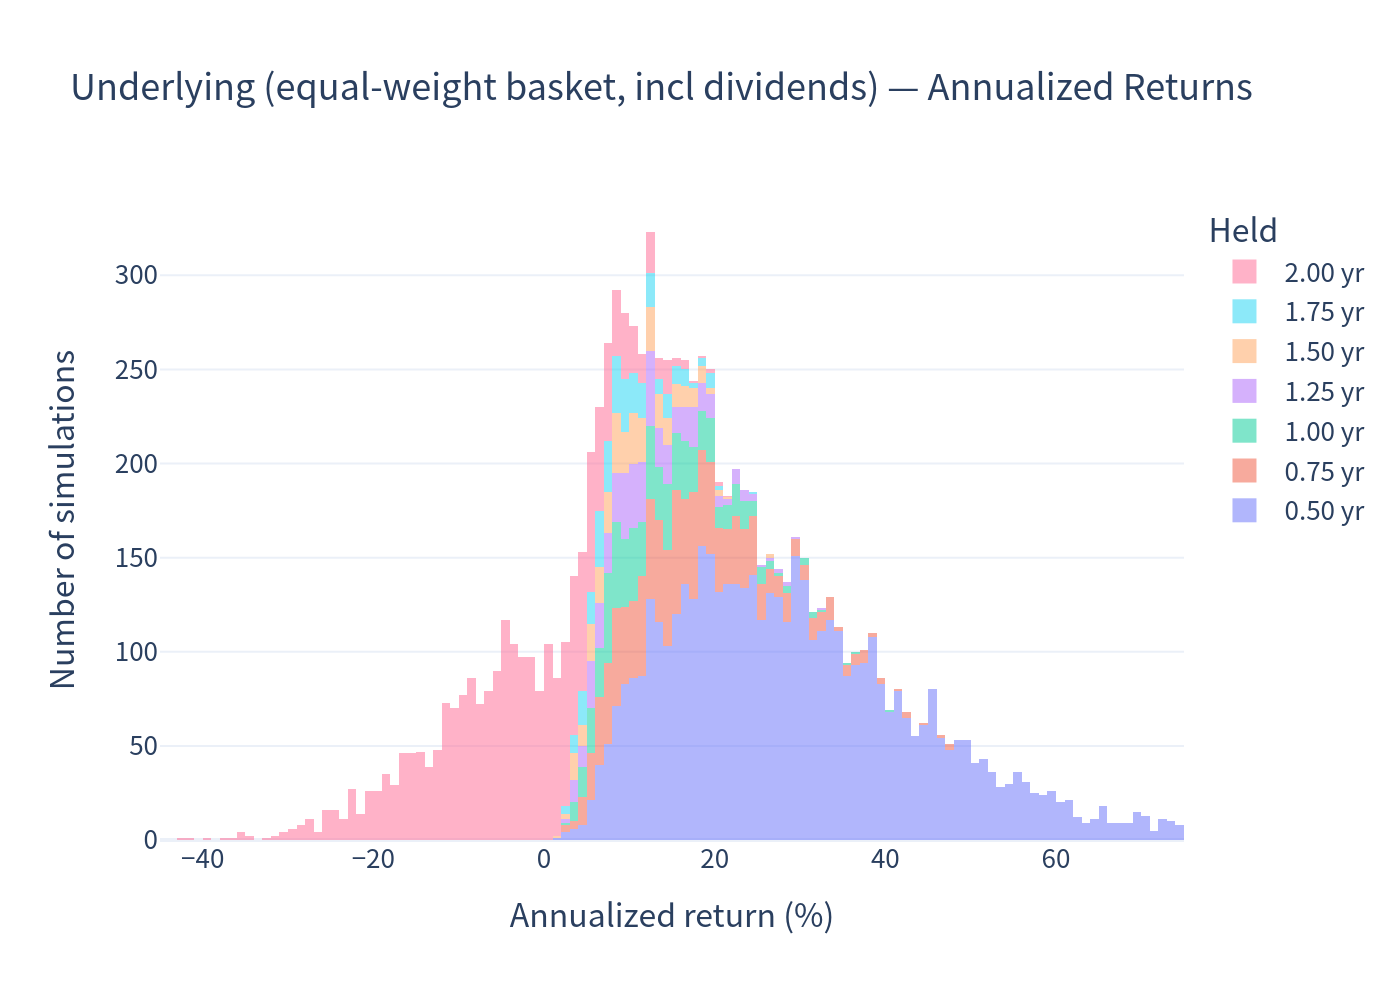
Distribution of the underlying basket's annualized returns
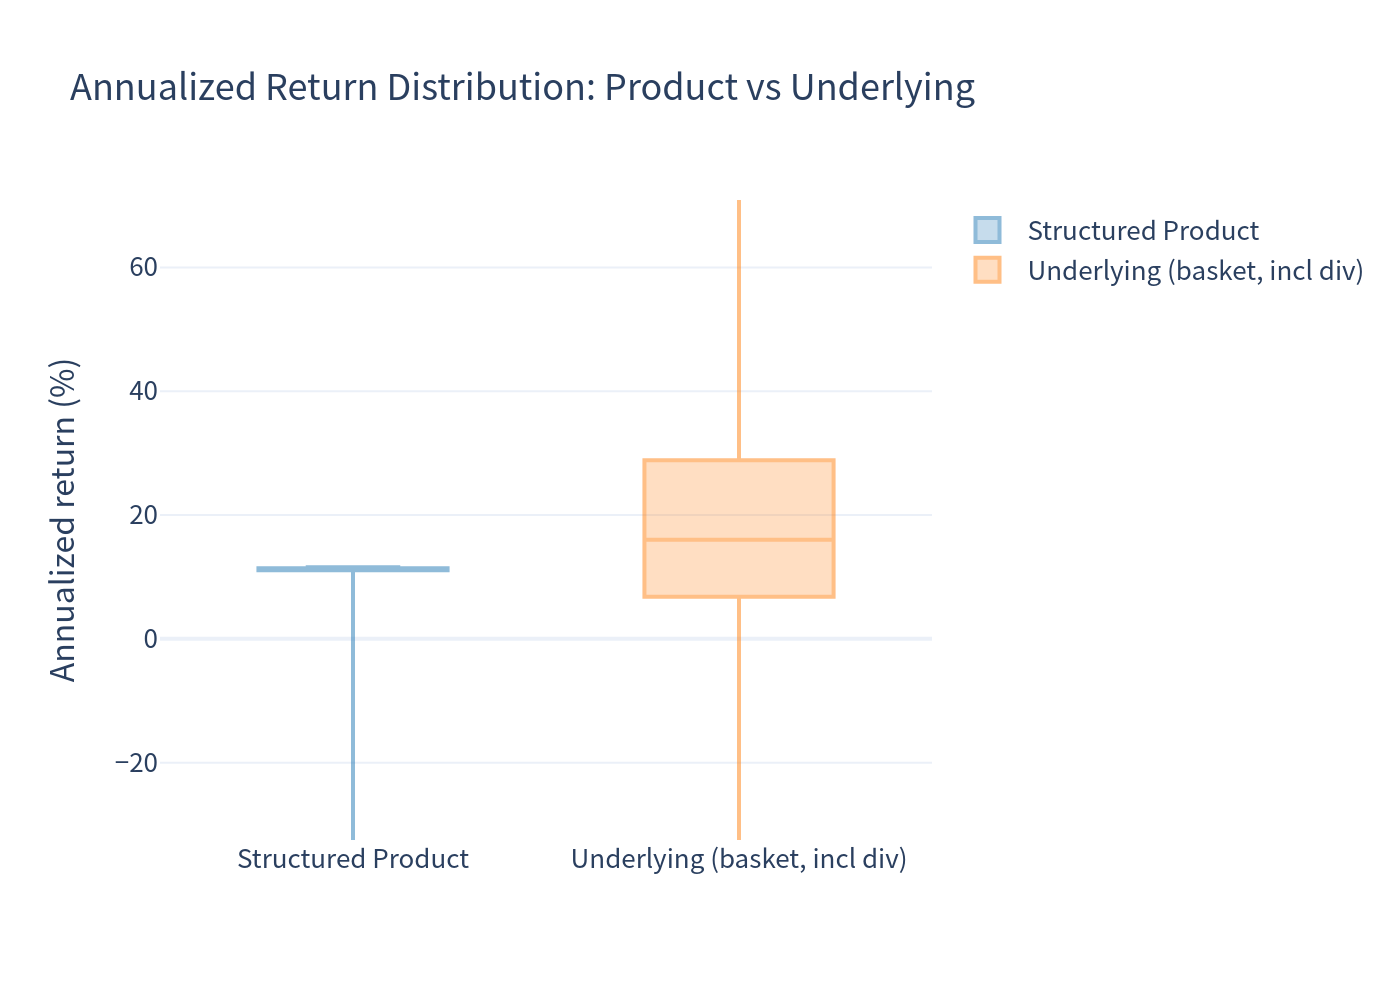
Stacked by holding period. The very long right tail comes from short, strongly up paths being annualized.
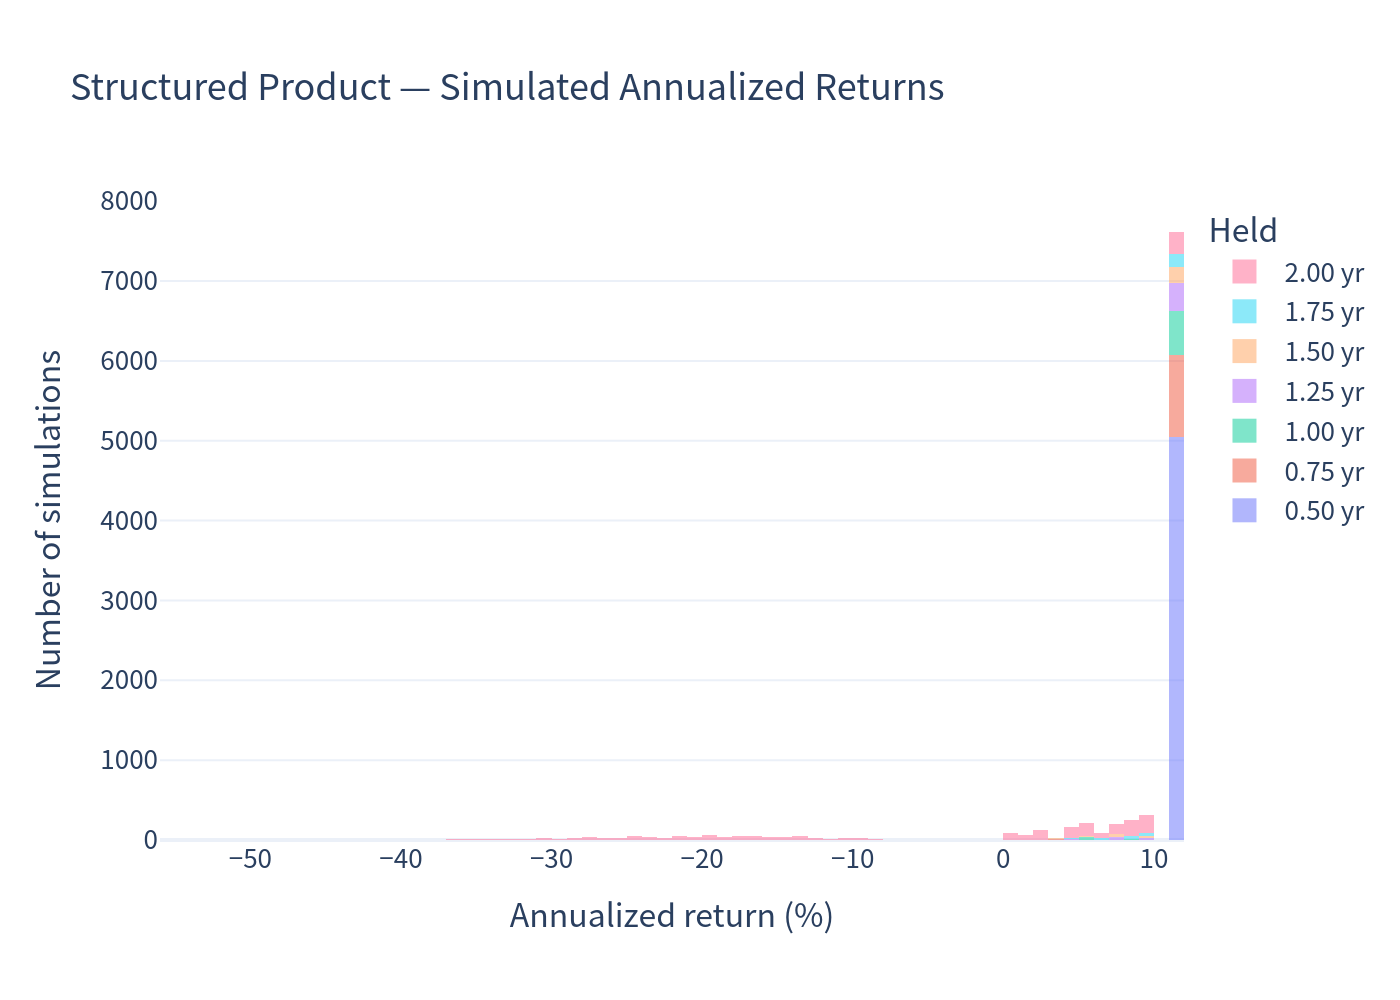
Distribution of the structured product's annualized returns
The distribution is tightly clustered with a hard ceiling (upside cap) and a long left tail (maturity principal loss).
Scenario probabilities for the product
Risk / return comparison
Annualized-return box plots — product vs underlying basket
Holding-period distribution
Probability of redemption at each check.
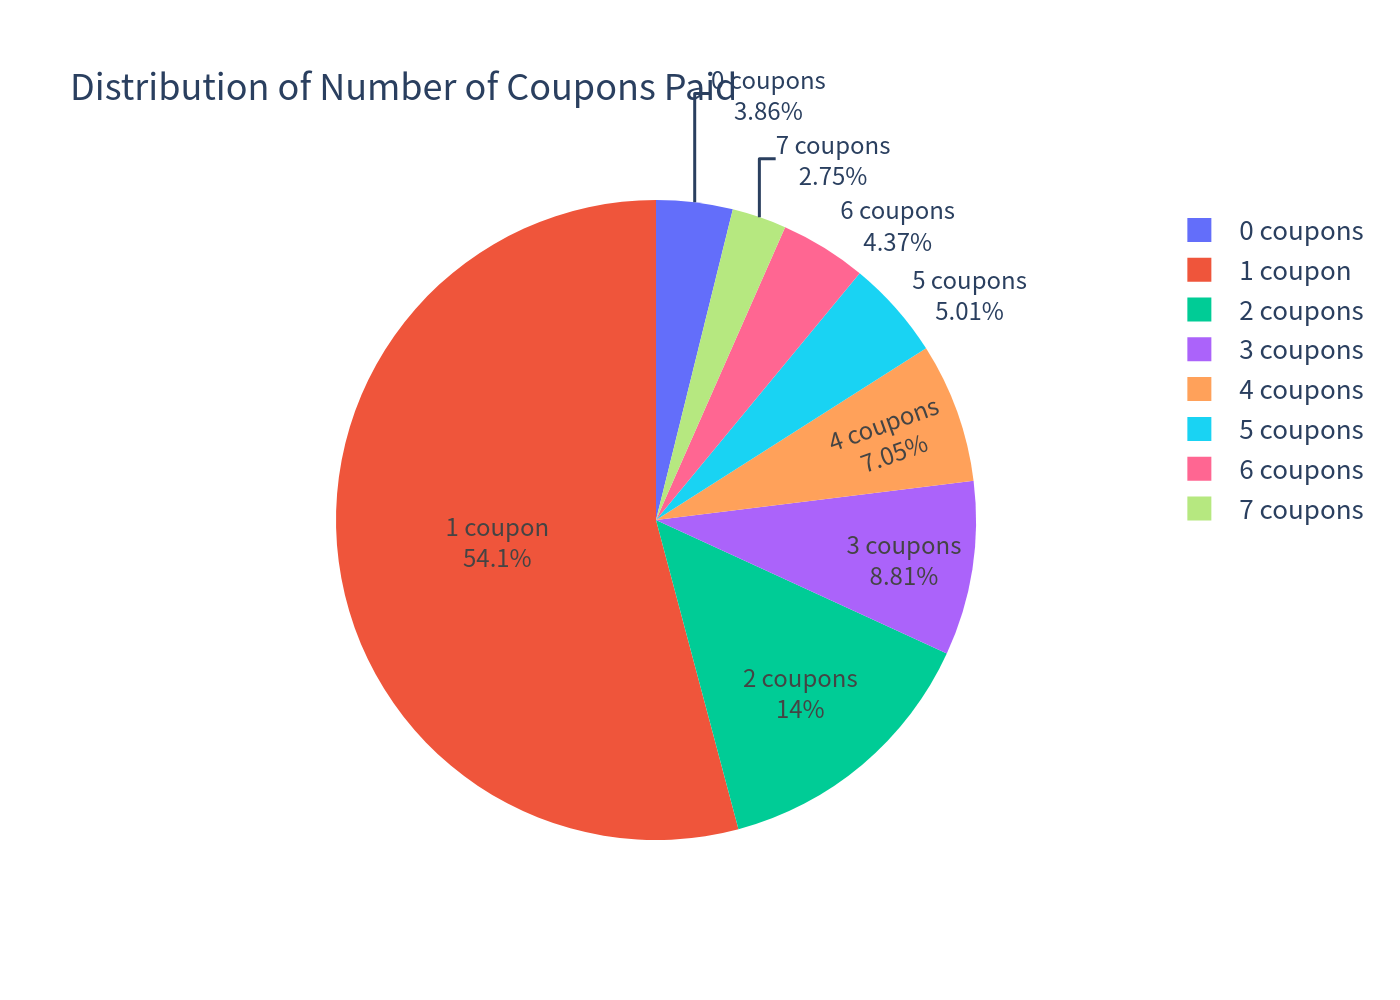
Number of coupons paid
Distribution.
Investment Commentary
Points to weigh
- Upside is capped. You never participate in index gains. In strong rallies (the scenario in which the note is called quickly) you collect only coupons, materially trailing a rising market — visible as the scatter points hugging the low, flat band while the underlying climbs.
- Worst-of concentration. The payoff hinges on whichever of the Dow, Nasdaq-100 Tech, or Russell 2000 does worst. The high-volatility tech index (NDXT) dominates this risk and can single-handedly trigger missed coupons and principal loss.
- Principal at risk with no downside cushion past the barrier. There is no coupon and a 1:1 principal loss when the worst index finishes below 70%. This is why the 99% VaR is −31.40% — the loss tail is actually worse than the plain basket (−22.6% to −23.9%), even though losses are less frequent.
- Discrete observation only. Coupon and downside triggers are tested only on scheduled dates, so intra-period drawdowns can be missed — helpful for avoiding a trigger, but it also means an end-of-period dip is what matters.
- Credit and structure risk: payments depend on Morgan Stanley's creditworthiness; the note is unsecured and not principal-protected.
Favorable points