
15.00% p.a. Multi Barrier Reverse Convertible on Burkhalter Holding, Implenia & R&S Group (Worst-of)
Issuer: Leonteq Securities AG · ISIN CH1593784551 · SIX: AHTOTQ · Denomination CHF 1,000 · Settlement CHF · Issue 22 Sep 2026 · Final Fixing 16 Sep 2027
Headline simulation results
Based on 10,000 Monte-Carlo scenarios over the one-year term:
| Metric | Value |
|---|---|
| Expected annualized return | 8.39% |
| Median annualized return | 15.00% |
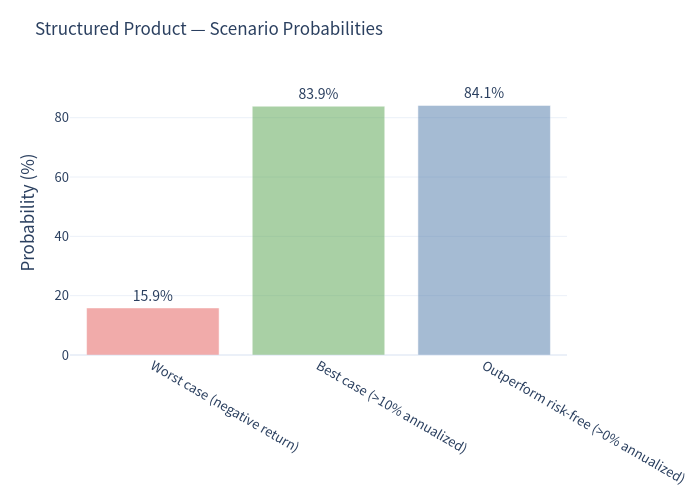
| Probability of a negative return | 15.87% |
| 99% confidence VaR (1 year) | −41.56% |
| Probability of beating the CHF risk-free rate (≈ 0%) | 84.13% |
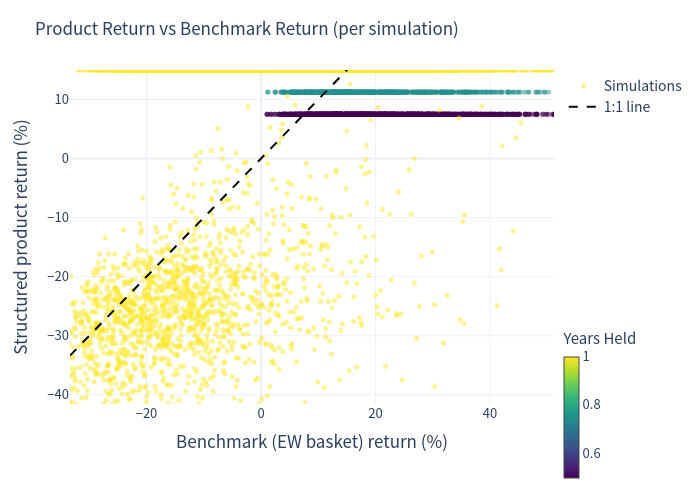
| Probability of beating the equal-weighted share basket (total return) | 47.40% |
| Expected holding period | 10.63 months (≈ 0.89 yr) |
| Expected total return over the realized holding period | 6.68% |
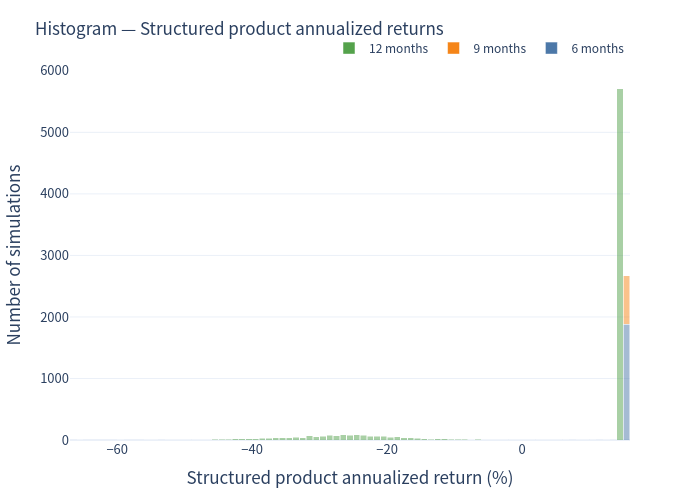
The return profile is strongly bimodal: in about 84% of paths the investor collects the full coupon and earns roughly the 15% headline rate (annualized), while in about 16% of paths the barrier is breached and the outcome turns negative. Conditioning on a barrier breach, the average total return is about −25%, and the worst simulated outcome is −65.56%. Because the coupon is only 15% but the downside past the barrier is uncapped, the mean (8.39%) sits well below the median (15.00%).
What the product is, and how it works (plain language)
You lend CHF 1,000 for about a year and are paid a 15.00% annual coupon (CHF 37.50 per CHF 1,000 each quarter) regardless of how the three shares move — provided the note is still alive.
Three Swiss shares are referenced — Burkhalter Holding, Implenia and R&S Group — and the payoff is driven by the worst performer (the share that finishes lowest relative to its starting level):
- Downside buffer (barrier at 59%). If none of the three shares ever trades at or below 59% of its starting level during the year (monitored continuously), you get your full CHF 1,000 back at maturity plus all four coupons ≈ 15%.
- If the barrier is touched at any time by any one of the shares, the protection is lost:
- if the worst performer nevertheless finishes at or above its starting level → you still receive CHF 1,000 back (plus coupons);
- if the worst performer finishes below its starting level → you receive that share’s final value (you take the full downside of the worst performer) plus the coupons. Note the loss is not floored at 59% — it tracks the worst performer’s final level.
- Issuer callable. The issuer may redeem early on two observation dates (Mar-2027 and Jun-2027); if called you receive par plus that quarter’s coupon and the note ends. In this analysis the note is assumed to be called whenever the worst performer is at or above its starting level.
The upside is capped at the coupon; there is no participation if the shares rally.
Key statistics
| Strategy | Expected annualized return | Annualized volatility | Probability of loss | 99% VaR (1 yr) |
|---|---|---|---|---|
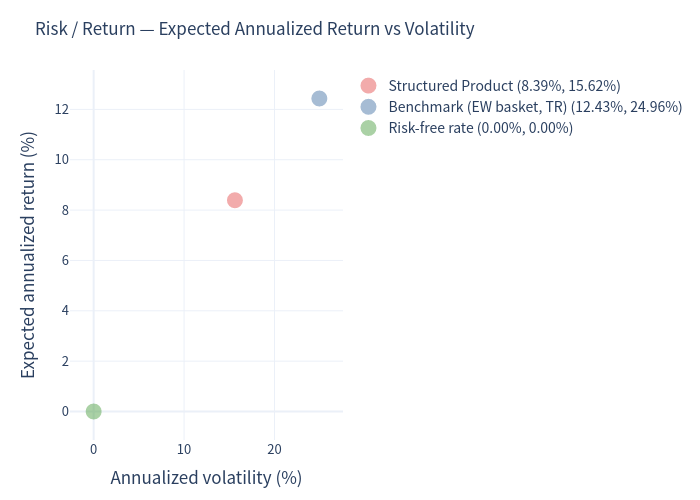
| Structured product | 8.39% | 15.62% | 15.87% | −41.56% |
| Benchmark – equal-weighted basket (price return) | 9.31% | 24.96% | 39.87% | −33.37% |
| Benchmark – equal-weighted basket (total return, incl. dividends) | 12.43% | 24.96% | 34.27% | −30.24% |
The equal-weighted basket of the three shares carries roughly 25% annualized volatility and a ~35–40% probability of a loss. The structured product delivers a much tighter day-to-day experience (≈ 16% vol) and a far lower chance of any loss (≈ 16%) — but when it does lose, the loss is deeper: its 1-year 99% VaR (−41.56%) is worse than the basket’s.
Other simulation results
- Continuous barrier-hit probability: 16.47%
- Outcome split: 18.82% redeemed at 6 months, 7.91% at 9 months, 73.27% held to maturity
- Equal-weighted basket dividend yield ≈ 3.12% p.a.
Simulation charts
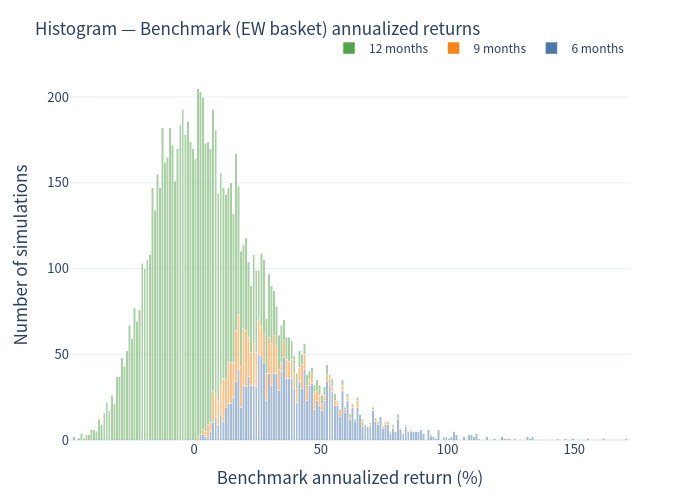
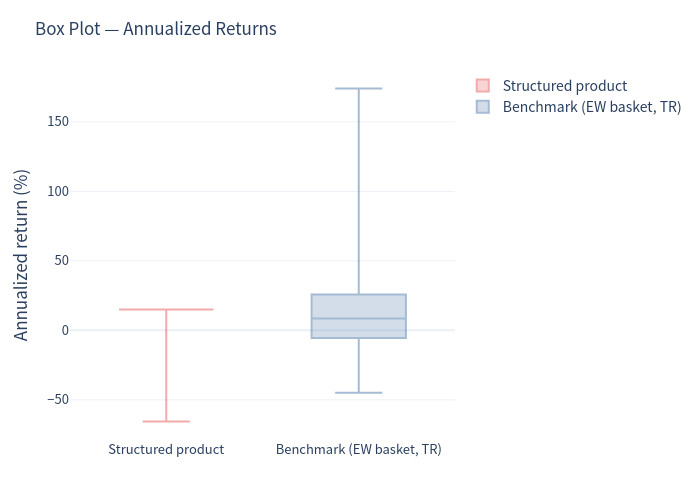
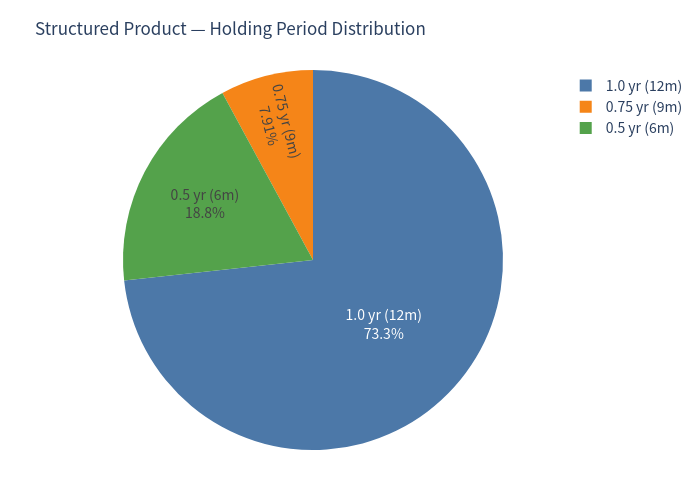
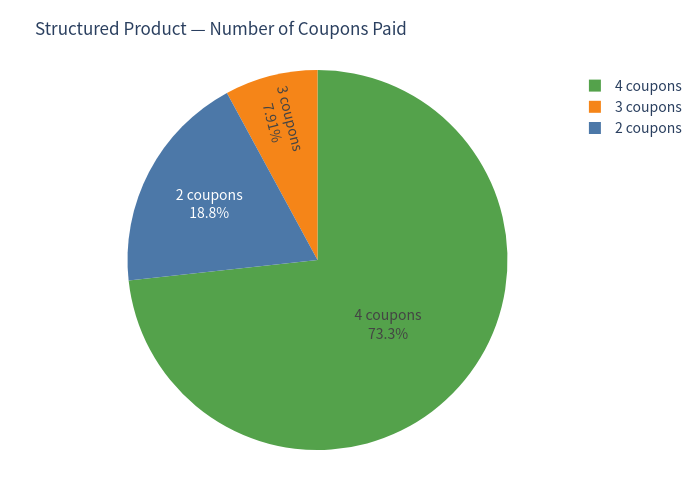
Investment commentary
Points in favour
- A 15.00% headline coupon is materially above the prevailing CHF money-market rate (≈ 0%), and the coupon is paid even if the shares fall, as long as the note is alive.
- The 59% barrier gives a wide ~41% cushion; the protection is only lost if a share actually trades down through that level.
- Realised volatility (≈ 16%) is much lower than owning the three shares outright (≈ 25%), because coupons dominate the payoff in the common case.
- In ~84% of scenarios the investor earns around the full coupon, and the outcome beats the risk-free rate about 84% of the time.
Points to watch
- Upside is capped at the coupon; a strong rally in the three shares is not captured (the issuer’s call further truncates the trade).
- The reference is the worst of three high-volatility Swiss mid-caps — an adverse “min-of-three” effect drives the worst performer materially below the basket average.
- Past the barrier, downside is not floored at 59%: the investor takes the worst performer’s full loss, producing negative skew and a 99% VaR that is worse than the underlying basket.
- The result is bimodal — most of the time a steady ~15%, occasionally a large loss — so the mean return (8.39%) is much lower than the median (15.00%).
Interpretation note. Because the expected holding period is only ~10.6 months, annualized figures for early-redeemed paths are scaled from short holding periods and can look high; the total-return-over-holding-period figure (6.68% expected) and the holding period should be read together with the annualized number.