
8.00% p.a. Multi Barrier Reverse Convertible on Allianz, AXA, Generali (Quanto CHF)
Headline Simulation Results
| Metric | Structured Product | Underlying basket (equal-weight, +div) |
|---|---|---|
| Expected annualized return | 3.52% | 9.29% (buy & hold 21M) |
| Probability of a negative return | 18.96% | 29.04% |
| 99% confidence VaR (1-year) | −29.64% | −28.95% |
| Expected annualized volatility | 9.67% | 16.93% |
| Expected holding period | 12.7 months | — |
- The note pays 8.00% p.a. but its expected annualized return is only 3.52%: roughly four times in five the investor collects coupons and their capital back, but in about one in five simulations the barrier breaks and the worst-performing insurer drags the redemption well below par.
- ~81% of paths beat CHF cash (currently ≈ 0%). The median outcome is ≈ 8% annualized, delivered through an early call or a full-coupon maturity.
- The left tail is the key risk: the 1st-percentile (VaR 99%) annualized return is −29.64%, i.e., a bad outcome can erase roughly a third of capital on an annualized basis even after coupons.
Reading the numbers: the underlying's matched-horizon figures (measured over each simulation's realized holding period) show a higher 18.68% expected annualized return, but that number is upward-biased because early calls only happen when all three shares are already above their starting levels. The buy & hold 21-month figure (9.29%, ±16.9% vol) is the more representative "what a standalone basket investment would earn" benchmark and is used throughout this report as the primary underlying reference.
How the Product Works
- You invest CHF 1,000 (100%) for up to 21 months (to 21/07/2028).
- You receive 8.00% p.a. paid quarterly — CHF 20.00 per quarter, 7 payments (CHF 140 total) if held to maturity — regardless of how the shares perform.
- Downside protection: as long as Allianz, AXA and Generali all stay above 65% of their starting level at all times (continuously), you get your full CHF 1,000 back at maturity, plus coupons.
- Barrier breach (worst-of): if any one of the three drops to or below 65% at any moment, protection is lost. At maturity:
- if the worst performer is back at or above its starting level → you still receive CHF 1,000;
- if the worst performer finishes below its starting level → you receive that share's performance (you bear its decline).
- Issuer call: the issuer may redeem early on scheduled quarterly dates (from month 6). If called, you receive CHF 1,000 + that period's coupon and the note ends.
- Quanto CHF: EUR/CHF moves do not affect your payout.
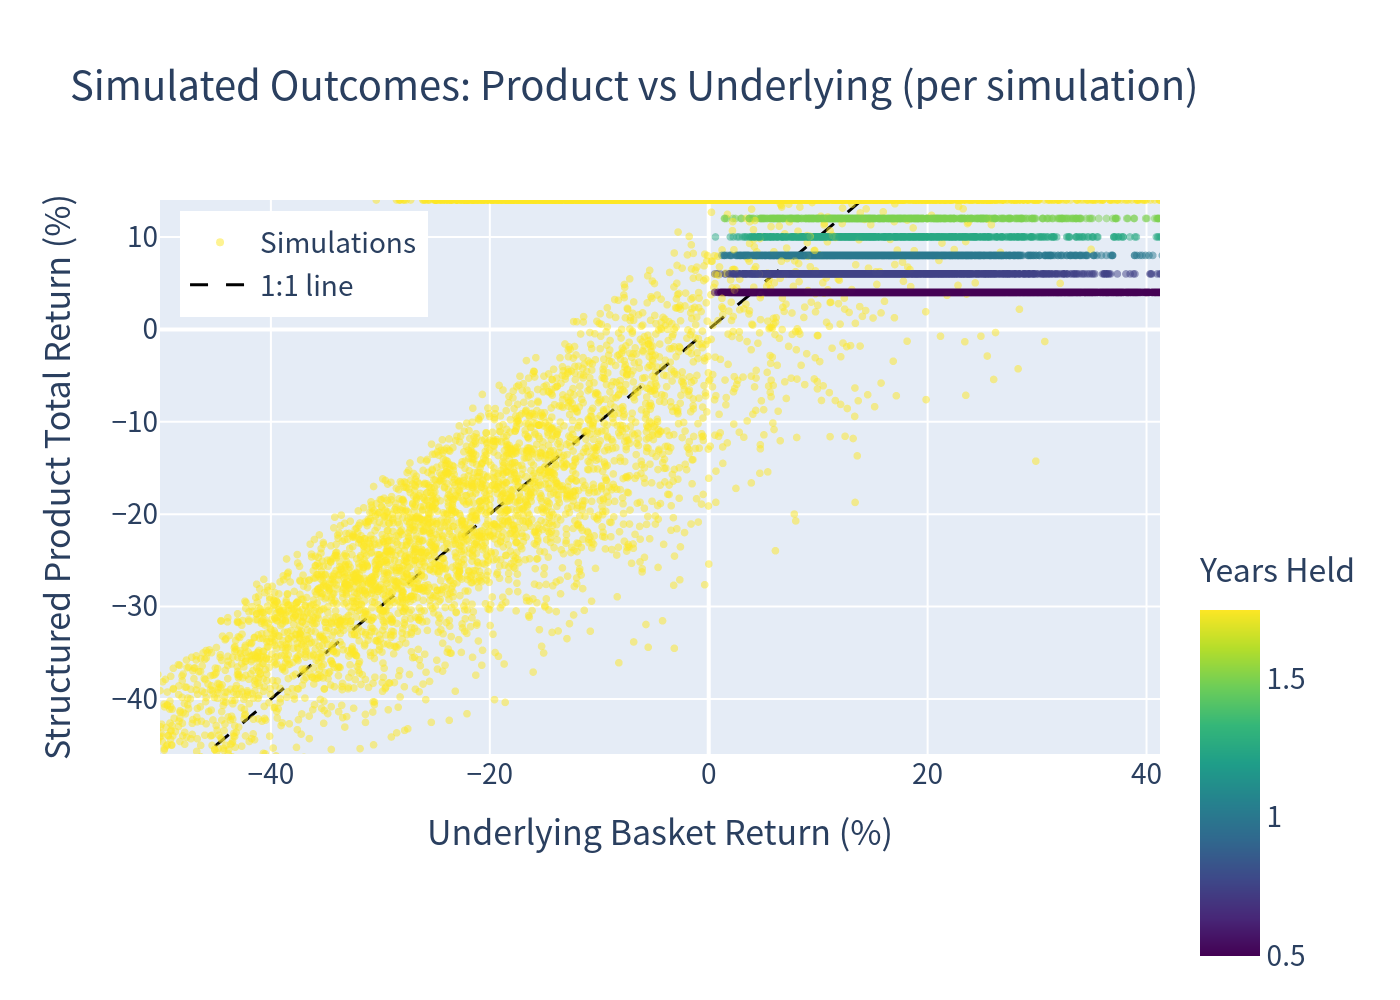
Each dot is one simulation. The product (y-axis, total return incl. coupons) caps upside at roughly 4–14% while sharing much of the downside: below a basket return of about −35% (the worst-of barrier zone) the product can fall to −45% or worse.
Key Statistics
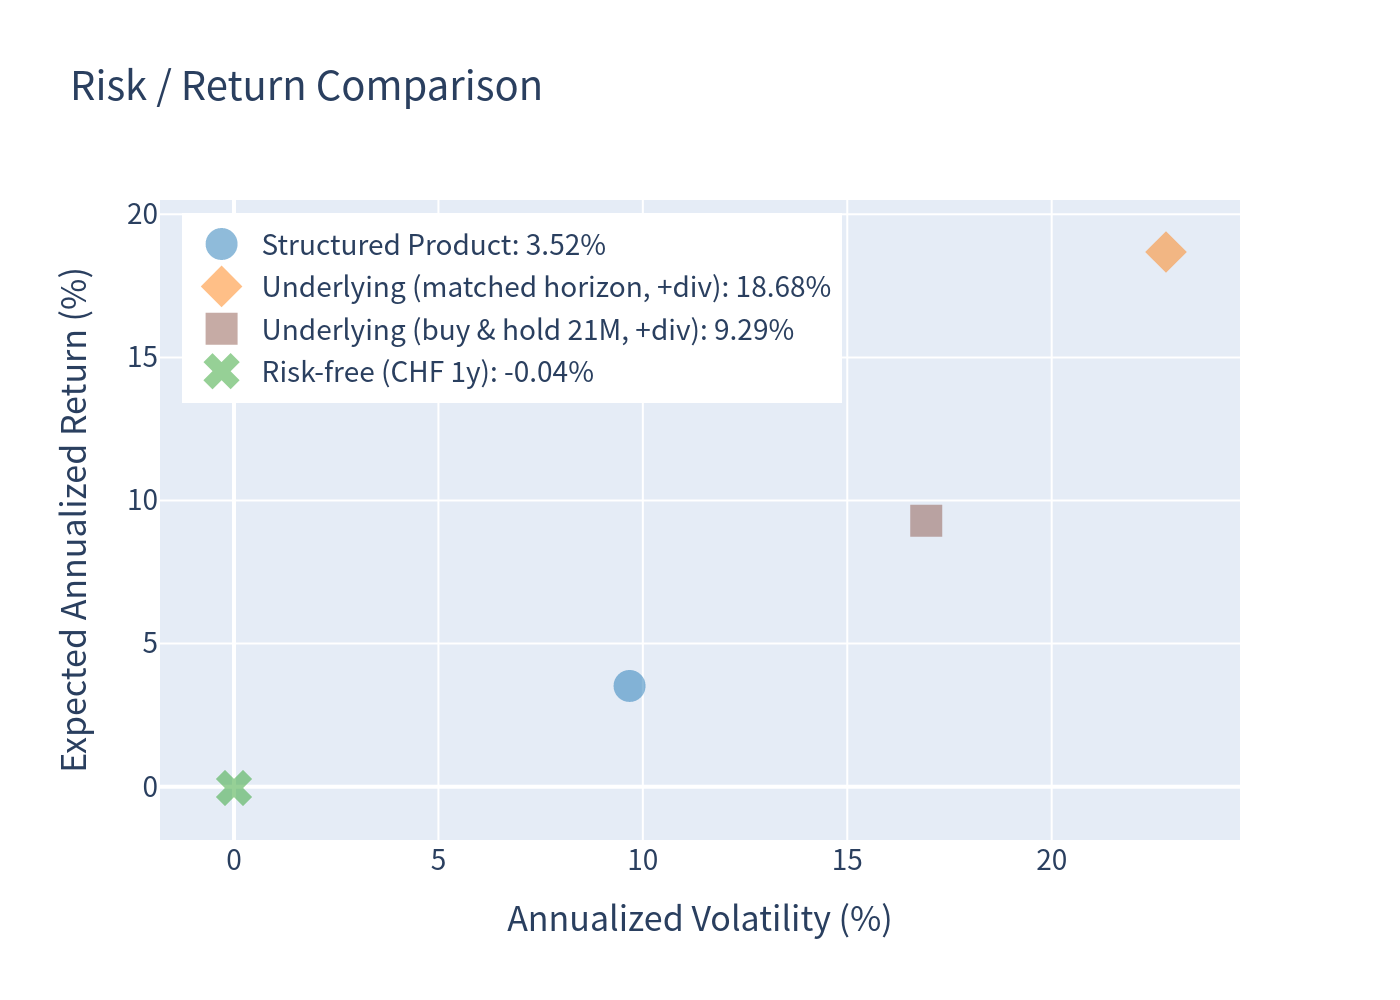
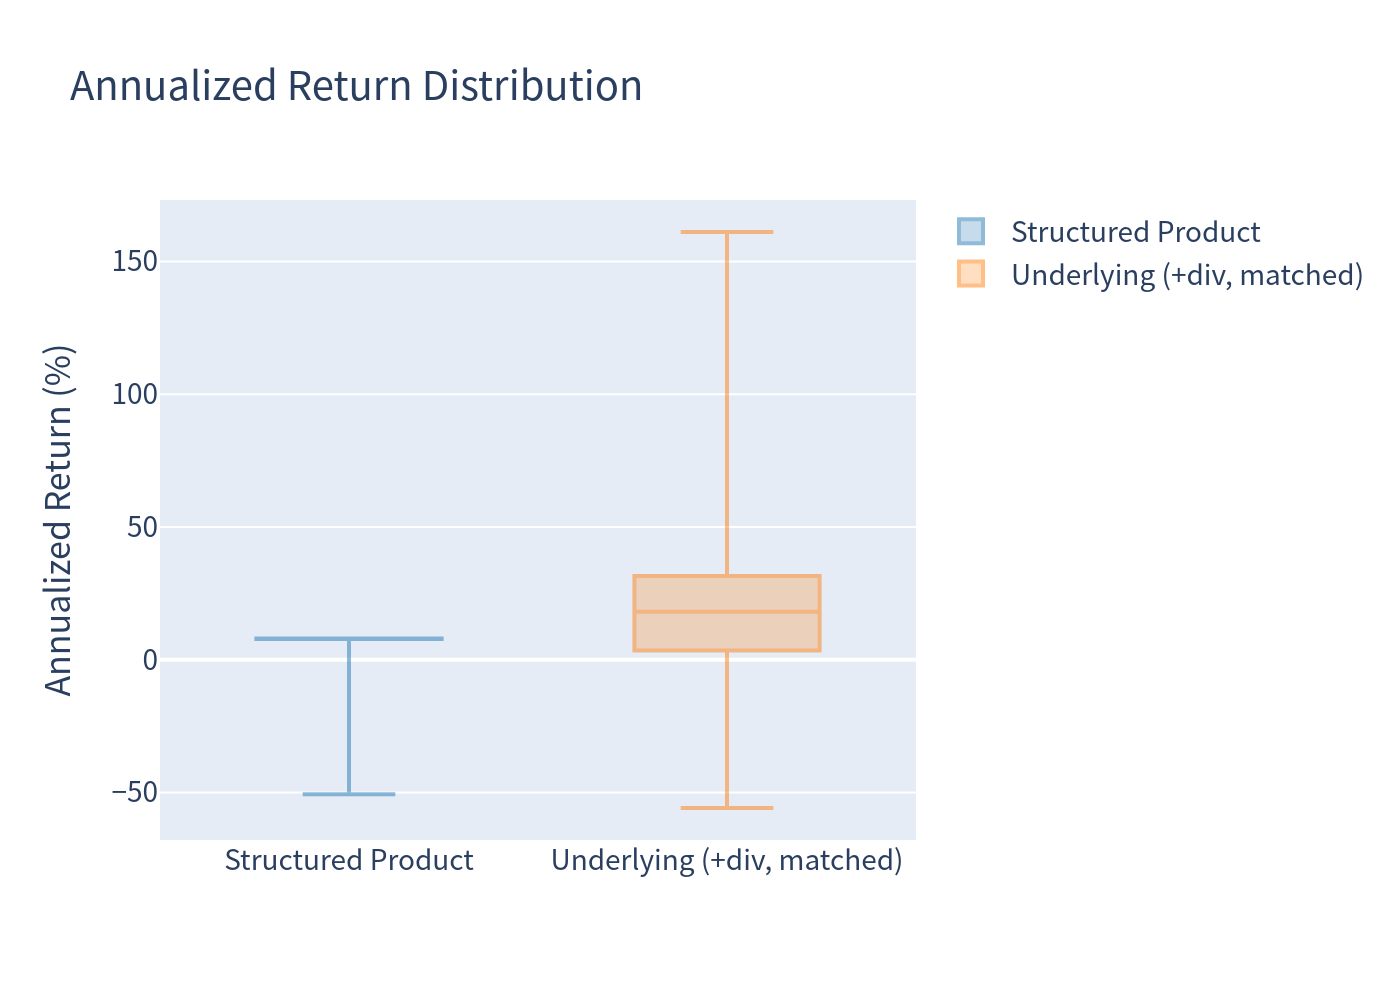
The product sits far to the left: much lower volatility (~9.7%) than the basket (~17%), but also a much lower expected return. It improves the return-versus-cash trade-off but sacrifices most of the equity upside.
| Series | Exp. ann. return | Ann. volatility | Prob. of loss | 99% VaR (1y) |
|---|---|---|---|---|
| Structured Product | 3.52% | 9.67% | 18.96% | −29.64% |
| Underlying basket (buy & hold, +div) | 9.29% | 16.93% | 29.04% | −28.95% |
| Underlying basket (matched horizon, +div) | 18.68% | 22.80% | 20.95% | −28.42% |
Return Distribution — Structured Product
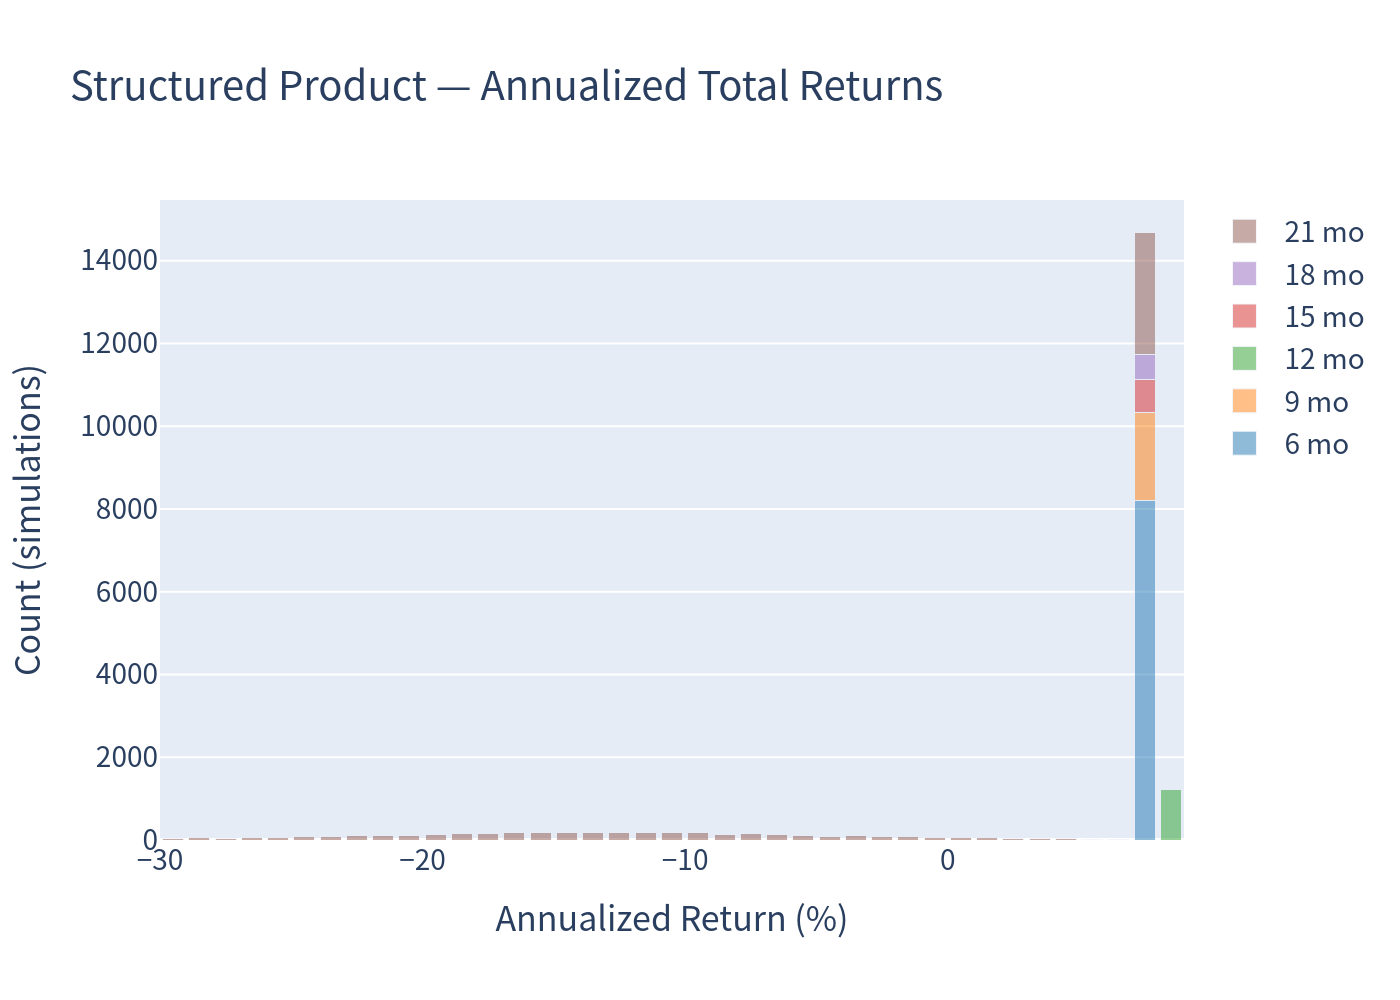
Stacked by holding period. Most paths cluster at ≈ +8% annualized (early call, 6-month exits dominate) or ≈ +7.7% (full-coupon maturity). The lower bar cluster is the barrier-loss tail, spanning roughly −30% to −50% annualized.
Return Distribution — Underlying Basket
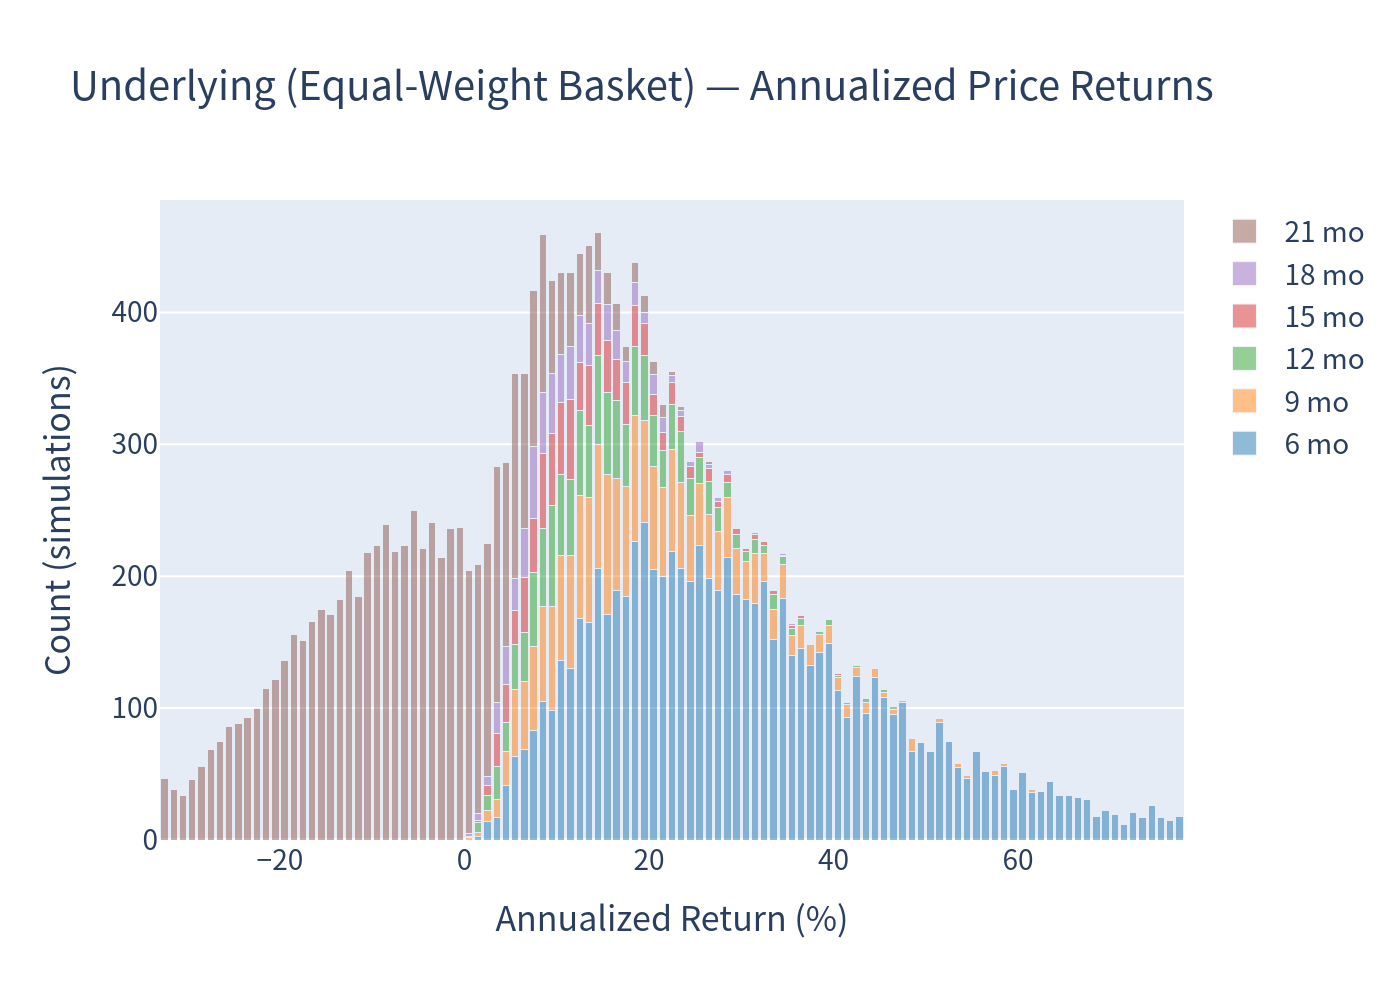
Wide, right-skewed: the basket's annualized return ranges from about −30% to +75%, with short-holding-period paths (stacked colours) producing the extreme high annualized values.
Scenario Probabilities
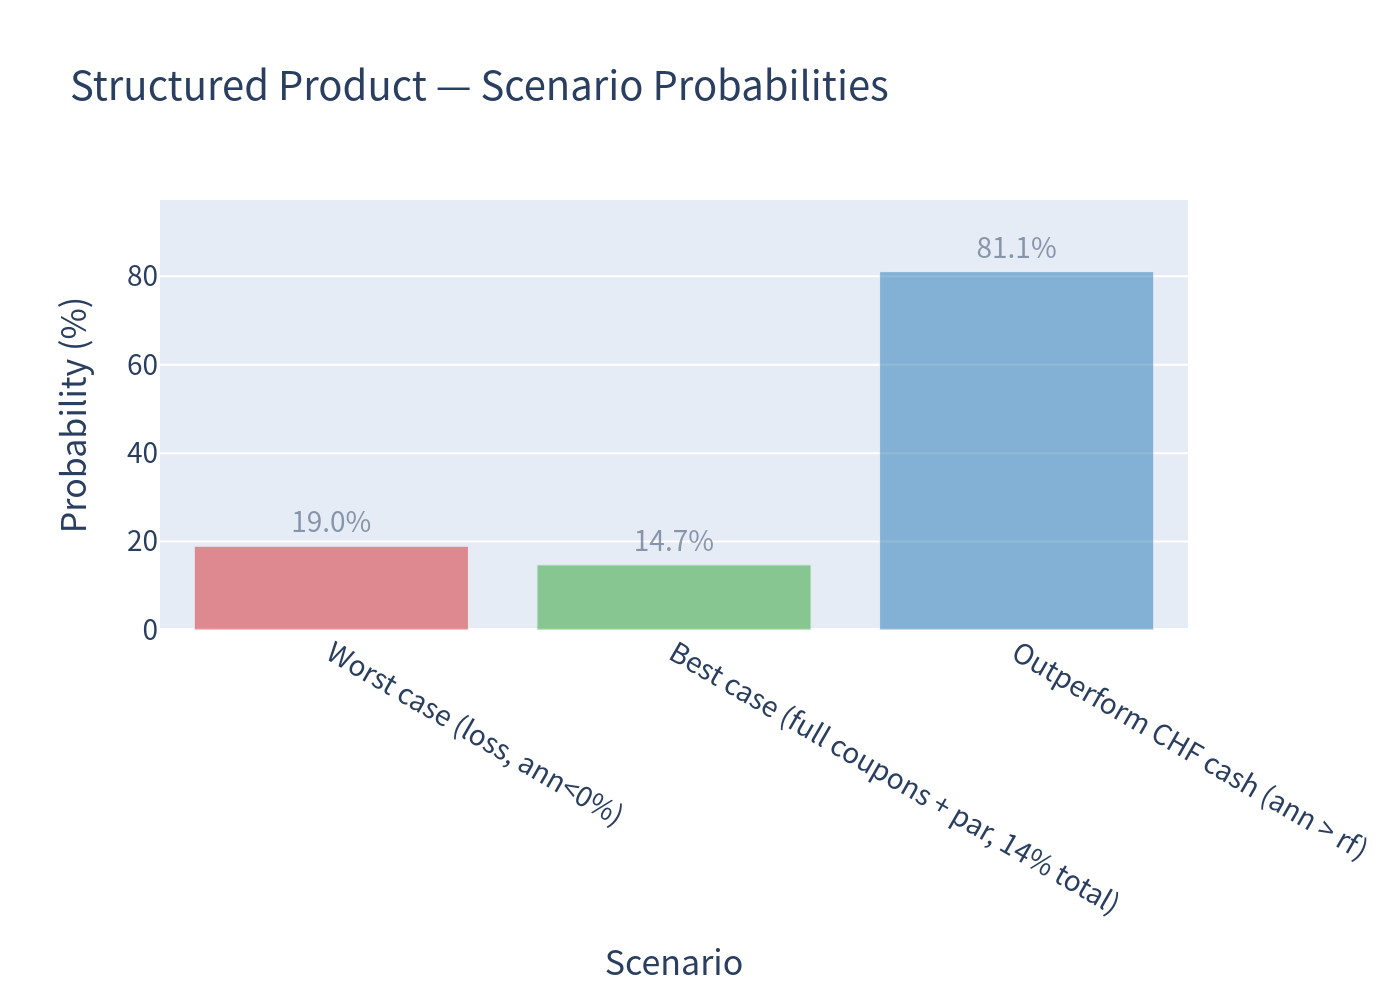
- Worst case — capital loss: 18.96% chance of a negative annualized return (barrier breached and the worst insurer finishes deeply below its start).
- Best case — full outcome: 14.74% chance of the maximum result (all 7 coupons + par, i.e. +14% total), achieved when the note is held to maturity with no barrier loss.
- Outperform CHF cash: 81.06% of paths beat cash, the product's central appeal.
Holding Period & Coupon Outcomes
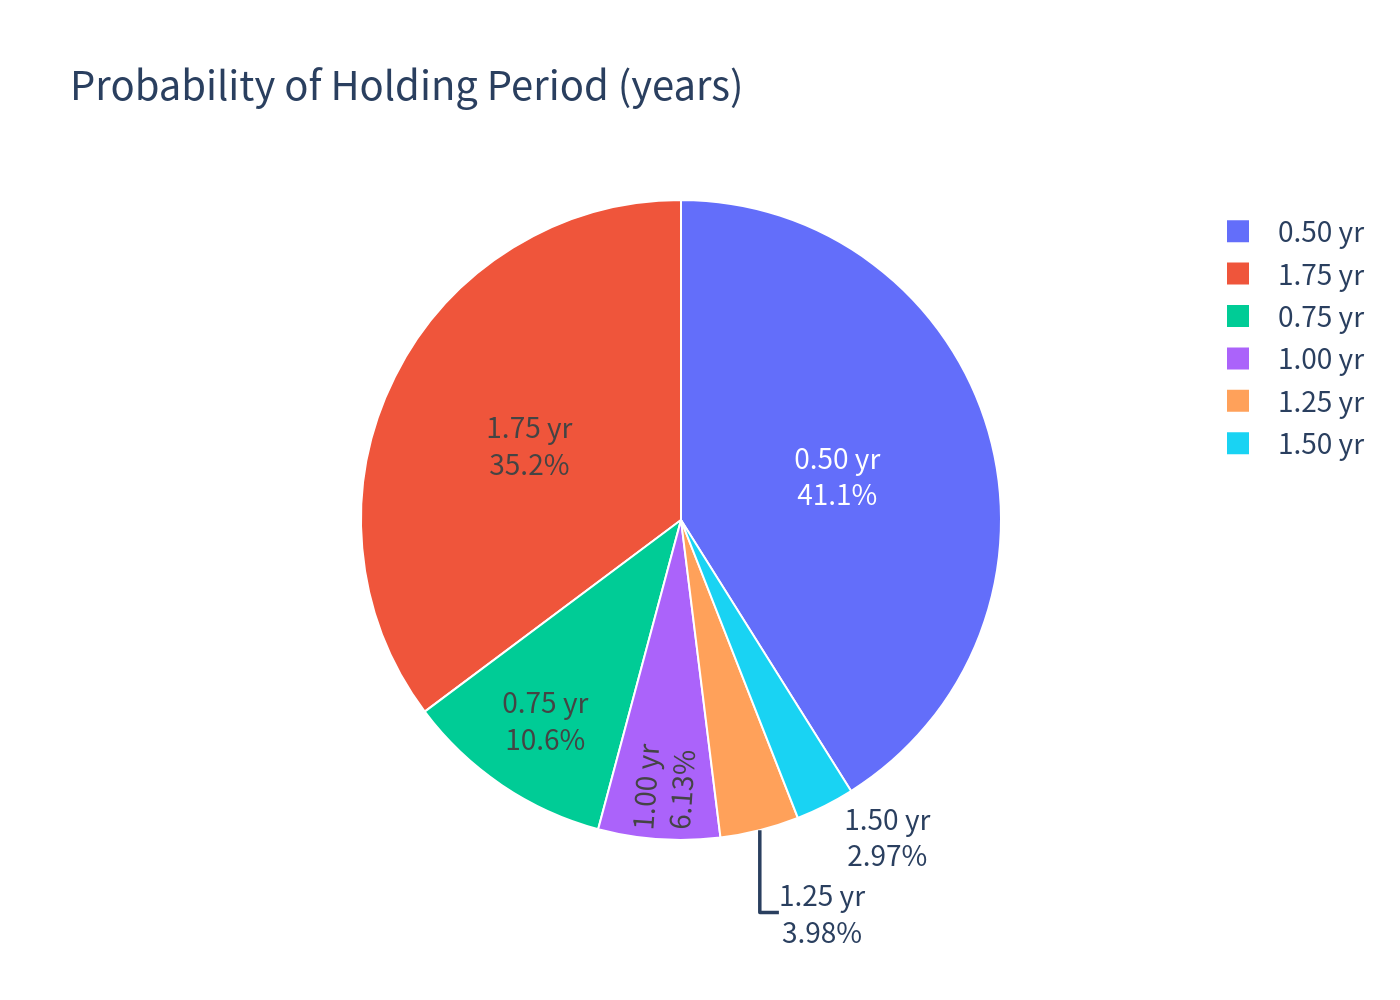
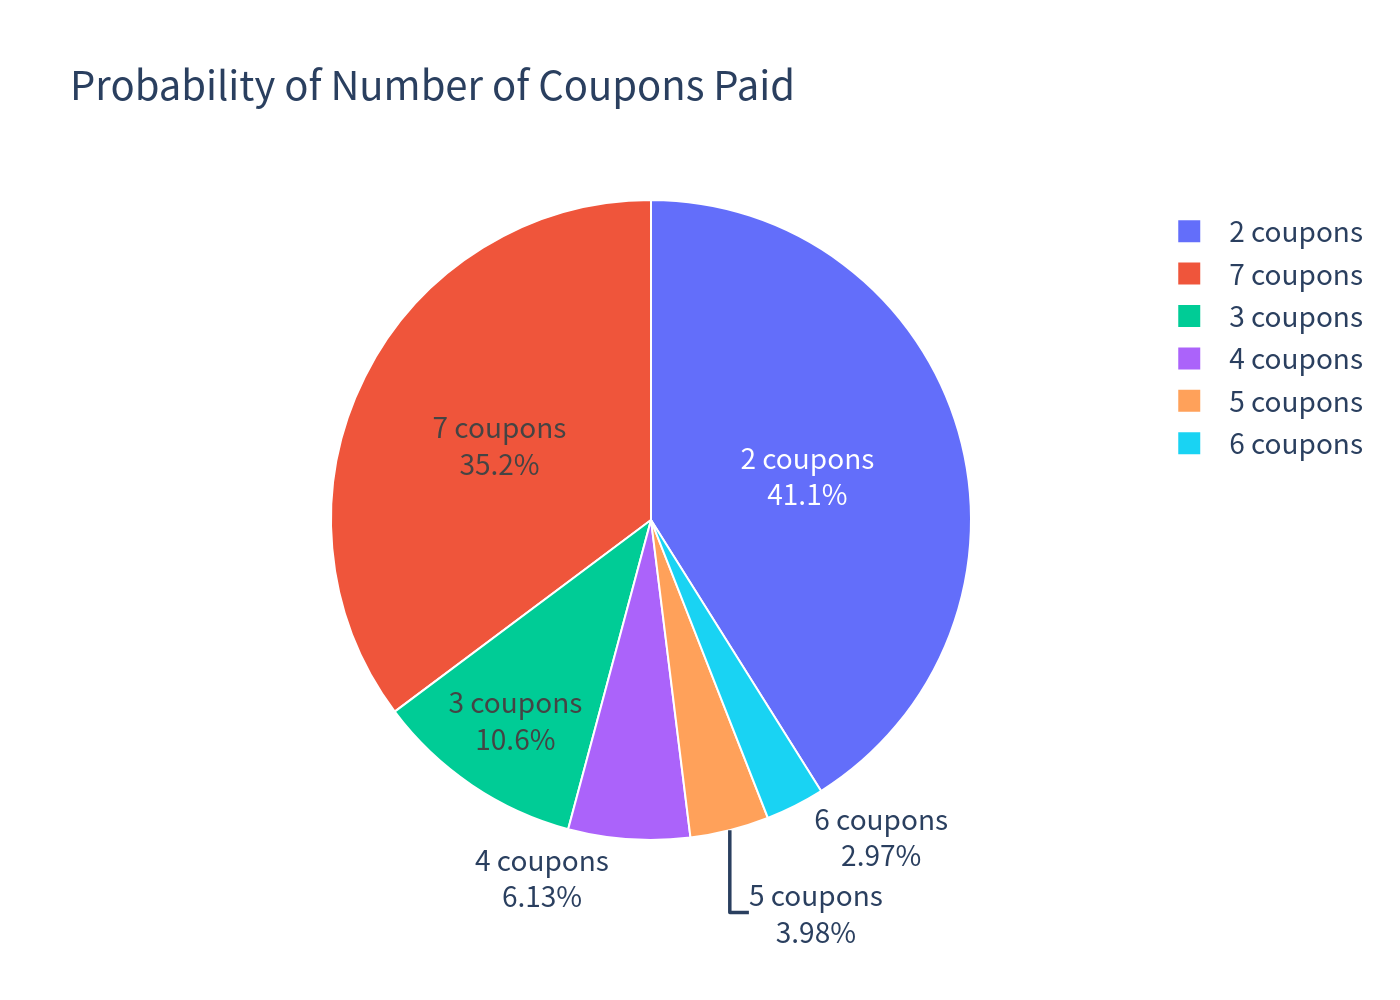
- 64.8% of paths are called early — dominated by the first call date (month 6, 41.1%), which caps total return at just two coupons despite a full year remaining.
- 35.2% run to maturity. Of those, ~58% (≈20.5% of all simulations) breach the barrier and lose principal, averaging −22.1% total return; the remainder recover par plus all seven coupons.
Investment Commentary
Strengths
- A high headline coupon (8.00% p.a.), far above CHF cash (~0%), paid quarterly and regardless of share performance.
- Frequent positive outcomes: ~81% of paths beat cash and ~80% return capital with coupons; the median outcome is ≈ 8% annualized.
- Low realized volatility (~9.7%) versus the ~17% of the underlying basket, and a continuous 35% worst-of cushion that absorbs ordinary market noise.
- Quanto CHF removes currency risk for a Swiss-franc investor.
Risks / trade-offs
- Capped upside: the best case is ≈ +14% total (≈8% annualized); the investor gives up essentially all participation in an insurer rally.
- Fat left tail: ~1-in-5 chance of loss, and when the barrier breaks alongside a large worst-of decline, losses (average ≈ −22% total; VaR 99% ≈ −29.6% annualized) dwarf the coupons earned.
- Worst-of trigger: a single weak name (e.g. AXA, the most volatile of the three) can cause the loss even if Allianz and Generali perform fine.
- Early-call / reinvestment risk: the issuer calls precisely when markets are strong, capping good outcomes at a handful of coupons; ~41% of paths end after only six months.
- Issuer credit exposure to Leonteq (BBB-) with PostFinance guarantee.
This commentary is a quantitative summary of simulated outcomes and is not investment advice or a suitability assessment.