
Morgan Stanley Jump Notes with Auto-Callable Feature due 2033
Principal-Protected Note linked to the Morgan Stanley Amplitude Index™ (proxy: S&P 500)
Headline Simulation Results
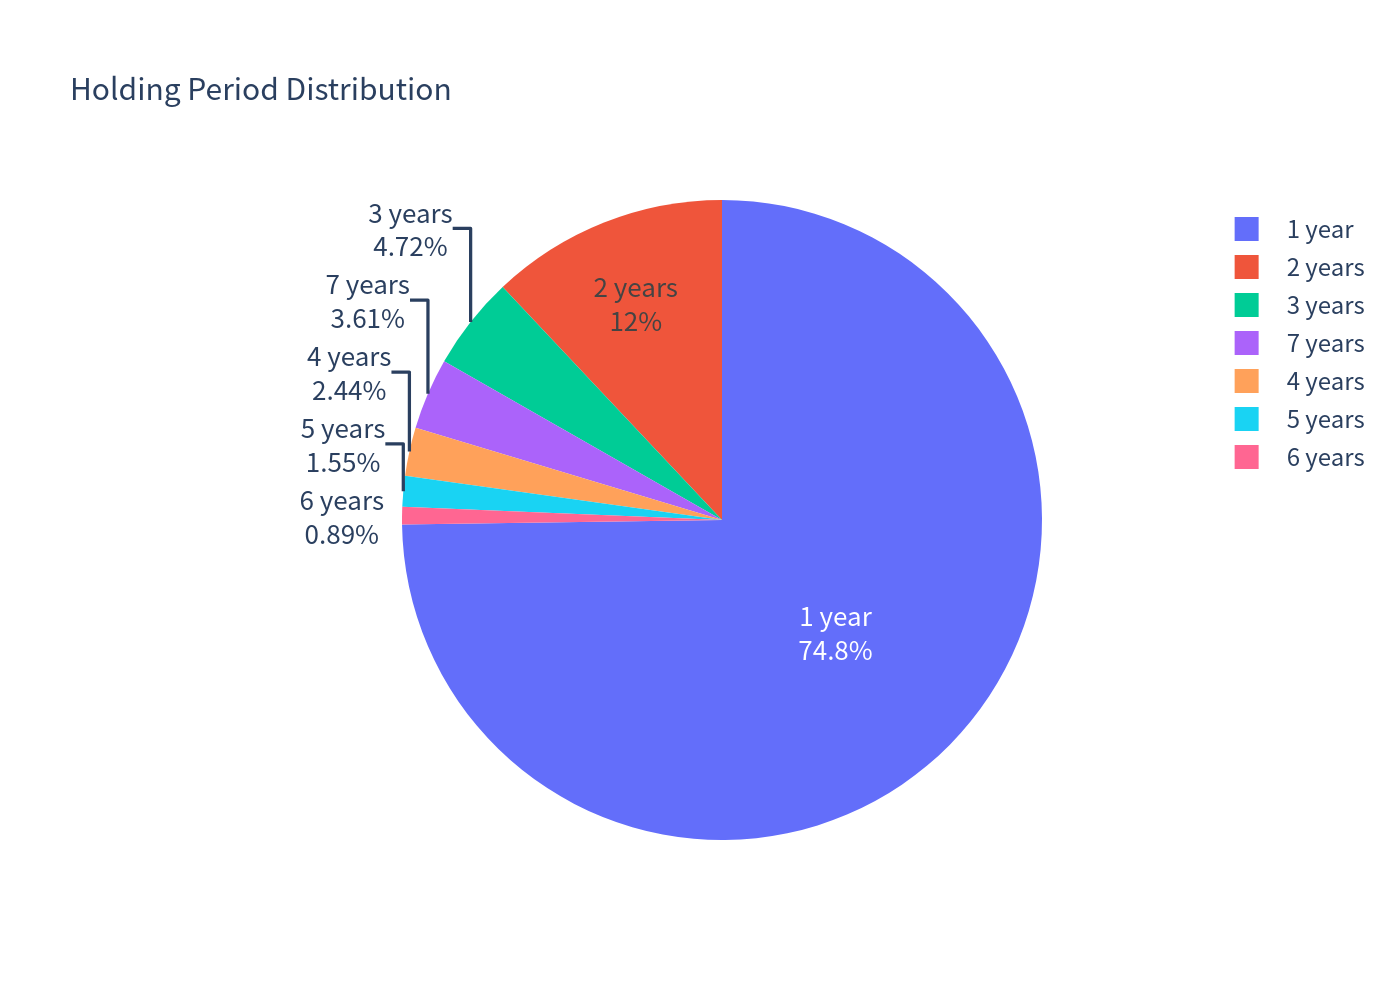
Because the note is principal-protected and auto-calls the moment the index is up by just 1% at an annual check, the simulated return profile is extremely asymmetric: a very high chance of locking in a mid-teens annualized figure, versus a small (~3.6%) tail where the note runs the full 7 years to 2033. Within that tail, most paths (~2.8% of all scenarios) finish at or below the starting level and pay exactly par (a 0% total return), while a thin sliver (~0.8%) finish slightly above the start and receive a modest maturity upside. Annualized figures should therefore be read together with the total-return and holding-period numbers below.
About the Product
Issuer / Guarantor: Morgan Stanley Finance LLC / Morgan Stanley (senior unsecured; not FDIC-insured). Principal: $1,000 per note. Currency: USD. Underlying: the Morgan Stanley Amplitude Index™ — a proprietary Morgan Stanley strategy index. Because the exact index is not publicly quoted, this analysis uses the S&P 500 as a transparent, broad US-equity proxy for the underlier.
How it works (plain English)
- You invest $1,000. The note pays no periodic interest.
- Annual "jump" auto-call: On each anniversary (years 1–6), if the index is at or above 101% of its starting level, the note is automatically redeemed and you receive a preset cash amount that steps up each year — roughly a 13% simple annual return: 113% of par (yr 1), 126% (yr 2), 139% (yr 3), 152% (yr 4), 165% (yr 5), 178% (yr 6).
- If never called: at maturity (Nov 2033) you receive your $1,000 back plus 100% of any index gain if the index finished above its start; otherwise you simply get your $1,000 back.
- In all cases, principal is protected at maturity — you never receive less than par (credit risk aside).
In essence you are selling a capped-upside exposure in exchange for hard downside protection and a high-probability ~13%/yr cash return that triggers whenever equities are even modestly higher.
Key Statistics
| Metric (annualized) | Structured Product | Underlying (S&P 500 total return) |
|---|---|---|
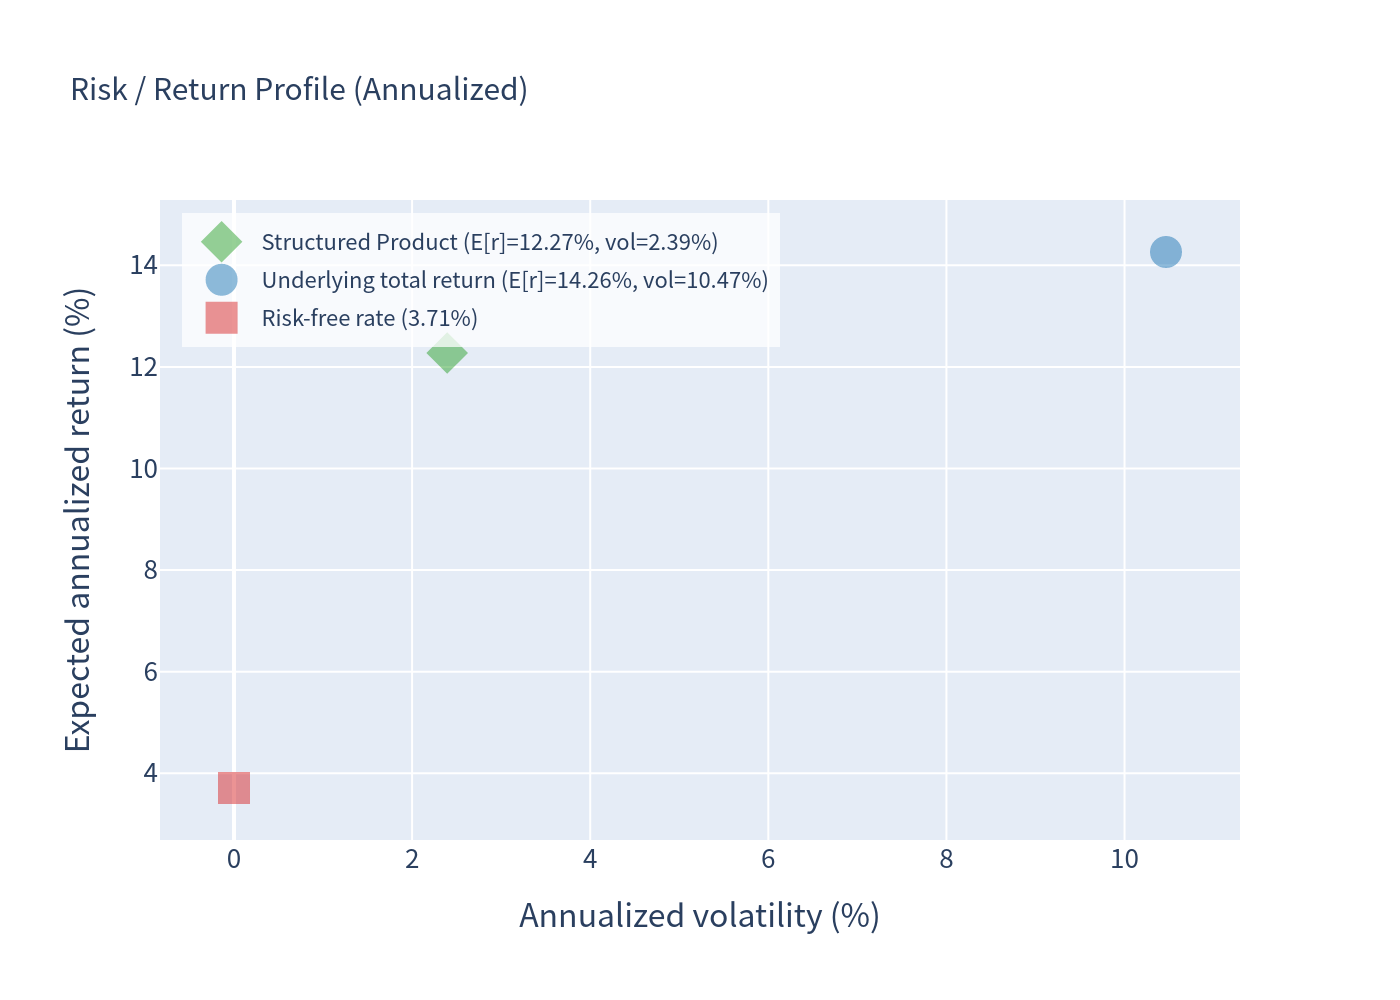
| Expected annualized return | 12.27% | 14.26% |
| Expected annualized volatility | 2.39% | 10.47% |
| Probability of loss | 0.00% | 2.47% |
| 99% confidence VaR (1-yr) | 0.00% | −4.26% |
Total-return view (realized holding period): mean product total return ≈ 17.74% over an average holding of ~1.61 years, versus ≈ 14.58% for the underlying over the same (path-matched) horizons — the product actually realizes more total return because it locks in a full 13% whenever the index is up even modestly, whereas those marginal up-years deliver only a few percent to a direct holder. On an annualized basis, however, the product (12.27%) sits ~2 points below the underlying (14.26%): that gap is the price of the cap, i.e. the index's strongest years are truncated at the call. The product captures that annualized upside with only ~a quarter of the volatility and no principal downside.
Simulation Results
Final return outcomes — product vs underlying
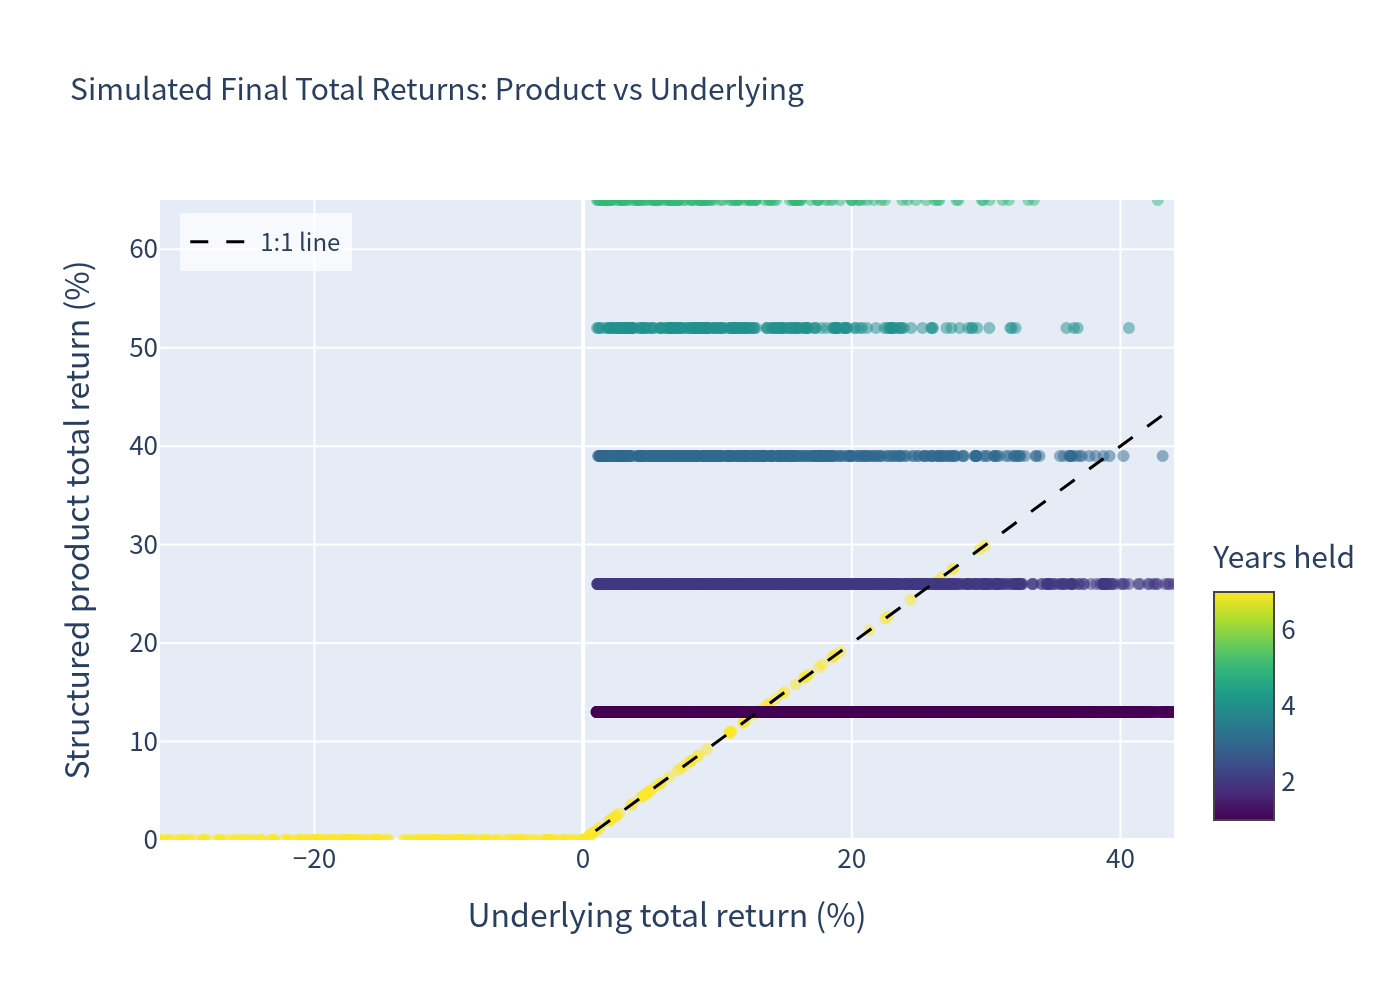
Each point is one simulation; colour shows how long the note was held. Nearly all scenarios sit on horizontal bands (13%, 26%, …) — the fixed jump payments awarded when the index is up ≥1%.
Annualized return distribution — underlying (total return)
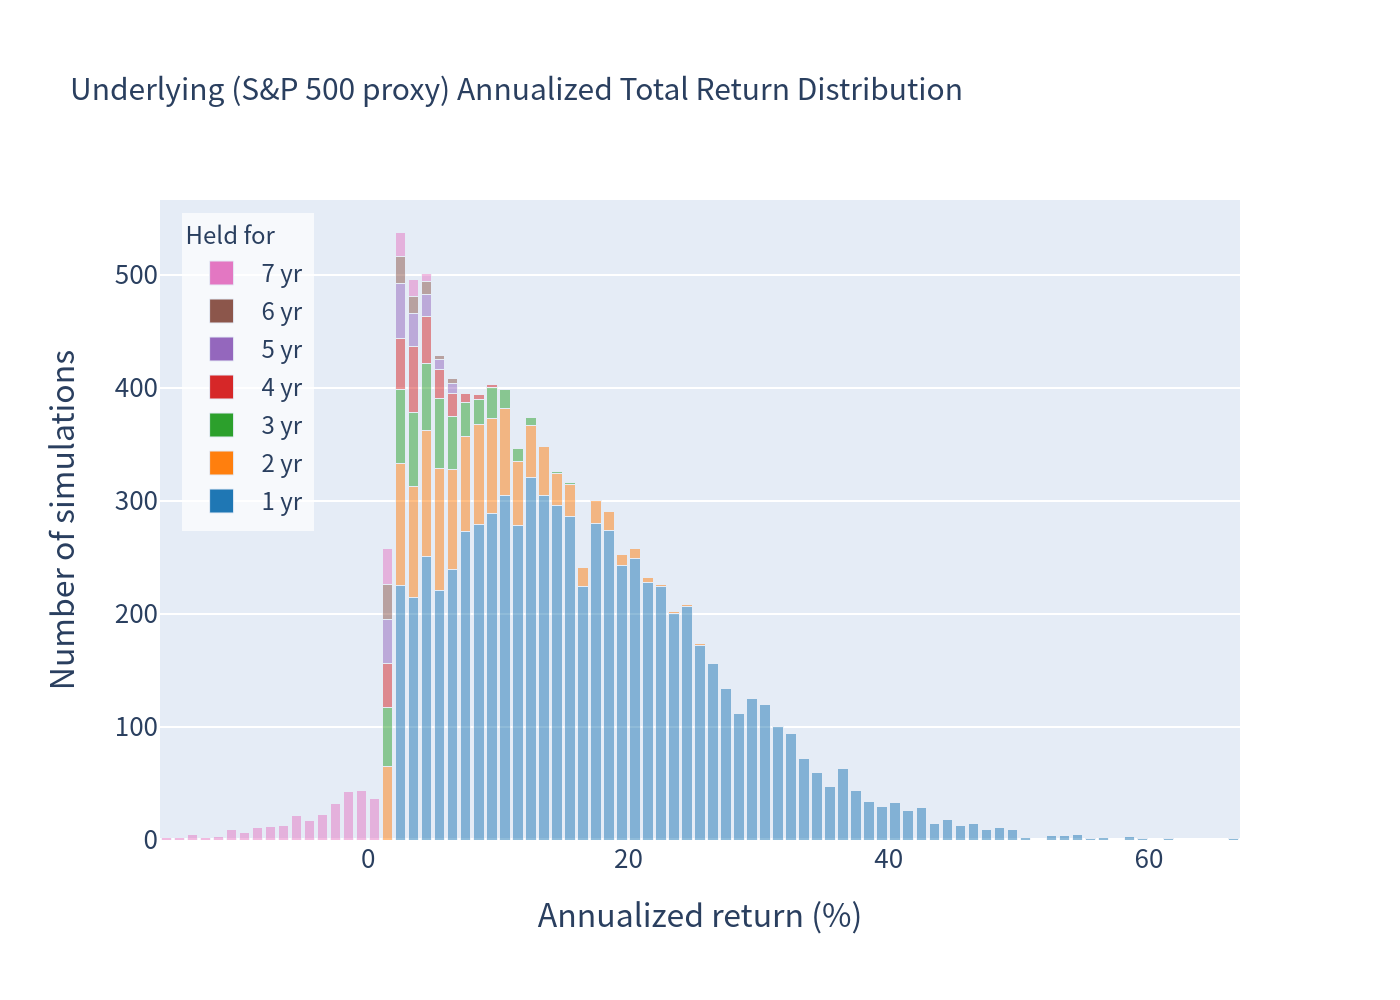
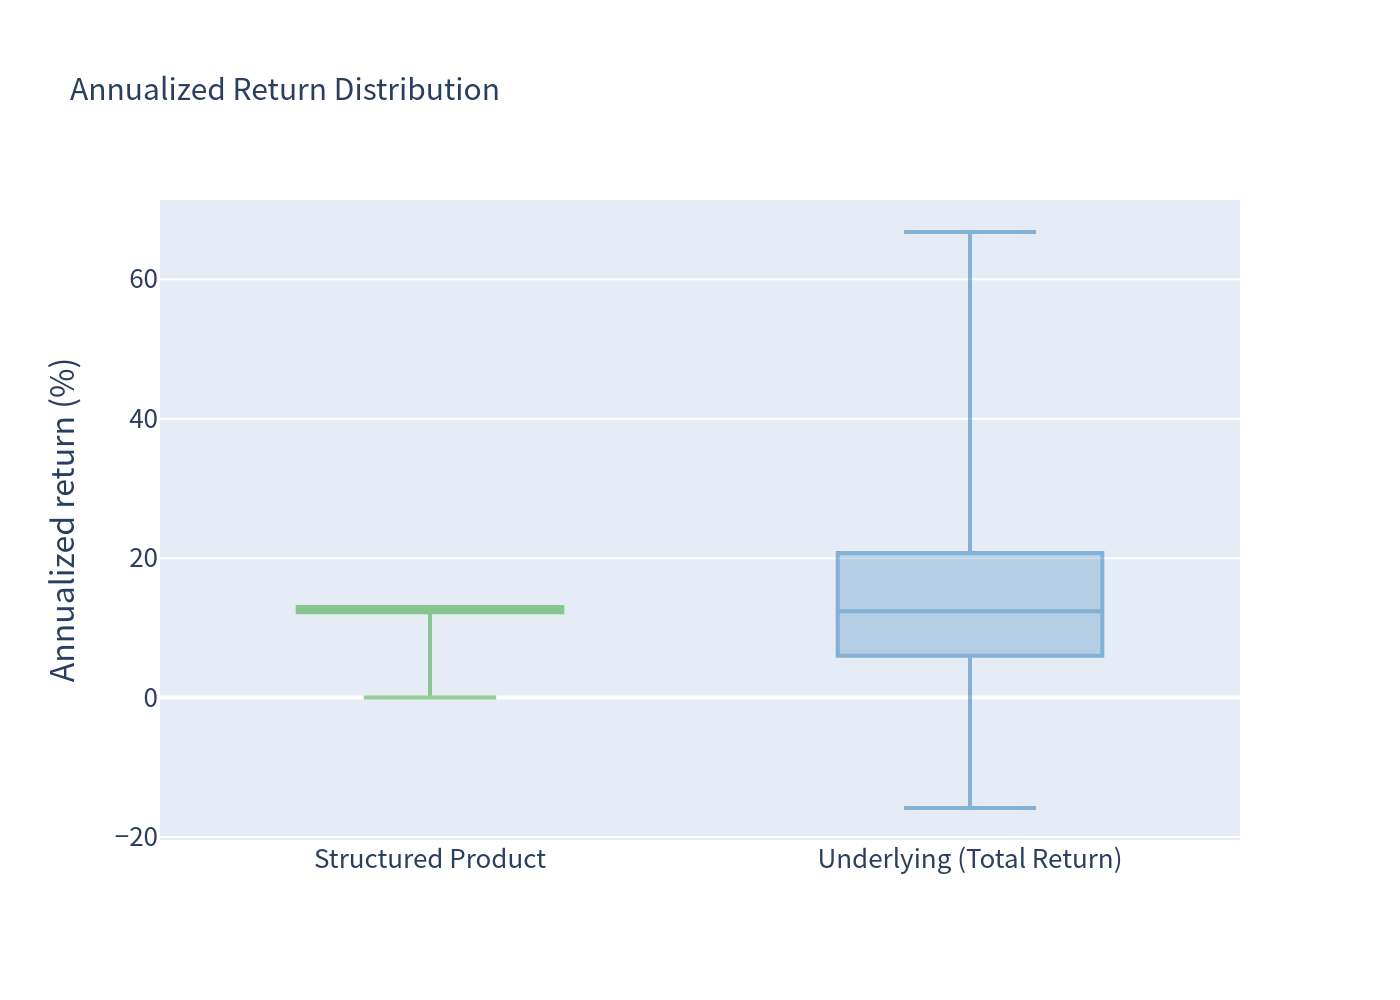
Broad, equity-like dispersion ranging from clearly negative to strongly positive.
Annualized return distribution — structured product
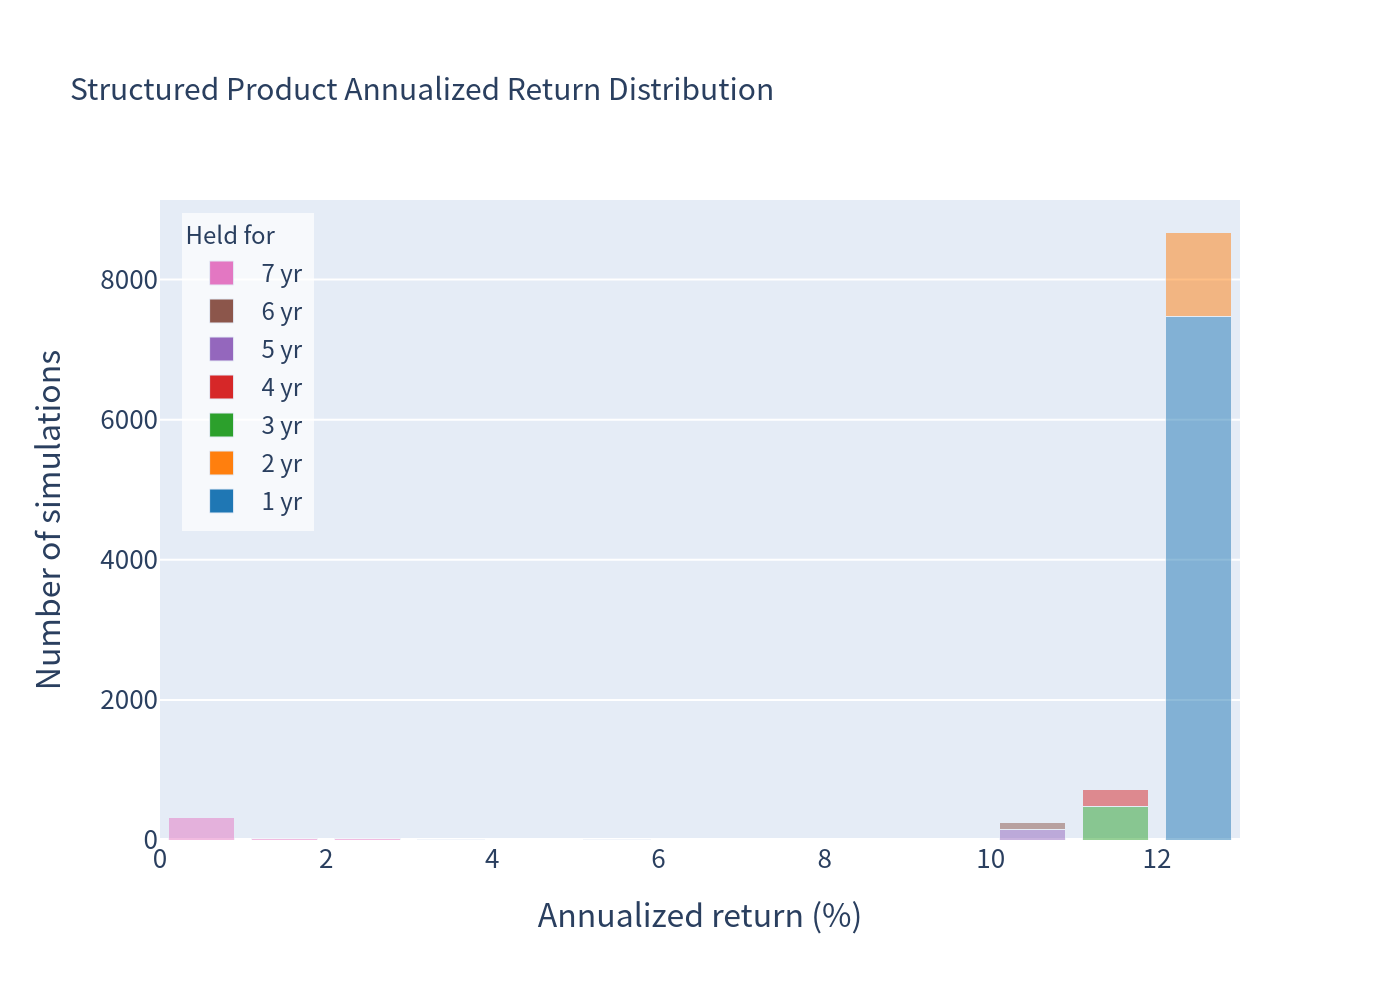
Two clusters: ~75% concentrate at ~12–13% (called in year 1 or soon after) and a small spike at 0% (held to maturity and paid only par).
Scenario probabilities
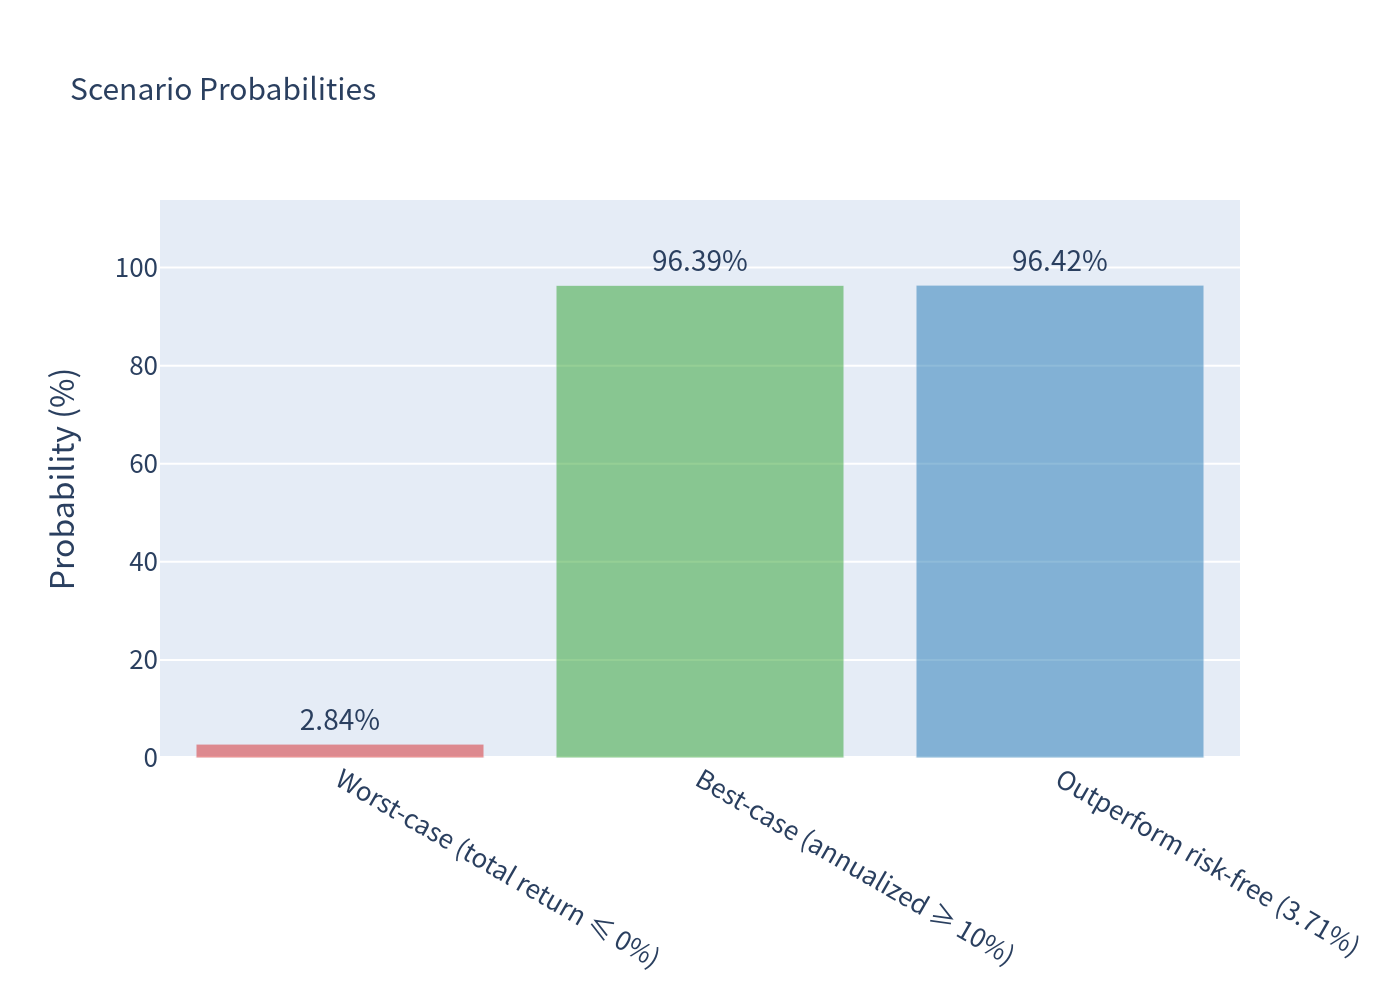
2.84% chance of a flat/zero total return (worst case, principal returned), 96.39% chance of ≥10% annualized, and 96.42% chance of beating the risk-free rate.
Risk / return profile
The product sits far to the left of the underlying (much lower volatility) at a similar expected return, well above the risk-free rate.
Annualized return distribution comparison (box plot)
Holding-period distribution
~74.8% of notes call after 1 year; the remainder taper off, with ~3.6% held the full 7 years.
Investment Commentary
Favorable points
- Hard principal protection: under no scenario (other than issuer default) do investors receive less than the $1,000 principal at maturity, giving a very defensive, bond-like floor even in deep equity selloffs.
- High hit-rate, low dispersion: ~96% of simulated paths beat the risk-free rate, and realized volatility is tiny (~2.4%) because a 1%-above-1% trigger is met almost immediately in a rising market.
- Attractive cash-on-cash if called early: a ~13% annualized return in the first year is well above prevailing short rates, with limited time in the trade.
- Defined, escalating schedule: if the index needs more time, the redemption value steps up each year, so staying invested is compensated.
Points to weigh
- Capped upside: once the index is ≥101% at an annual check the note is called, so a strong multi-year equity rally (and dividends) is forgone — you earn ~13%/yr and no more.
- Opportunity-cost tail: in ~3.6% of scenarios the index never rises 1% at any annual observation, so the note runs the full 7 years; most of these (~2.8% of all paths) end at or below the start and return only par (0% total over seven years) — capital back, but zero earnings, while a small sliver earn a modest maturity upside.
- Path / observation timing: a single annual fixing drives each call; a temporary dip exactly at a year-end observation can defer a payment even if the index recovers shortly after.
- Embedded cost: the pricing-date estimated value is ≈ $888.20 per $1,000 (≈11% below the issue price), reflecting structuring and hedging costs; an early secondary-market exit may realize less than par.
- Credit & structure risk: unsecured MSFL obligation guaranteed by Morgan Stanley; not a deposit and not FDIC-insured.
Simulations use a positive long-run equity drift (risk-free + equity risk premium), which is why expected returns exceed the risk-free rate. Annualized product figures look high partly because positions are typically held only ~1.6 years; interpret them alongside total return and holding period. This document is an analytical evaluation of the term sheet and is not investment advice or a suitability assessment.