
13.80% p.a. Multi Barrier Reverse Convertible on AMD, Amazon & Netflix (Quanto CHF)
Headline Simulation Results
| Metric | Value |
|---|---|
| Expected annualized return | +6.52% |
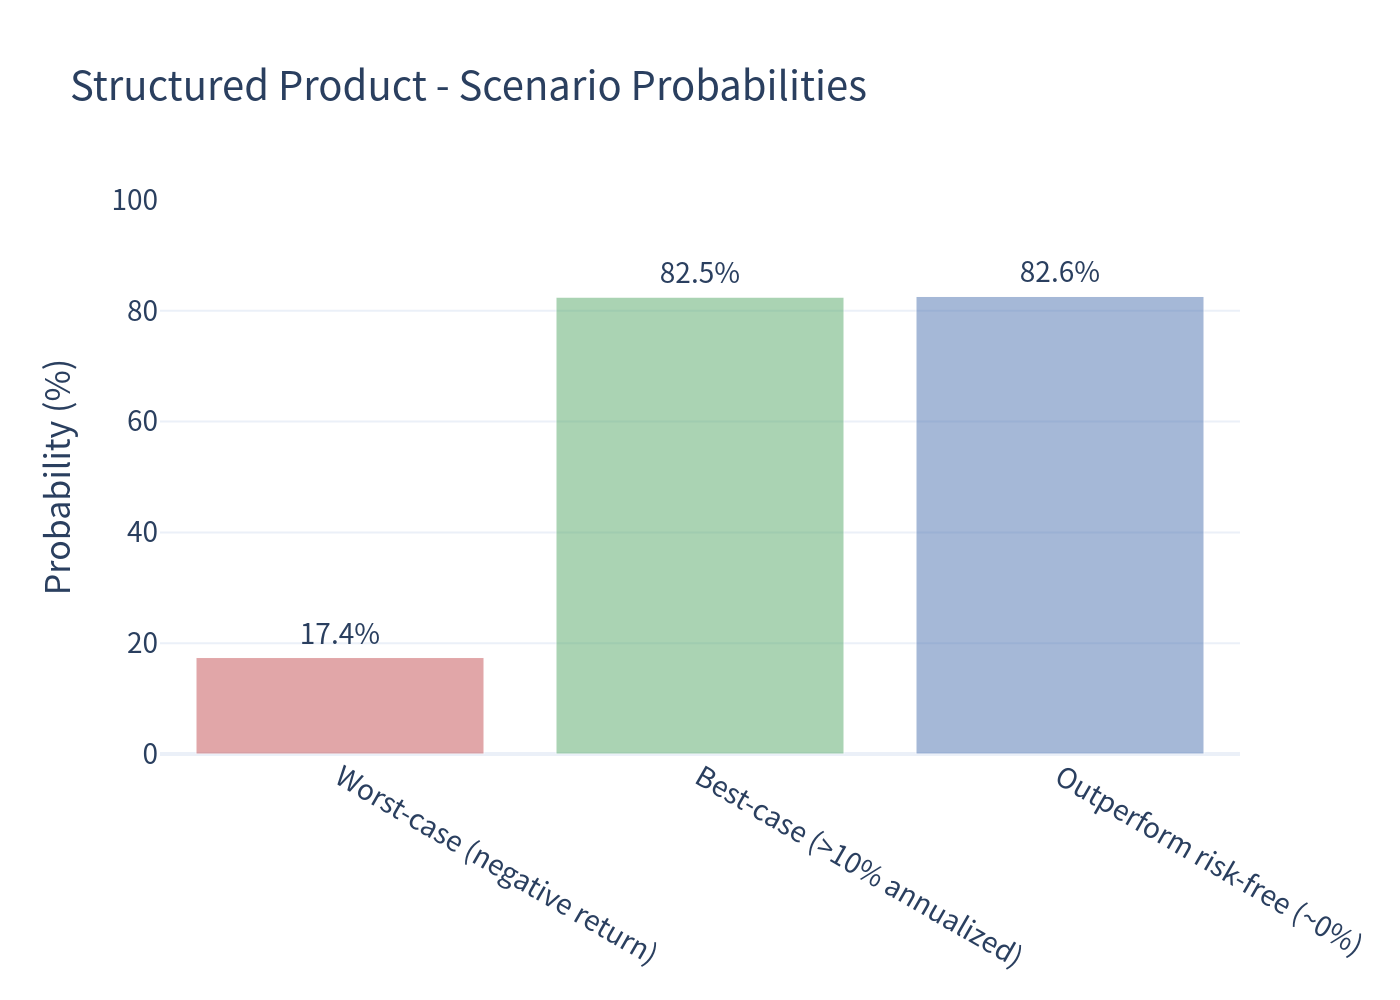
| Probability of a negative return | 17.41% |
| 99% confidence 1-year VaR (1st pct.) | −39.63% |
| Expected holding period | 12.46 months |
| Probability of receiving the full coupon (no impairment) | 82.59% |
The product pays a fixed 13.80% p.a. coupon (quarterly) on three US technology stocks while offering only conditional capital protection. In the large majority of scenarios the investor simply collects the coupon, but roughly one in six paths ends with a meaningful capital loss.
Basic Product Information
- Type: Multi Barrier Reverse Convertible (yield-enhancement, SSPA 1230), worst-of on AMD, Amazon (AMZN) and Netflix (NFLX).
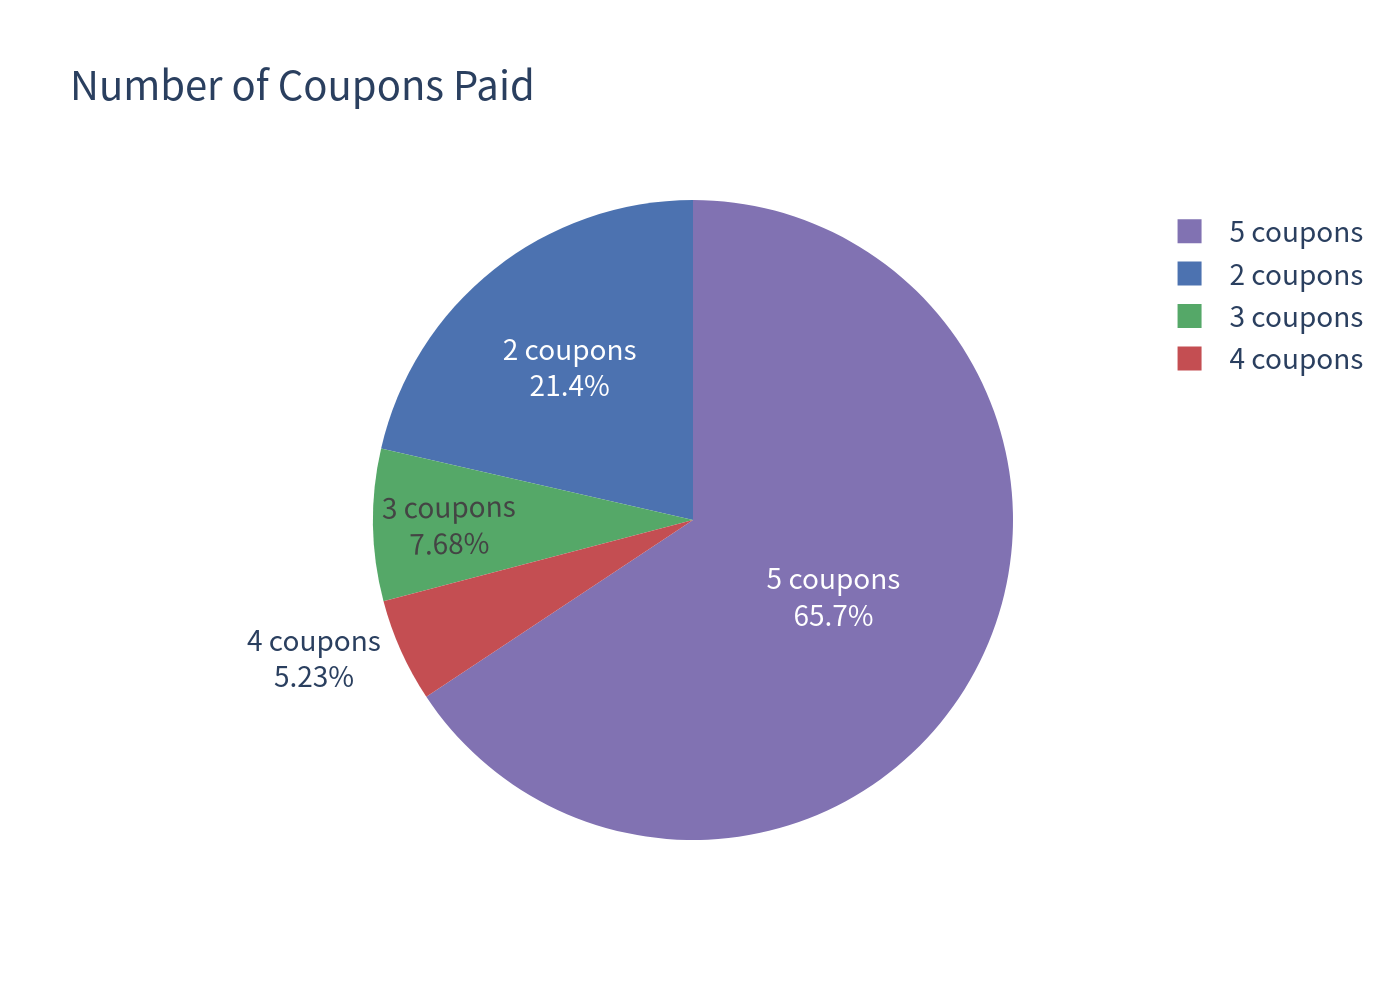
- Coupon: 13.80% p.a., paid quarterly → CHF 34.50 per CHF 1,000 for five quarters.
- Term: ~15 months, from the 18/09/2026 fixing to the 17/12/2027 final fixing.
- Barrier (kick-in): 49.00% of each stock's initial level, monitored continuously.
- Strike: 100.00% of initial level. Denomination / Currency: CHF 1,000 · Quanto CHF (no FX risk for the investor).
- Callable: the Issuer may early-redeem quarterly (first date month 6) at par plus the then-current coupon.
How it works (plain language)
Think of it as selling protection on the worst of three tech shares in return for a high, fixed coupon:
- If things go well (no stock ever falls below 49% of its starting level), you get your money back at 100% plus all coupons. The Issuer also holds an early-redemption right (not an obligation) exercisable on quarterly observation dates from month 6; our simulation assumes the Issuer calls when the worst share is at or above its starting level, in which case you are repaid at par plus one coupon.
- If the worst share ever trades at or below 49% ("barrier event"), the protection disappears. At maturity you then receive the worst share's performance rather than par. If that worst share has recovered back to 100% or more, you still get par; if it has not, you receive its (lower) value and book a capital loss.
- You own the upside of nothing and the downside of the weakest link: your gains are capped at the coupon, but your losses track the single worst-performing of the three stocks.
Key Statistics (10,000 Monte-Carlo paths)
| Metric | Structured Product | Underlying (equal-weight basket) |
|---|---|---|
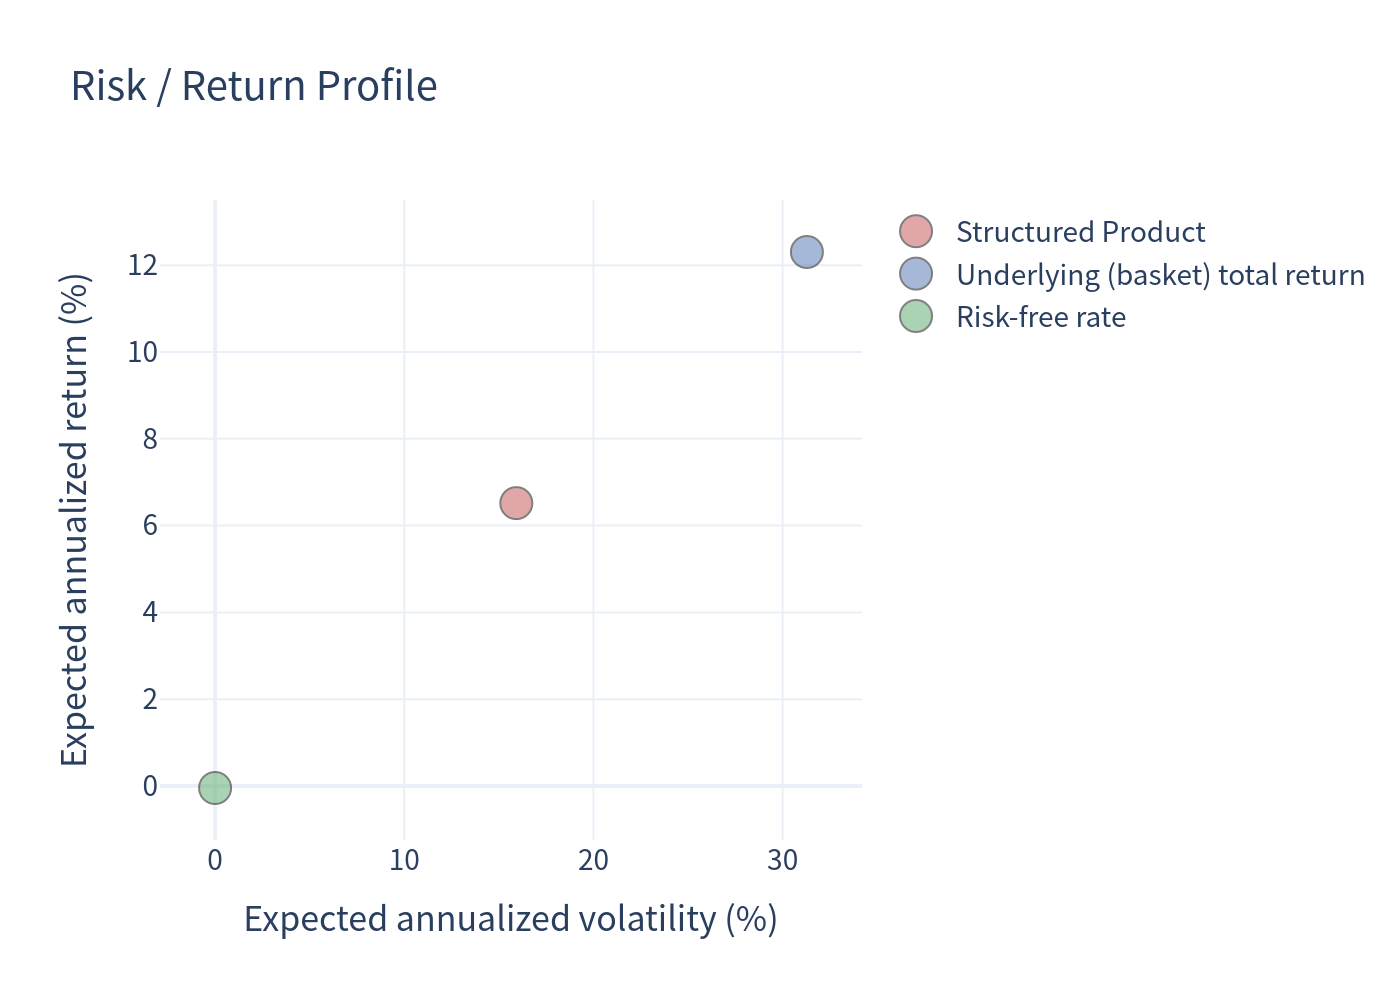
| Expected annualized return | 6.52% | 12.30% |
| Expected annualized volatility | 15.92% | 31.28% |
| Probability of loss | 17.41% | 40.71% |
| 99% confidence VaR (1 year) | −39.63% | −38.88% |
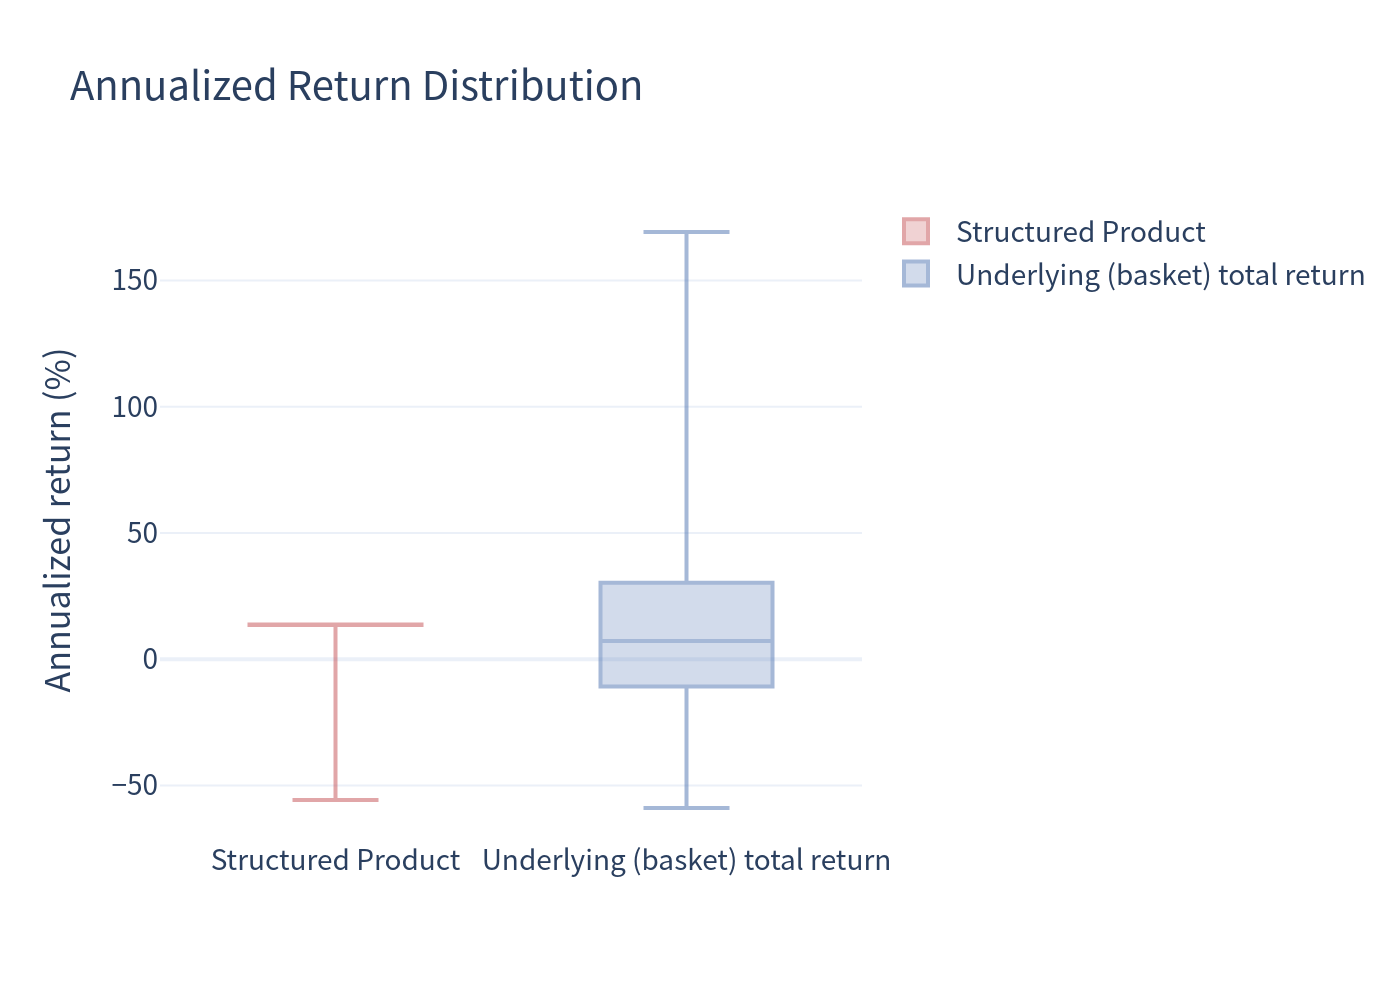
| Median annualized return | 13.58% | 7.29% |
- Expected total return over the realised holding period: +5.60% (product) vs +5.82% (basket).
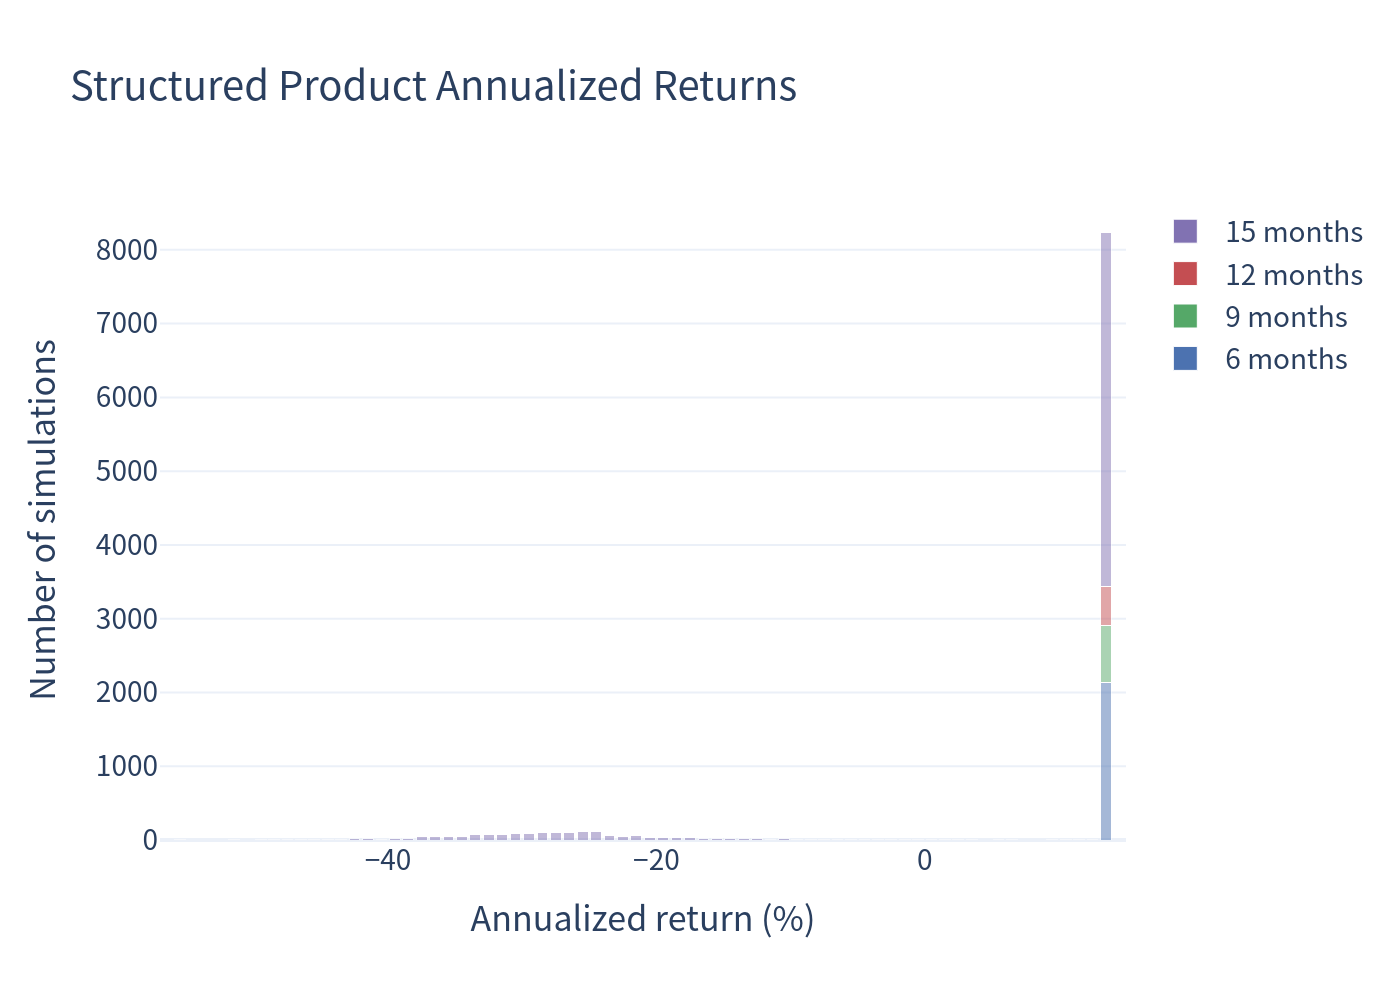
- Unimpaired outcomes are essentially flat at the coupon: every non-impaired path annualises to ~13.8%, which is why the median (13.58%) sits far above the mean.
Outcome distribution
| Outcome | Probability |
|---|---|
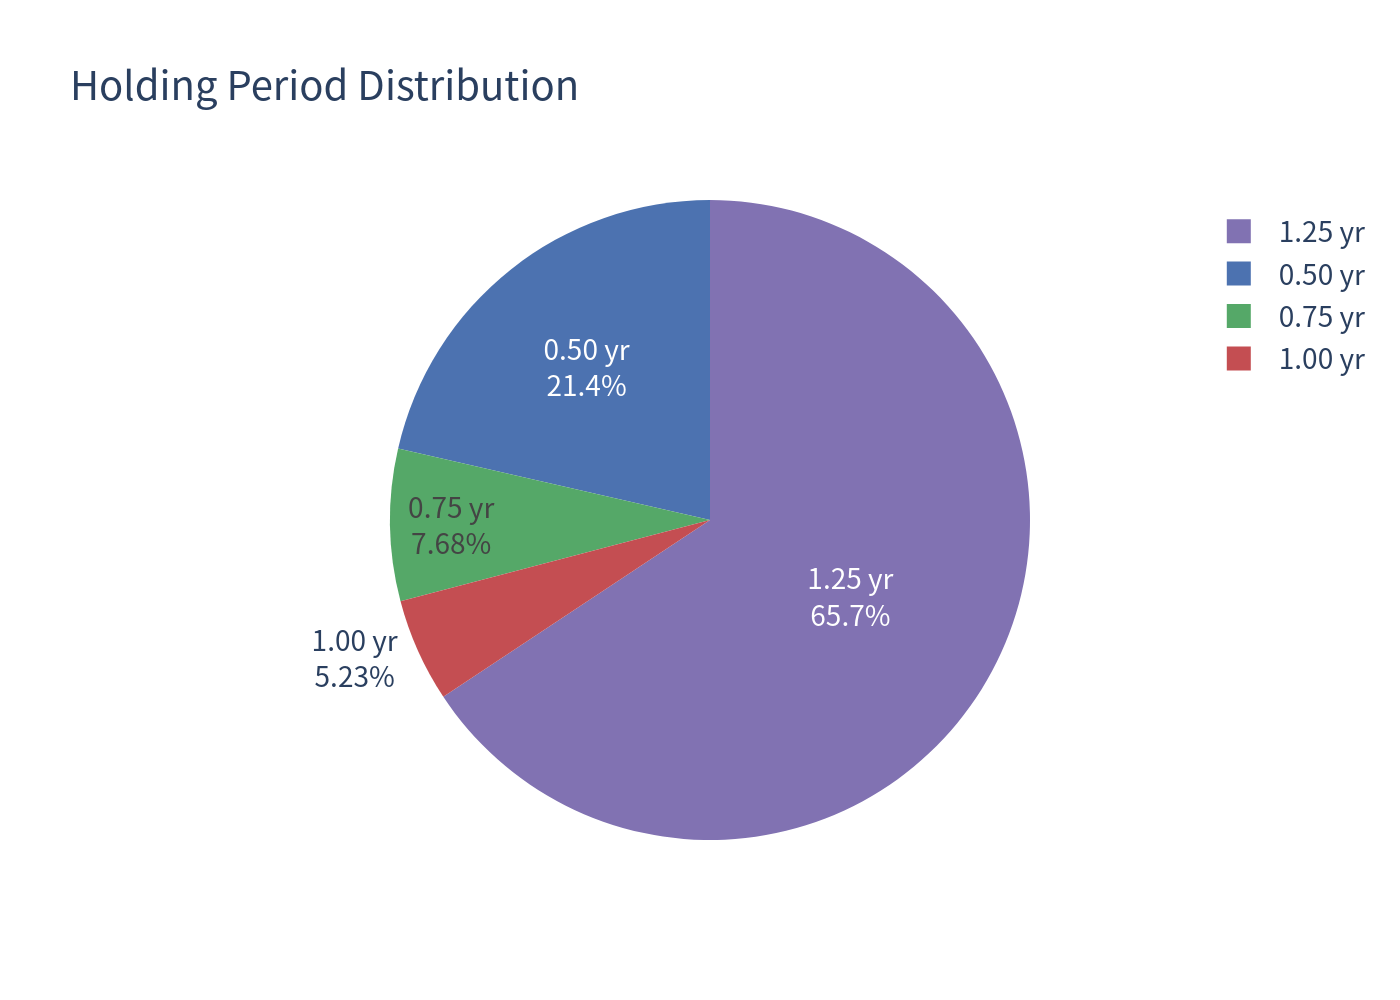
| Early redemption at month 6 / 9 / 12 | 21.41% / 7.68% / 5.23% |
| Held to maturity (month 15) | 65.68% |
| — of which barrier hit and capital loss | 17.58% |
Charts
Simulated outcomes — product vs underlying
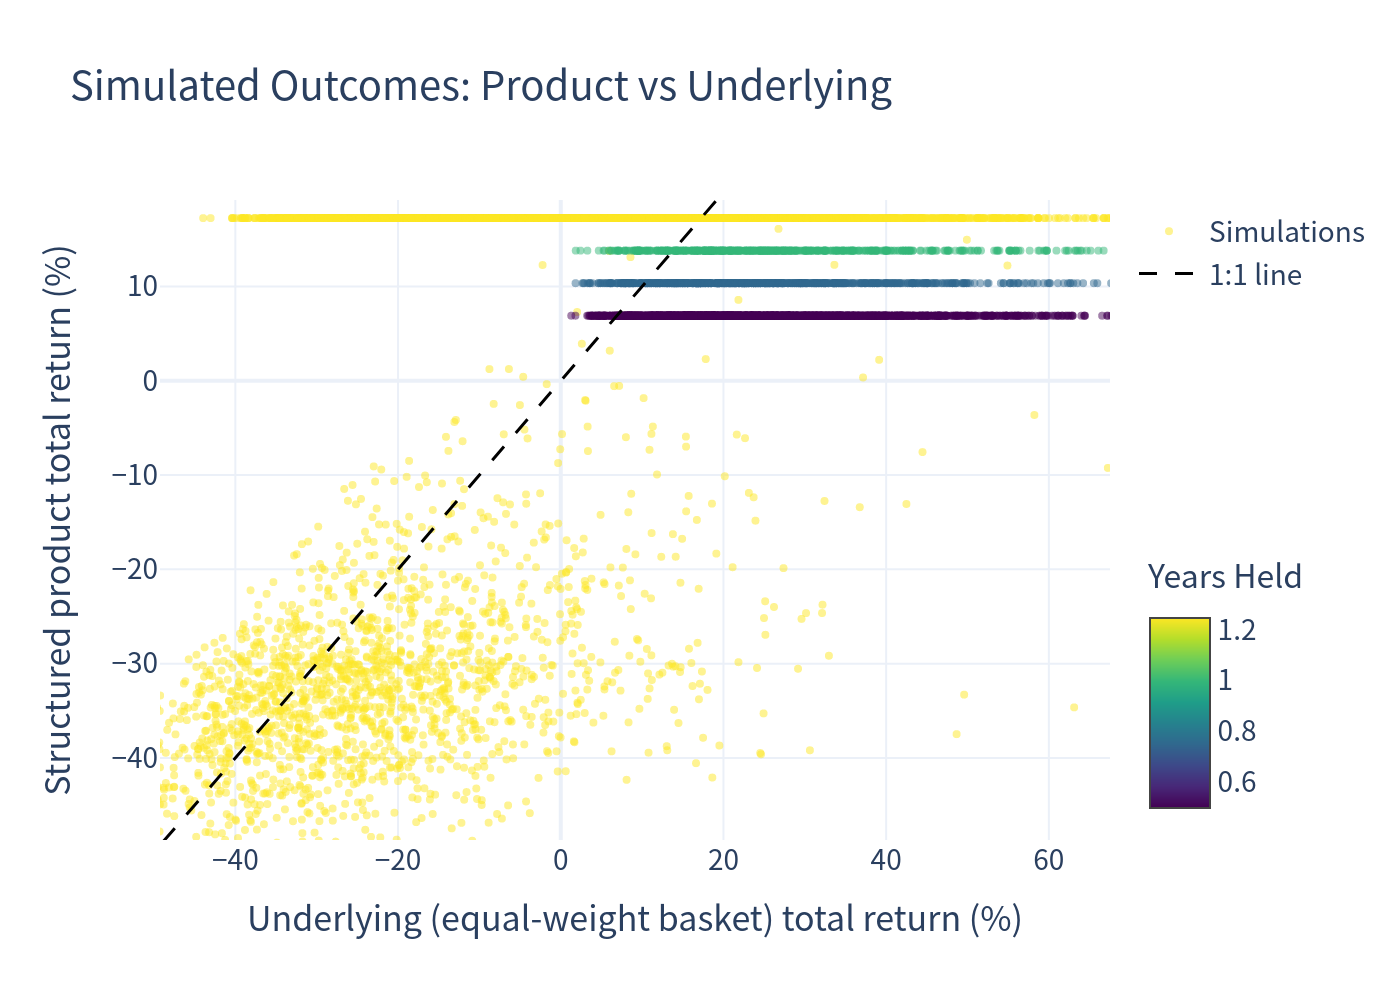
Most outcomes cluster at the product's capped ceiling (~13.8%) regardless of how far the underlying rallies (the flat top). Losses only appear when the underlying falls materially, and then the product's worst-of exposure can drop below the basket.
Annualized return distribution — structured product
Annualized return distribution — underlying basket
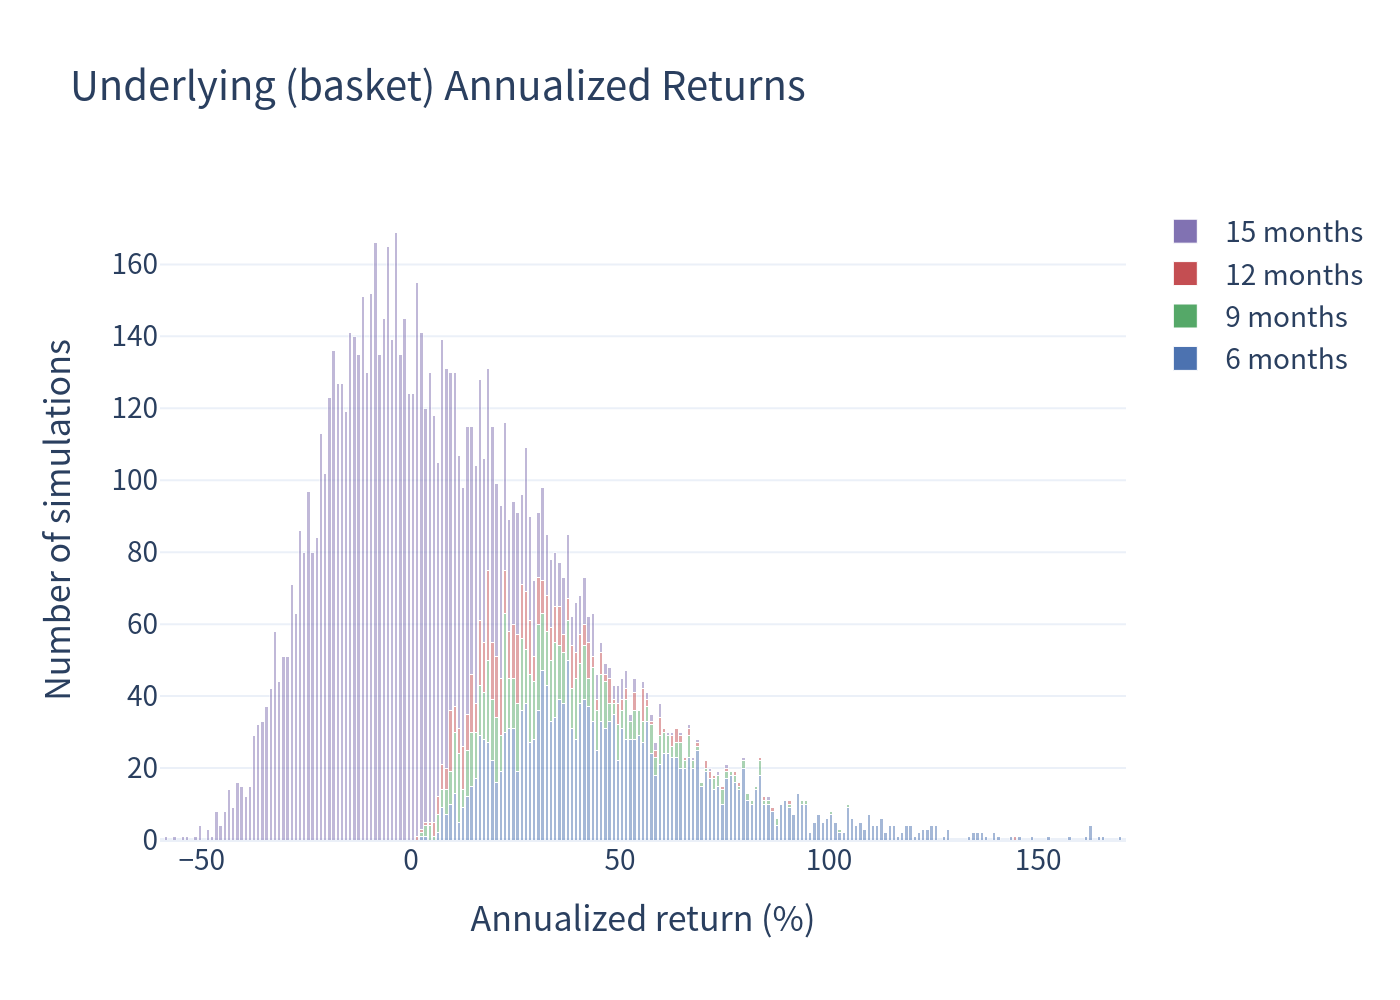
The product's distribution is a spike at the coupon with a left tail; the basket has a much wider (and right-skewed) dispersion.
Scenario probabilities
Risk / return profile
Annualized return box plot
Holding period and coupon distribution
Investment Commentary
Good points
- High headline coupon (13.80% p.a.) — well above the CHF risk-free rate (≈ −0.05%) and paid regardless of market direction during the life of the product.
- Barrier set low at 49% — the barrier is triggered if at least one of the three stocks ever trades at or below 49% of its starting level (continuous observation), i.e. any single stock falling more than ~51% removes protection; the simulated probability of a barrier event is about 18%.
- Quanto CHF removes currency risk on the USD underlyings.
- Higher typical outcome than the basket: in the median path the product returns ~13.6% annualised versus ~7.3% for owning the basket directly, because the fixed coupon dominates the common case.
- Volatility is roughly half that of the basket (15.92% vs 31.28%).
Trade-offs to be aware of
- Upside is fully capped. The best case is the coupon plus par (~13.8% annualised); the investor never participates in a rally of AMD, AMZN or NFLX, and the Issuer's call crystallises this early.
- Worst-of downside is retained. Once the barrier is breached, the redemption follows the single worst of the three names — a deeper exposure than a diversified basket. The 1-year 99% VaR (−39.63%) is as severe as the underlying's (−38.88%), i.e. the coupon cushion does not eliminate tail risk.
- Concentration in high-volatility US tech. AMD, AMZN and NFLX are strongly correlated (pairwise ~0.2–0.4 in simulation) and individually volatile, so a simultaneous tech drawdown is the main loss driver.
- Issuer/credit risk of the issuer and guarantor, plus early-redemption risk that caps the benefit of a rising market.
This document is a quantitative simulation study, not investment advice or a recommendation.