
11.00% p.a. Multi Barrier Reverse Convertible (Callable) on Accelleron Industries, Georg Fischer & Geberit
Headline Simulation Results
At a Glance
| Metric | Structured Product | Benchmark (equal-weight basket, total return) |
|---|---|---|
| Expected annualized return | 6.47% | 14.29% |
| Expected annualized volatility | 11.13% | 22.01% |
| Probability of loss | 14.10% | 28.03% |
| 99% VaR (1 year) | -31.24% | -24.32% |
| Expected holding period | 13.98 months | same horizon |
| Probability of beating the risk-free rate | 85.90% | 71.97% |
- Fixed coupon: 11.00% p.a. (CHF 27.50 per CHF 1,000 every quarter; 16.50% total if held to maturity).
- Barrier: 55% (continuous, worst-of) → barrier breached in 14.90% of simulations.
- Issuer callable: quarterly from month 6 → 41.80% of simulations ended early (called).
- Expected total return over the realized holding period (mean of per-simulation total returns): 6.47%.
The expected annualized return is the mean of each simulation's own CAGR-style annualized return, while the expected total return is the mean of each simulation's holding-period return. They are different quantities and here happen to coincide because the short early-call paths (annualized by simple scaling) offset the deeper but less-amplified losses in the longer paths.
What This Product Is (How It Works)
This is a yield-enhancement note that pays you a high fixed coupon (11% per year) and gives you conditional protection of your capital, in exchange for capping your upside entirely and tying your downside to the worst-performing of three Swiss stocks.
In simple terms
- You earn the coupon no matter what – as long as the note is still alive, you receive CHF 27.50 per CHF 1,000 each quarter, regardless of how the three shares perform.
- You keep your capital (par) if the market is calm – as long as none of the three shares ever trades at or below 55% of its starting price (a deep barrier), you get your full CHF 1,000 back at maturity, plus all coupons.
- You only take a hit if a barrier break happens – if any one of the three shares touches 55% at any moment, the protection disappears. From then on your redemption depends on the worst performer: if that share is below its starting price at maturity, you receive that share (or the cash equivalent) and bear its full loss. If it has recovered to at least its starting level, you still get par.
- Your upside is capped – you never earn more than the coupons, even if the shares soar.
- The issuer can call the note early – from month 6 onward, the issuer may redeem at par plus the current coupon, ending the deal (this typically happens after a rally, capping how many coupons you collect).
Because a single weak share is enough to remove protection, the payoff behaves like a “reverse convertible” on the weakest link.
Simulation Results
Product vs Benchmark outcomes
Comparison of simulated product returns against the equal-weight basket benchmark. Points above the dashed 1:1 line favour the product.
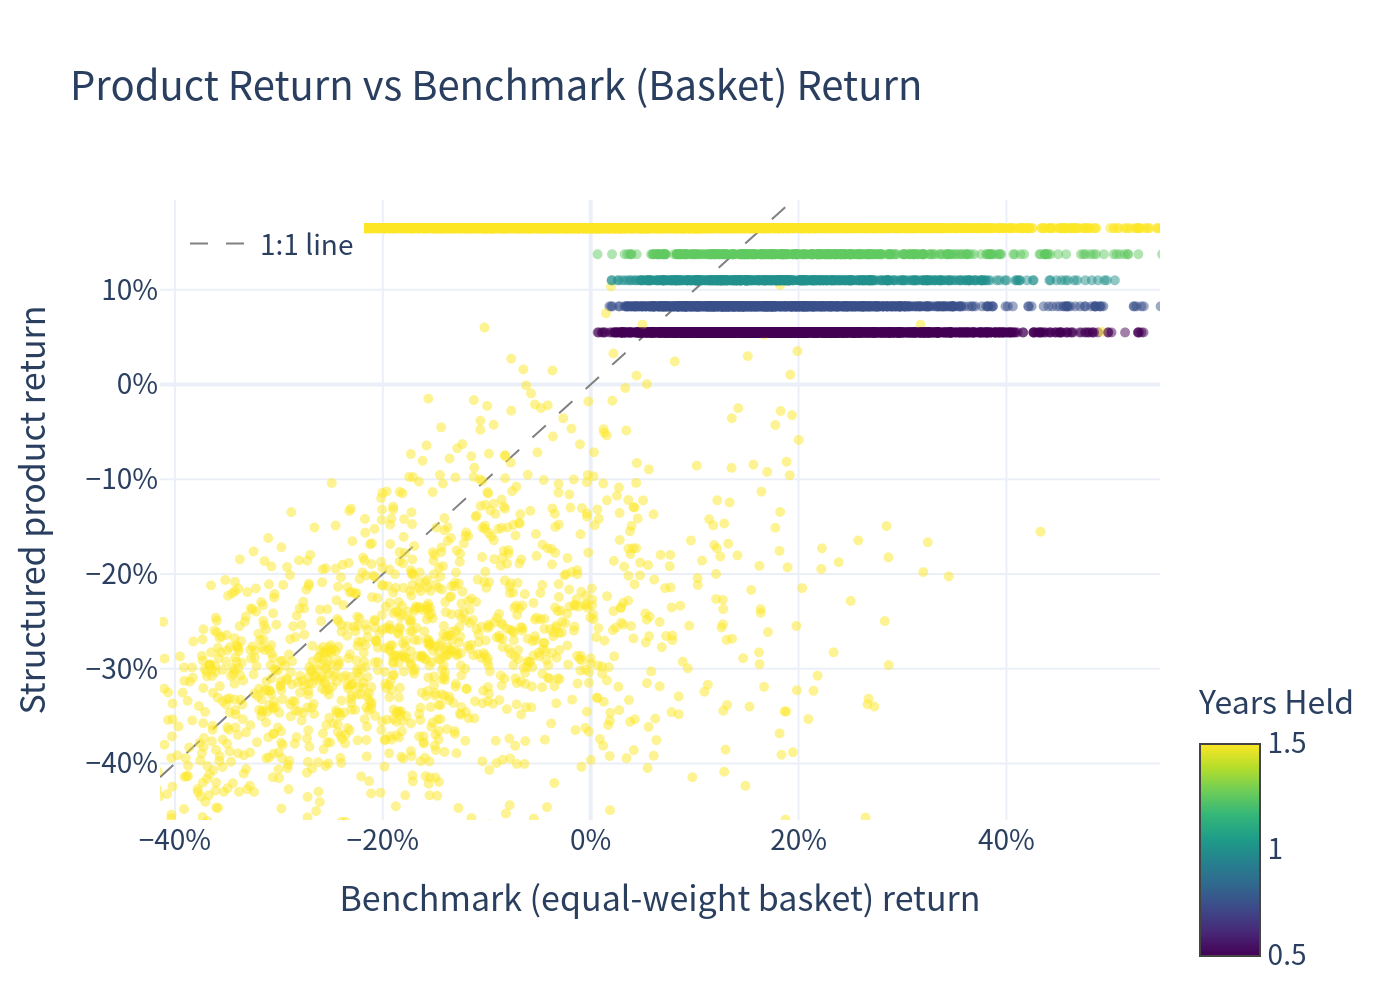
The scatter shows each simulated outcome (points above the dashed 1:1 line favour the product). The product's return clusters in a narrow band: it captures small positive returns (coupons) in most cases but has a distinct tail of large losses that mirrors the benchmark, while giving up the benchmark's large upside.
Distribution of annualized returns
Histogram of simulated annualized returns for the product and for the benchmark basket.
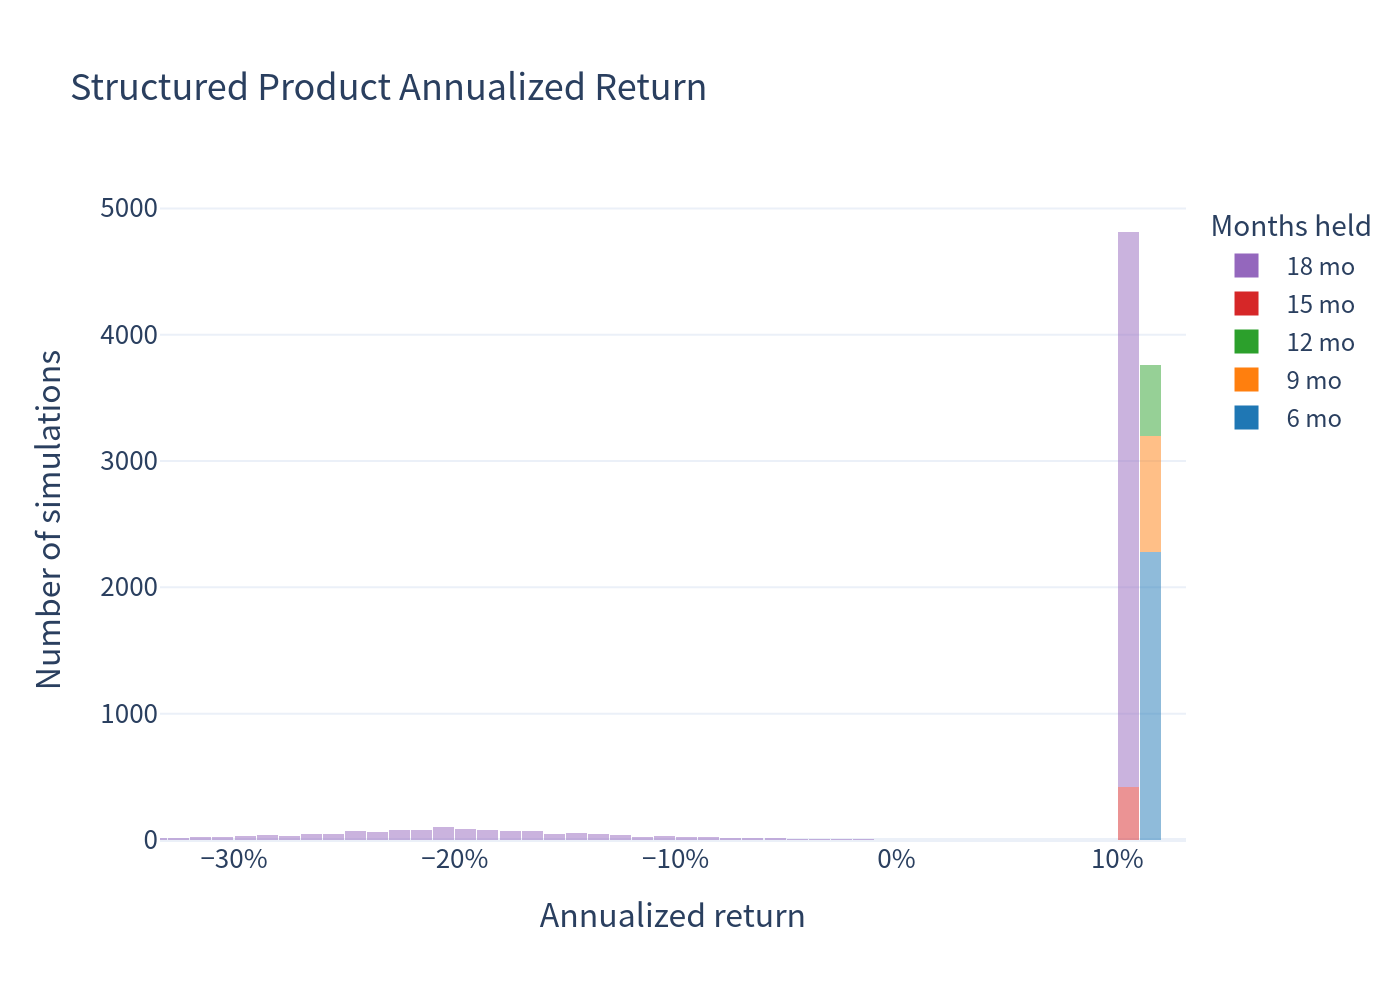
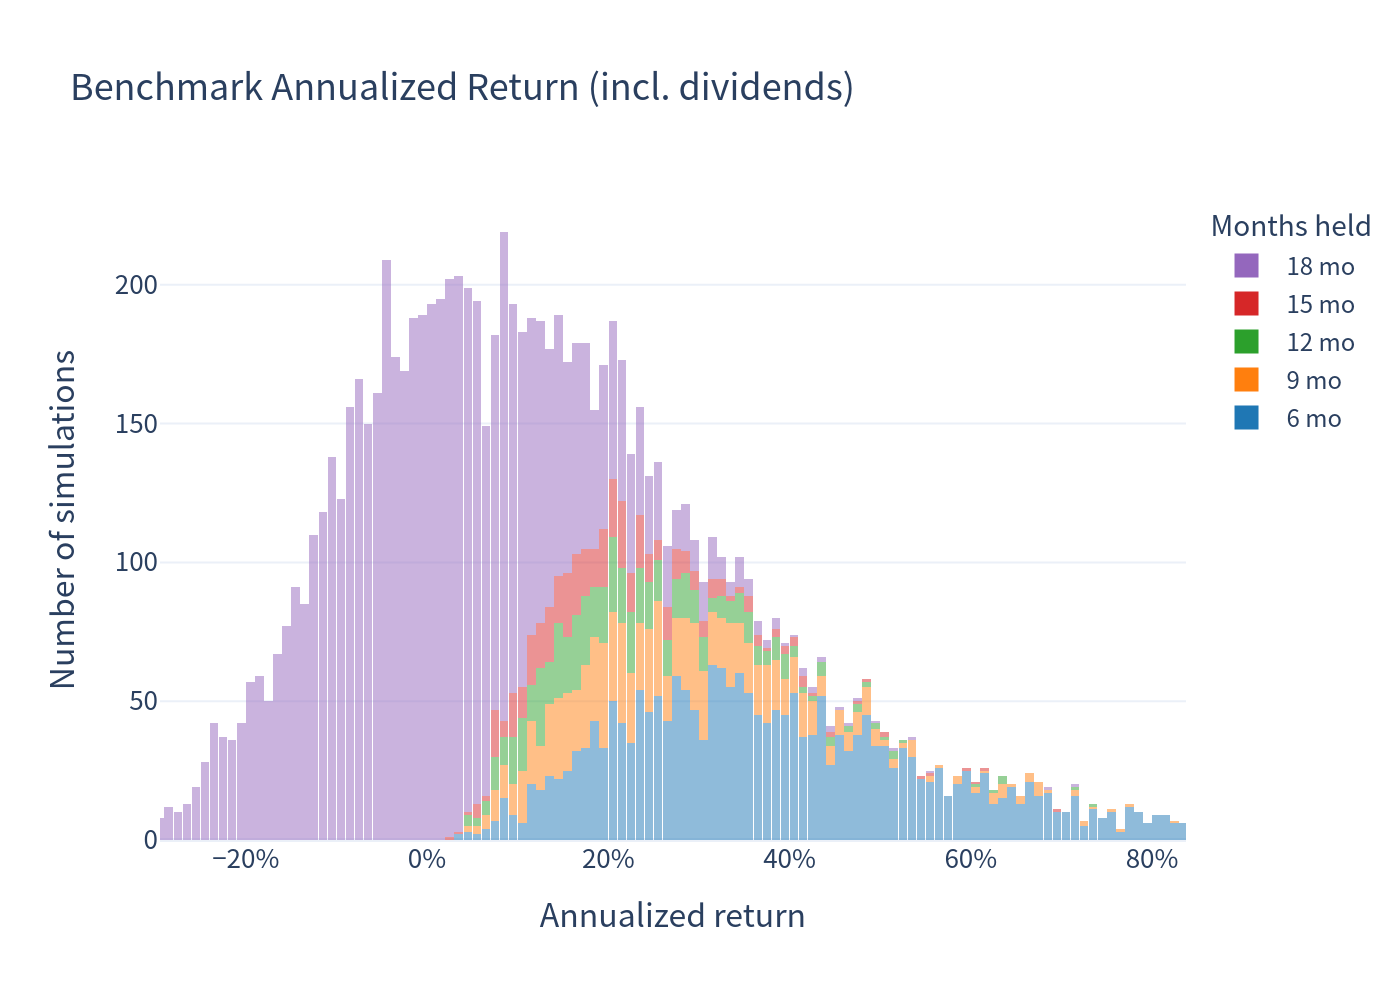
The product's distribution is tightly concentrated (a reflection of the fixed coupon) but is left-skewed, with a thin tail of severe losses when the 55% barrier is breached. The benchmark has a much wider, more symmetric distribution with both larger gains and larger losses.
Risk vs return
Expected return plotted against expected volatility, with the distribution of outcomes shown as a box plot.
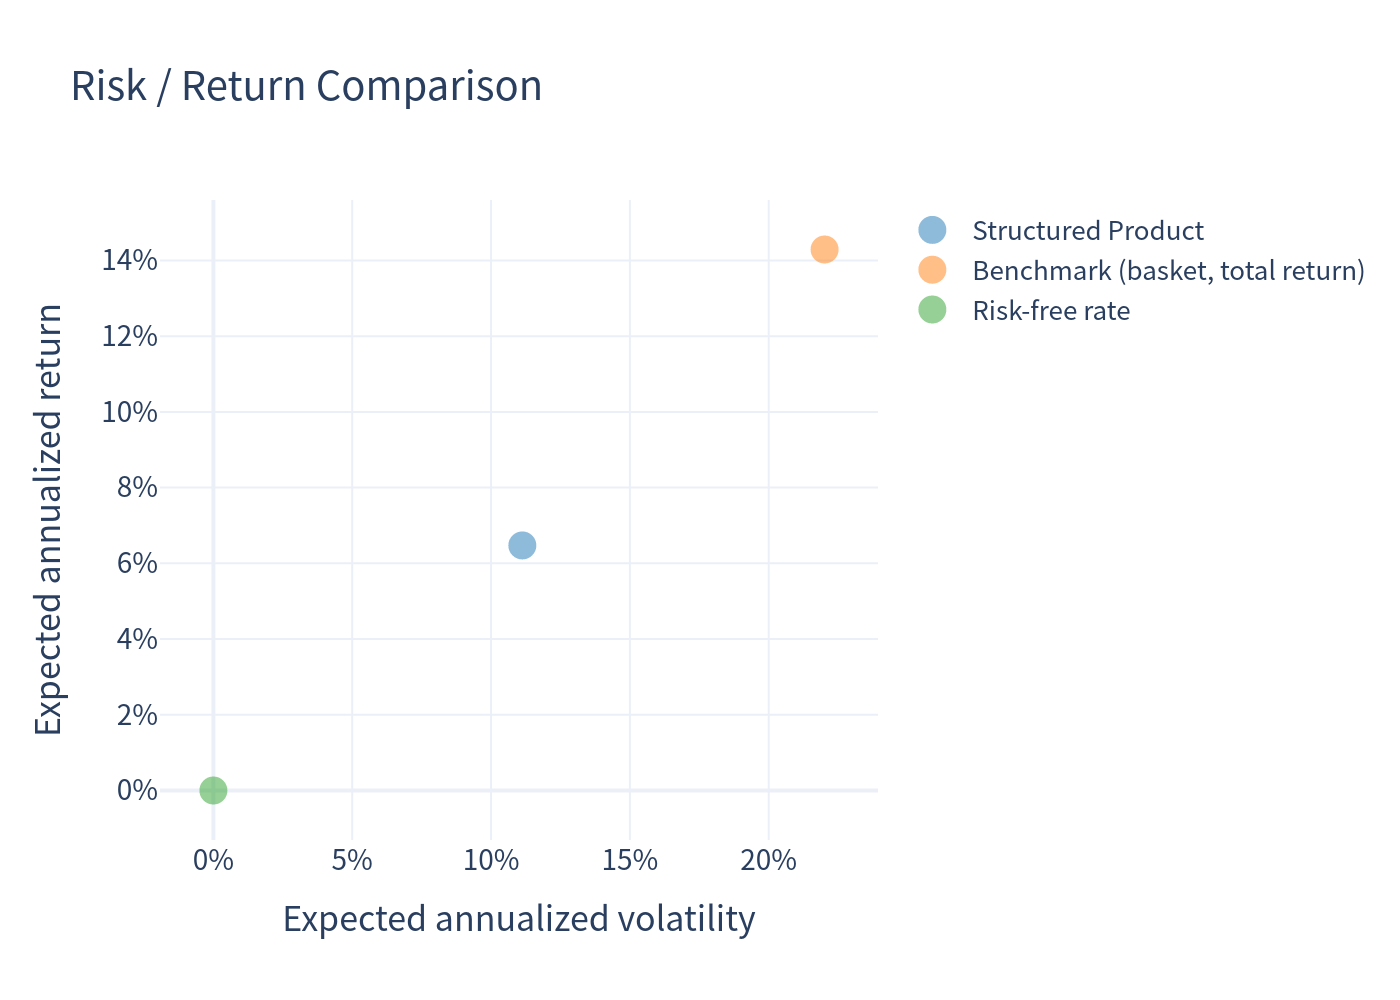
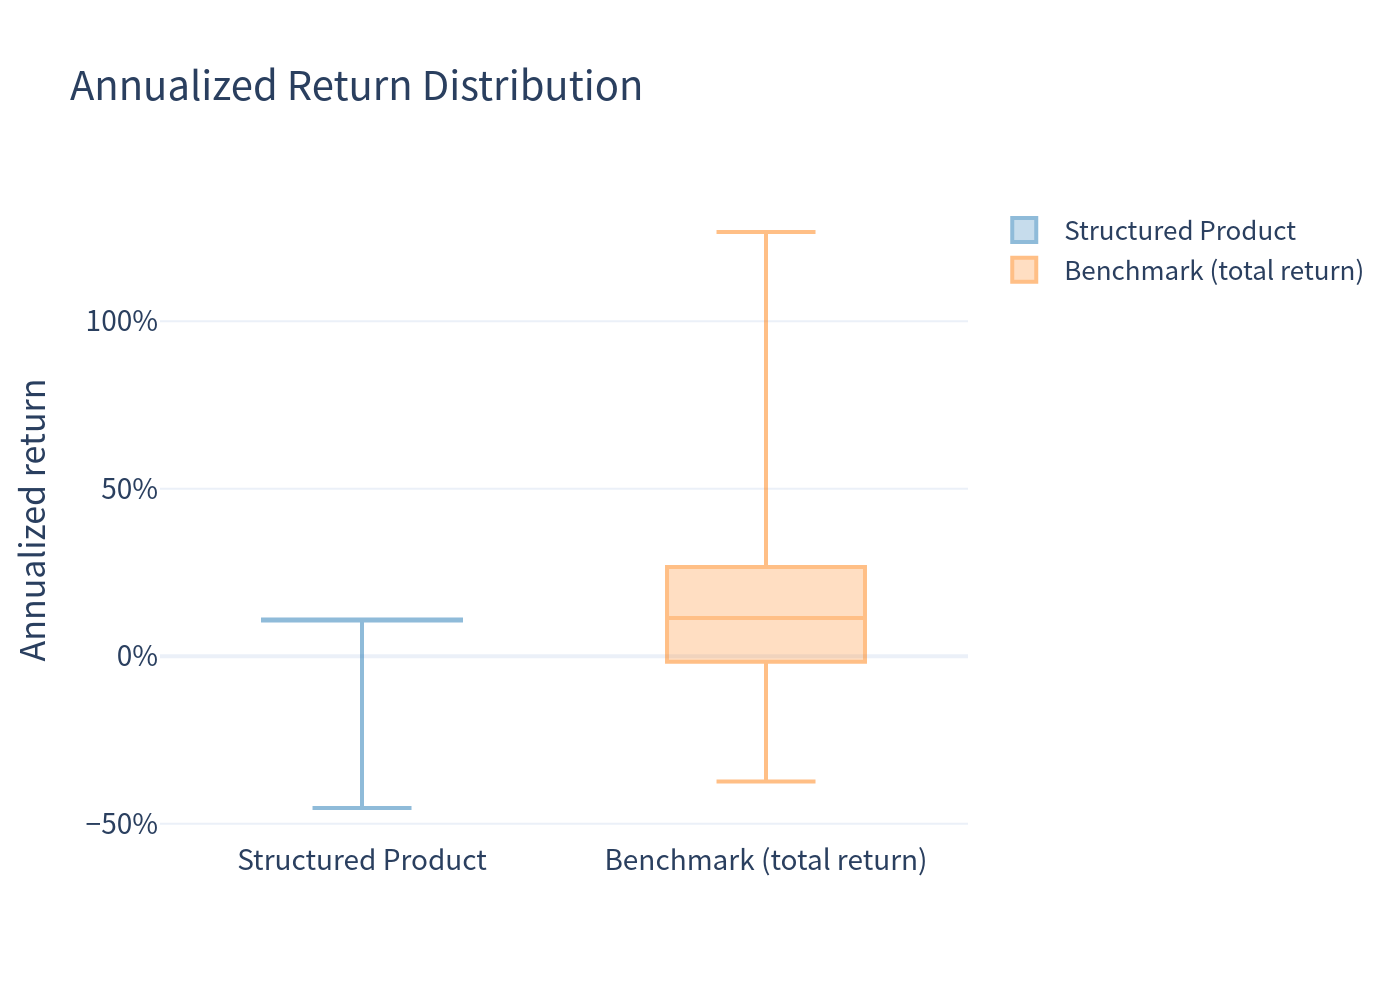
The product sits closer to the risk-free rate: materially lower expected volatility (11.13% vs 22.01%) and a lower loss probability, at the cost of a lower expected return.
Scenario probabilities
Probability of the key scenario outcomes across all simulated paths.
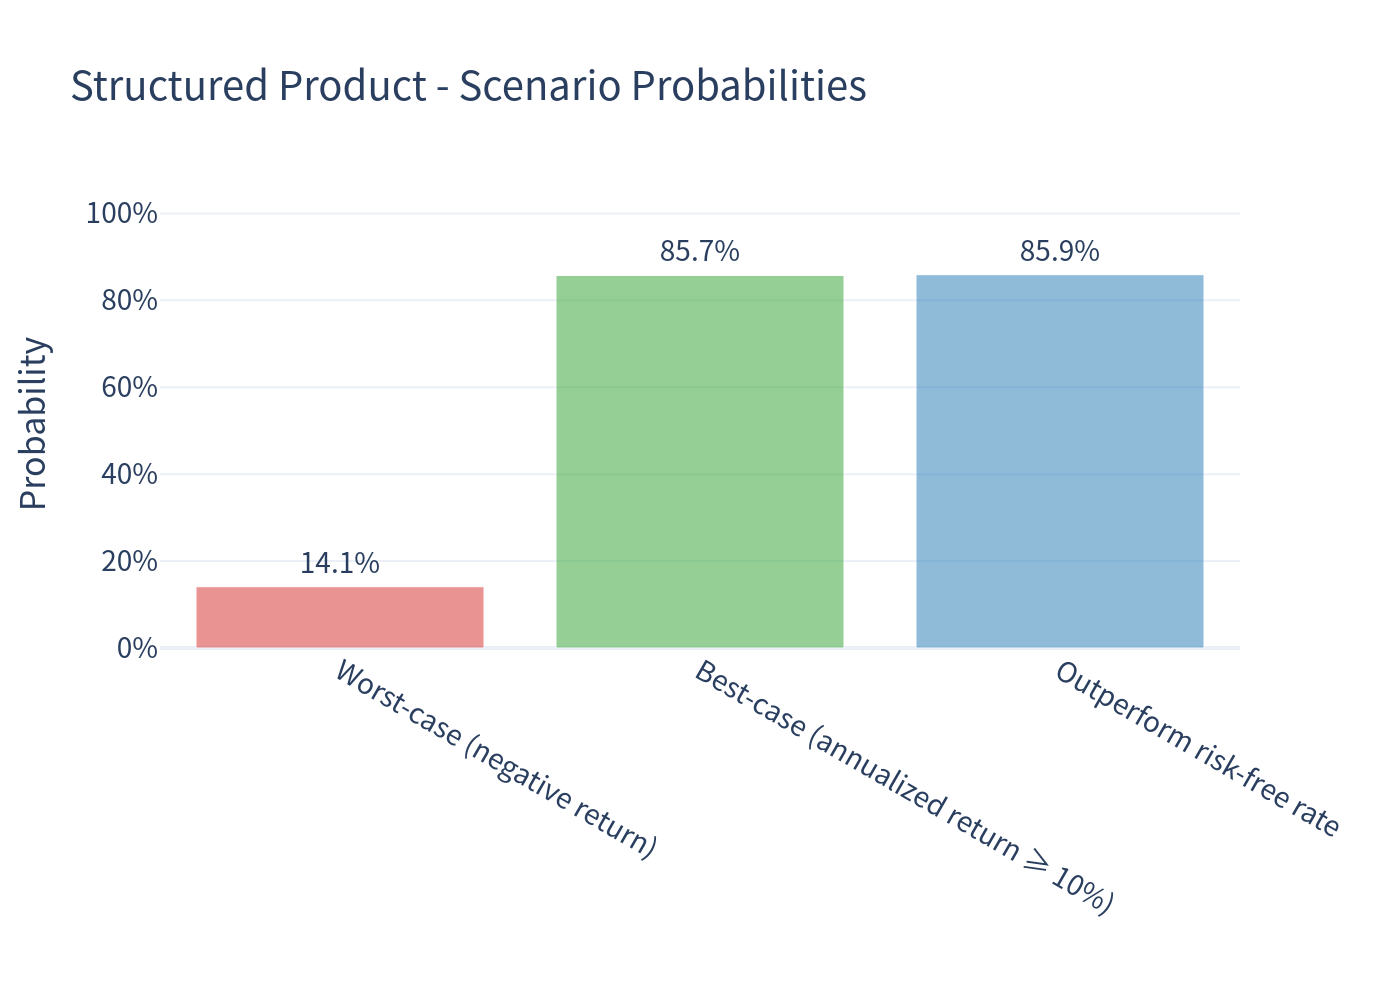
- Worst-case (negative return): 14.10%
- Best-case (annualized return ≥ 10%): 85.72%
- Outperform the risk-free rate (~0%): 85.90%
Holding period and coupons
Breakdown of realized holding periods and the number of coupons received per simulated path.
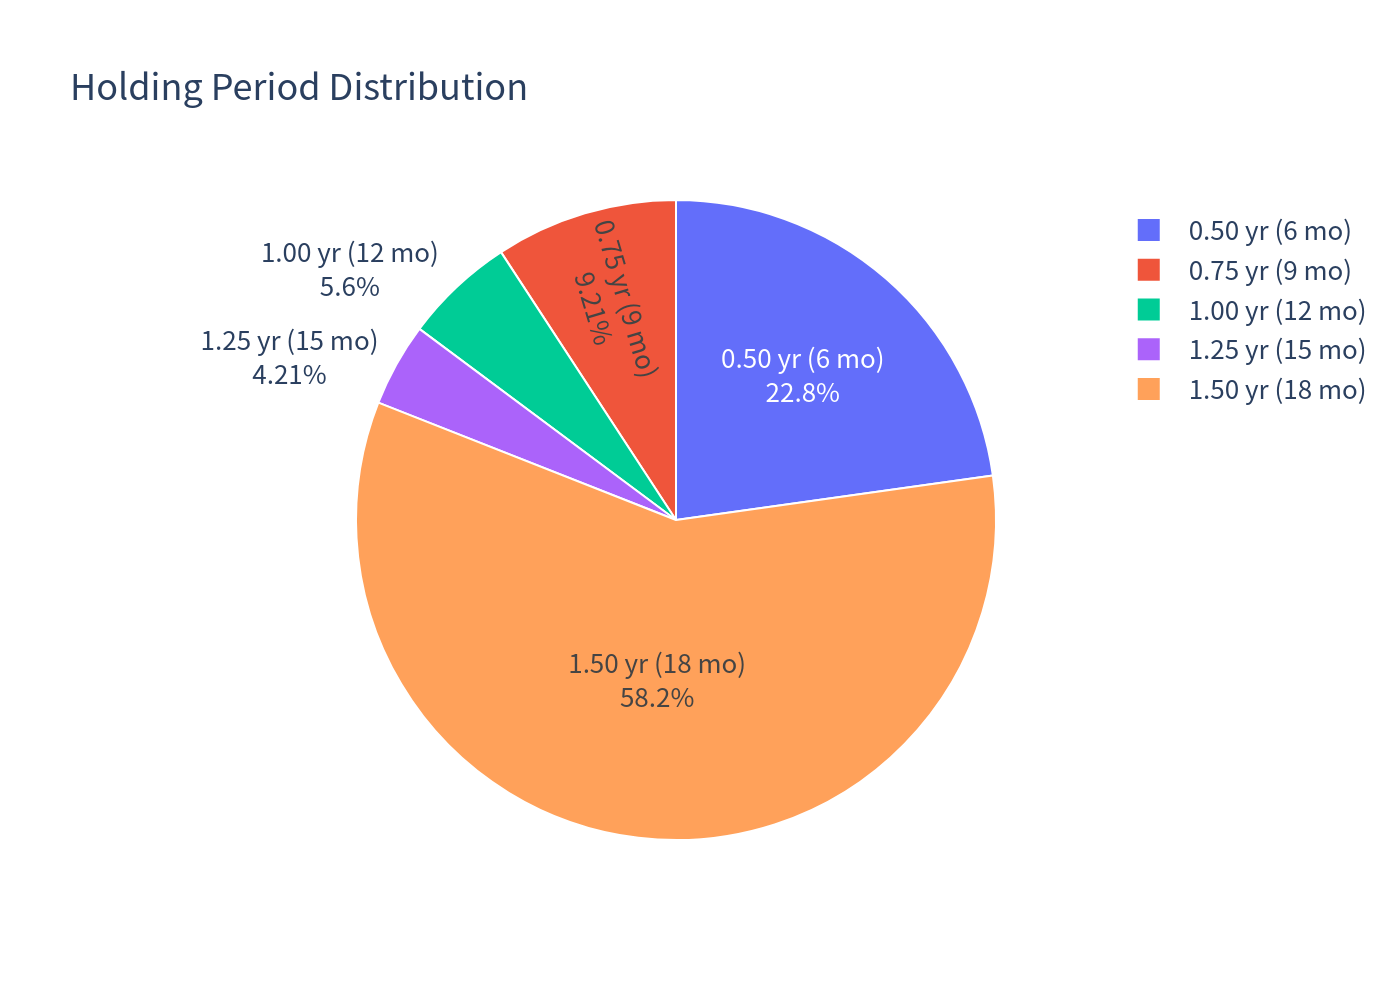
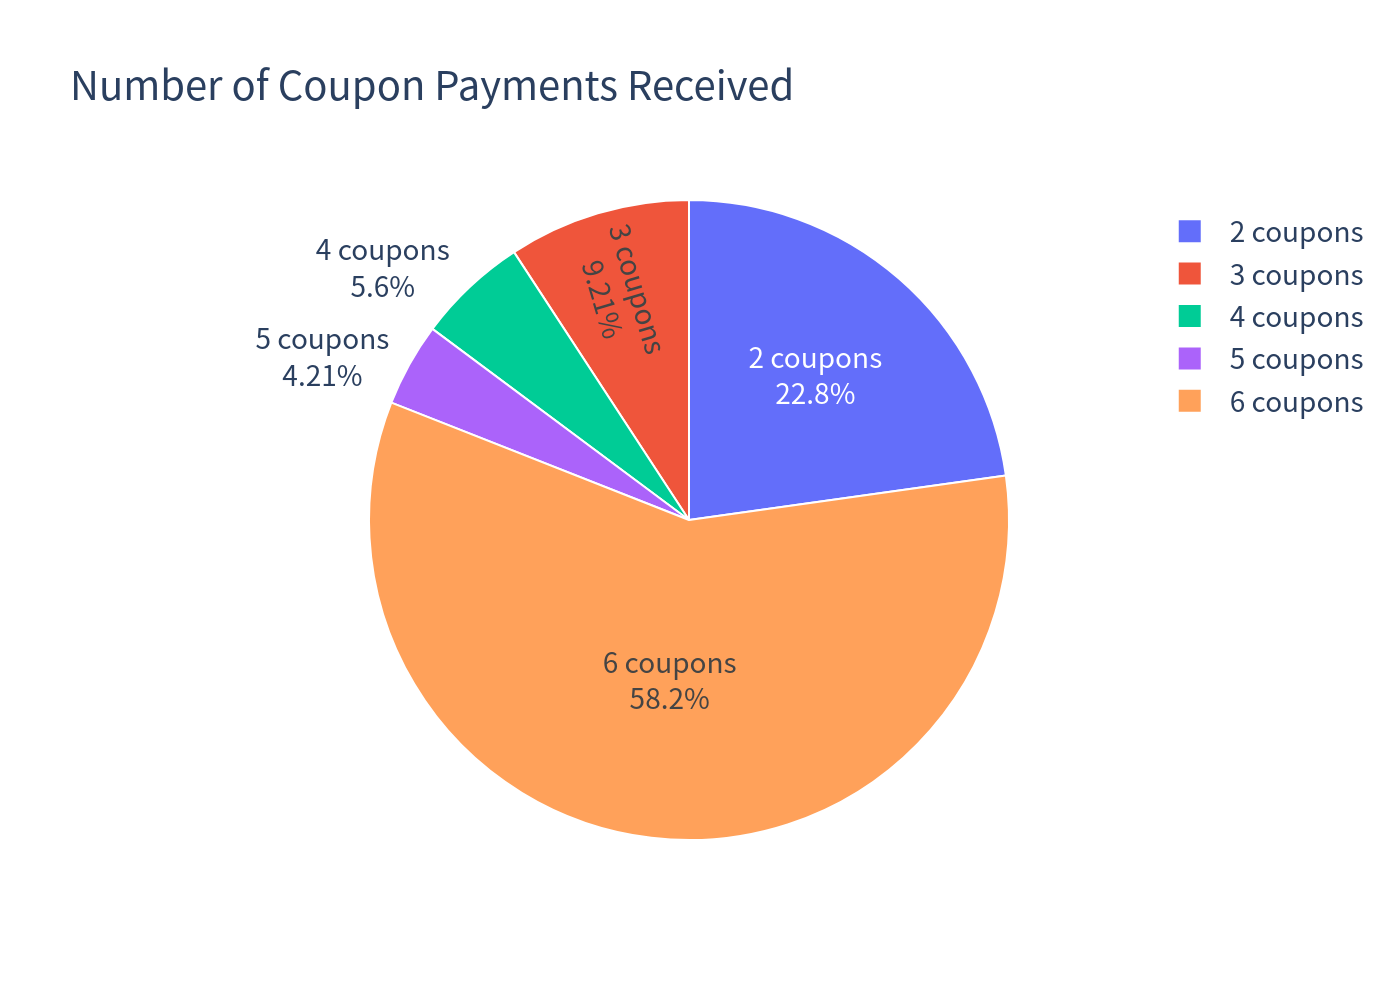
About 58% of simulations run the full 18 months (6 coupons) while about 42% are called early. The most frequent early call is at month 6 (22.78% of paths), followed by months 9 (9.21%), 12 (5.60%) and 15 (4.21%).
Investment Commentary
Potential strengths
- Attractive, unconditional income: the 11.00% p.a. coupon is paid while the note is alive regardless of the three shares' performance — a meaningful pickup over the ~0% CHF risk-free rate.
- Deep conditional protection: the 55% continuous barrier means losses are limited to a minority of paths (14.10% loss probability). A barrier breach (14.90% of paths) is necessary but not sufficient for a loss, since the worst performer can still recover to at least its starting level by maturity.
- Lower risk profile than the shares: expected annualized volatility of 11.13% versus 22.01% for the equal-weight basket, with an ~86% chance of beating cash.
Risks to keep in mind
- Upside is fully capped while downside is retained past the barrier; in rallies the note forgoes the shares' gains (as the box plot and histograms show, the benchmark has a much richer right tail).
- Worst-of dependence: any single underlying touching 55% removes protection, and the redemption then tracks the weakest performer — a concentrating, not diversifying, exposure.
- Deceptively deep tail: the 99% VaR of -31.24% is worse than the benchmark's -24.32%, because the barrier converts a moderate drawdown into a leveraged loss on the weakest share.
- Callability: the issuer is assumed to call when the worst-of is back at par; this truncates the coupon stream after rallies and can leave you reinvesting at lower rates.
- Issuer credit risk: returns depend on Leonteq Securities AG (rated BBB-).
A sizeable share of paths are called early (often after rallies), so annualized figures for short holding periods are amplified by the linear-annualization convention. Reading total return (6.47% expected over an average holding of ~1.17 years) alongside the holding period gives a more balanced picture. The benchmark's headline annualized figure is likewise lifted by this effect; measured unconditionally over the full 18 months the basket's expected price total return is about 9.9% (≈5.9% annualized), to which an average 2.24% dividend yield can be added.