
Market-Linked Certificate of Deposit — Simulation & Risk Analysis
Headline Results
| Metric | Value |
|---|---|
| Expected annualized return | 5.27% |
| Expected total return (5-yr holding) | 30.79% |
| Probability of negative return | 0.00% |
| 99% confidence VaR (1 year) | 0.00% |
| Expected holding period | 5.0 years |
This principal-protected Certificate of Deposit linked to the worst performing of the Russell 2000® and S&P 500® indices offers FDIC-insured principal protection with capped upside participation. Simulation over 10,000 paths shows investors receive only their principal back in 22.14% of scenarios, reach the maximum payoff in 43.43% of scenarios, and outperform the risk-free rate in 65.11% of scenarios.
Basic Product Information
How it works (layman's explanation)
You deposit $1,000. The CD pays no interest along the way. After 5 years (August 2031), the payoff depends on how the two stock indices performed from their starting levels (set August 2026):
- If BOTH the Russell 2000 and the S&P 500 finish ABOVE their starting levels, you receive your $1,000 back plus 100% of the gain of the worse-performing index (the one that rose the least), up to a maximum payment of $1,480–$1,530 per CD (a +48% to +53% return).
- If EITHER index finishes AT or BELOW its starting level, you receive only your $1,000 back — a 0% return for 5 years.
Because the payoff is based on the worst performer, the two indices provide no diversification benefit: a decline in either one caps the outcome at zero return. The deposit amount is insured by the FDIC up to applicable limits.
| Key Term | Detail |
|---|---|
| Issuer | Morgan Stanley Bank, N.A. |
| Underlyings | Russell 2000® Index, S&P 500® Index (worst-of) |
| Deposit amount | $1,000 per CD |
| Tenor | ~5 years (issued Aug 2026, matures Aug 2031) |
| Participation rate | 100% |
| Upside cap | 48%–53% total (assumed 50.5% in simulation) |
| Coupon | None (no periodic interest) |
| Early redemption | None (held to maturity) |
Key Statistics — Structured Product vs Underlying
| Metric | Structured Product | Underlying Basket (total return)* |
|---|---|---|
| Expected annualized return | 5.27% | 9.35% |
| Expected annualized volatility | 3.59% | 8.27% |
| Probability of loss | 0.00% | 13.30% |
| 99% confidence VaR (1 year) | 0.00% | -11.04% |
*Equal-weight basket of the Russell 2000 and S&P 500 price indices plus dividends.
The structured product delivers a lower expected return than direct equity exposure (5.27% vs 9.35% annualized) but with dramatically lower risk: zero probability of loss (principal protected) and one-third the volatility. The cost of this protection is forgoing upside above the cap and accepting a 22.14% probability of receiving only the principal (a 0% return over 5 years).
Simulation Outcomes
Scatter Plot — Product vs Underlying Return
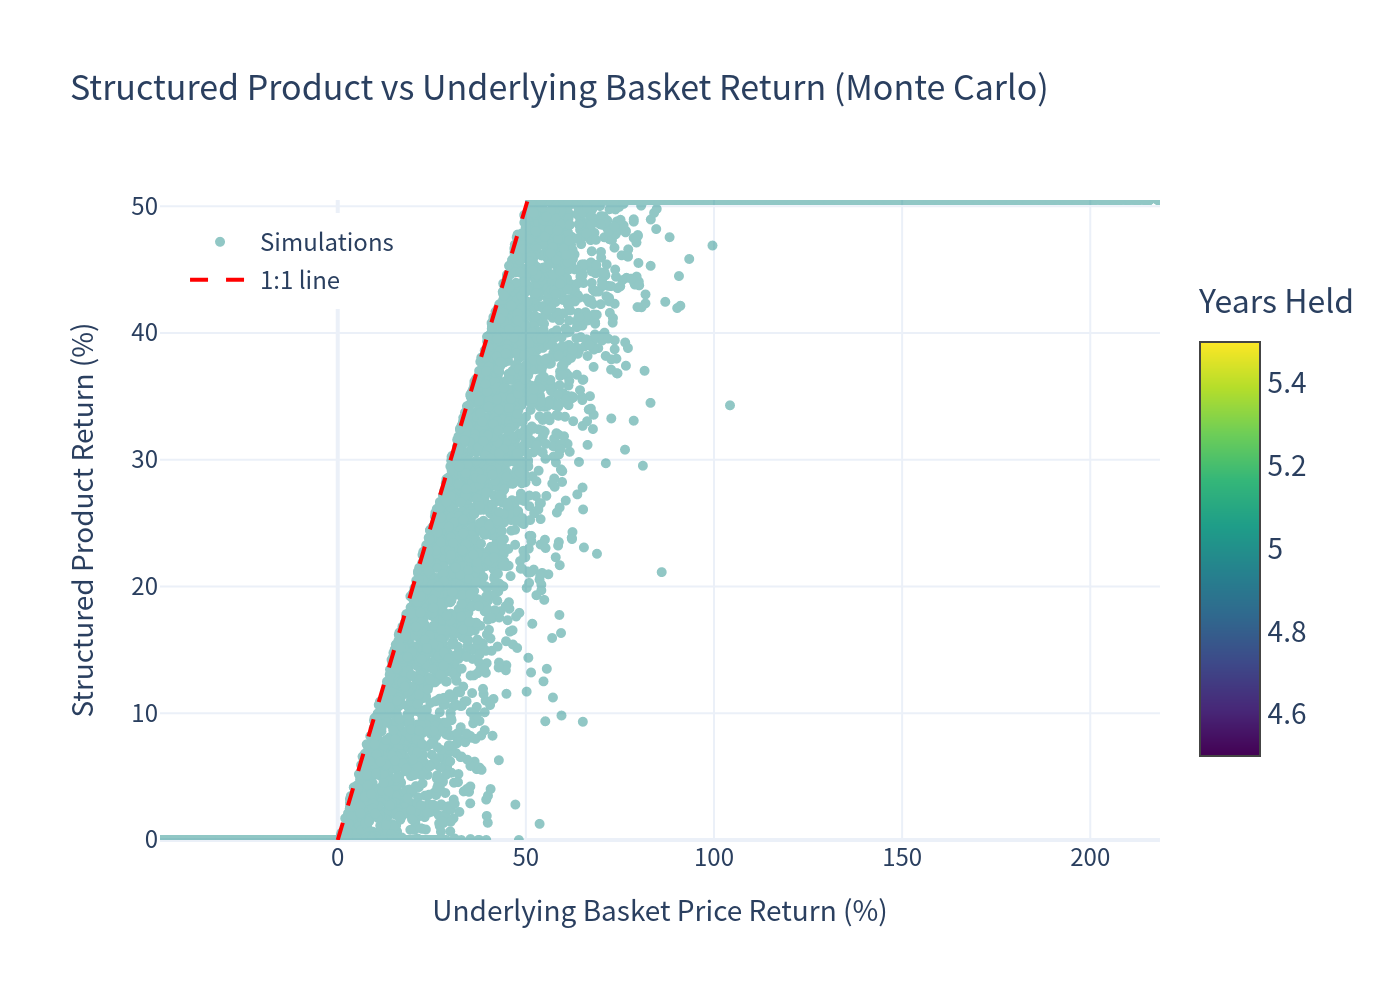
Each point is one simulated 5-year outcome. The product return (y-axis) is floored at 0% (principal protection) and capped at 50.5%, while the underlying basket return (x-axis) spans a wide range. Points cluster along the 0% floor and 50.5% cap lines, illustrating the payoff's asymmetric shape.
Annualized Return Distributions
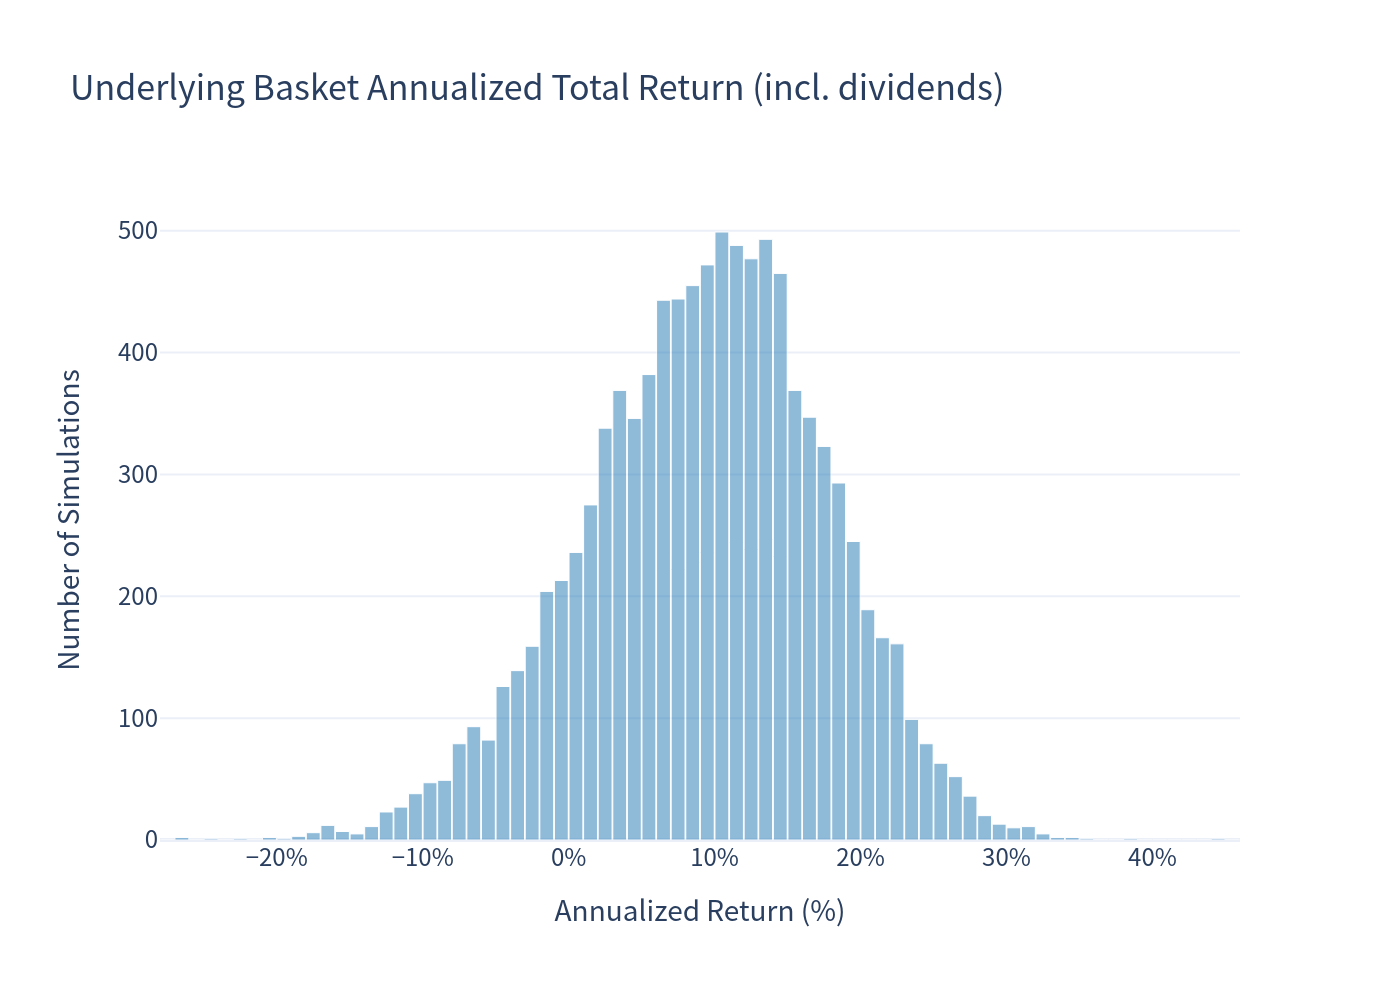
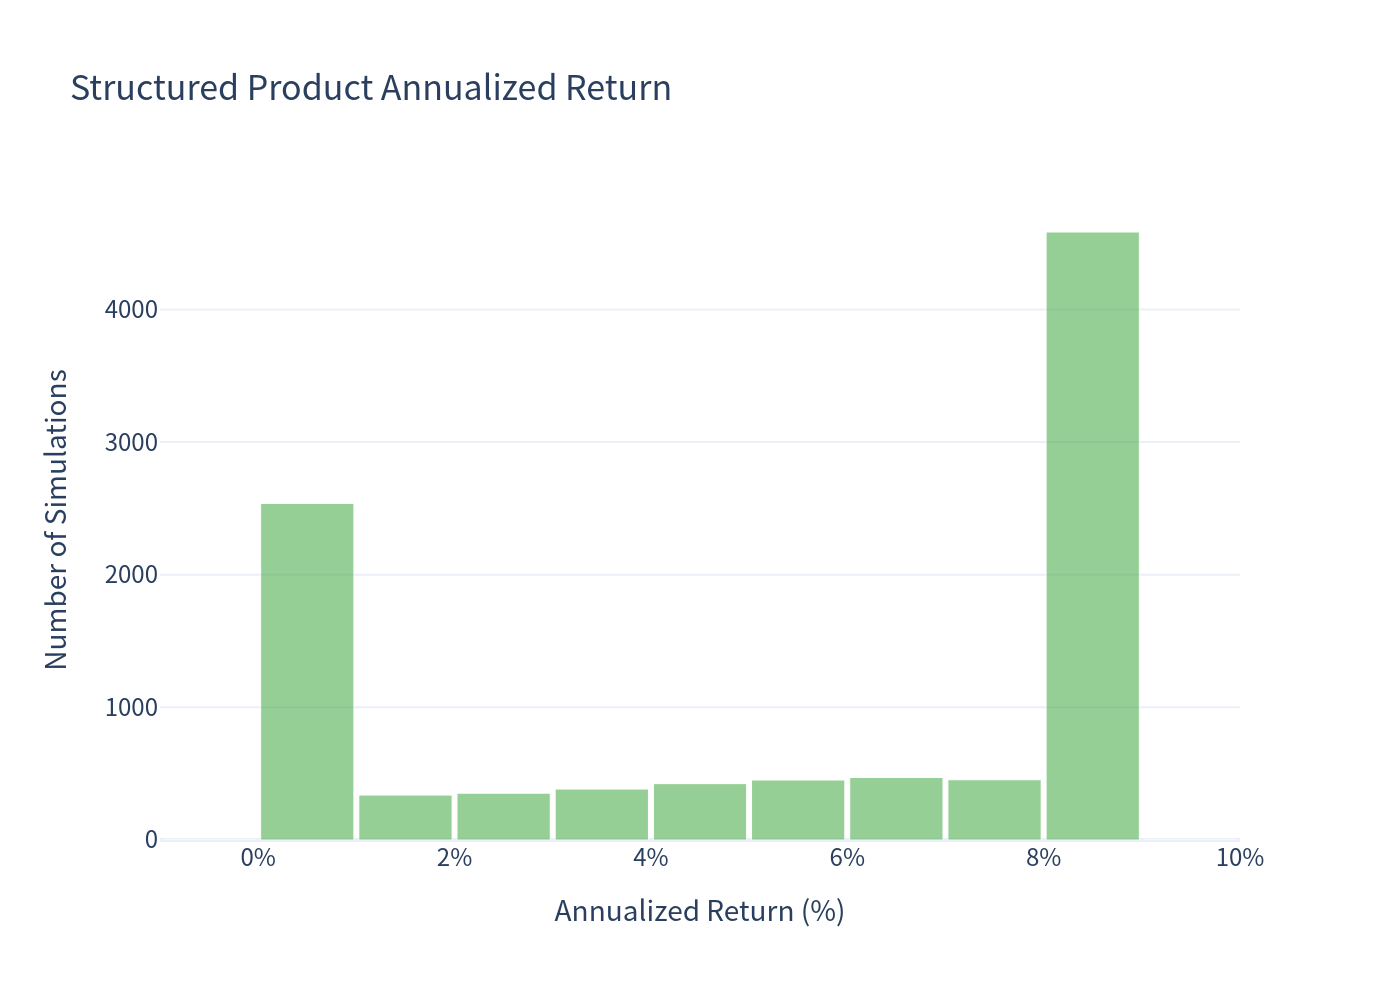
The underlying basket's annualized returns (top) are roughly symmetric around ~9.4% with meaningful downside. The product's annualized returns (bottom) are heavily concentrated at 0% (principal-only outcomes) and at the cap (~8.5% annualized), reflecting the digital, protected payoff profile.
Scenario Probabilities
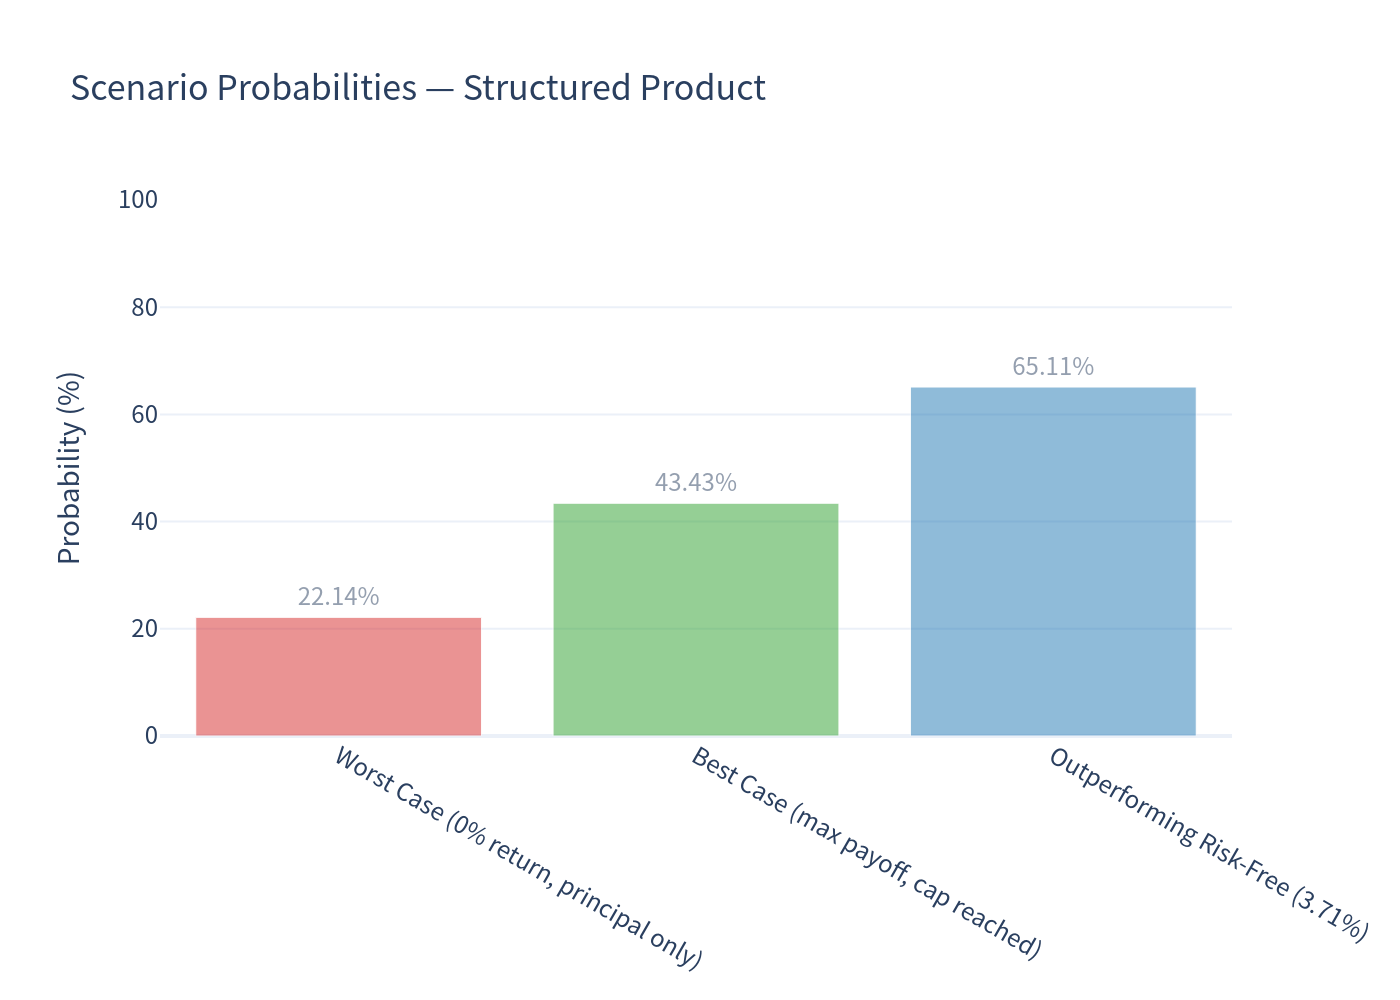
- Worst case (0% return, principal only): 22.14%
- Best case (maximum payoff reached): 43.43%
- Outperforming risk-free rate (3.71% annualized): 65.11%
Risk / Return Profile
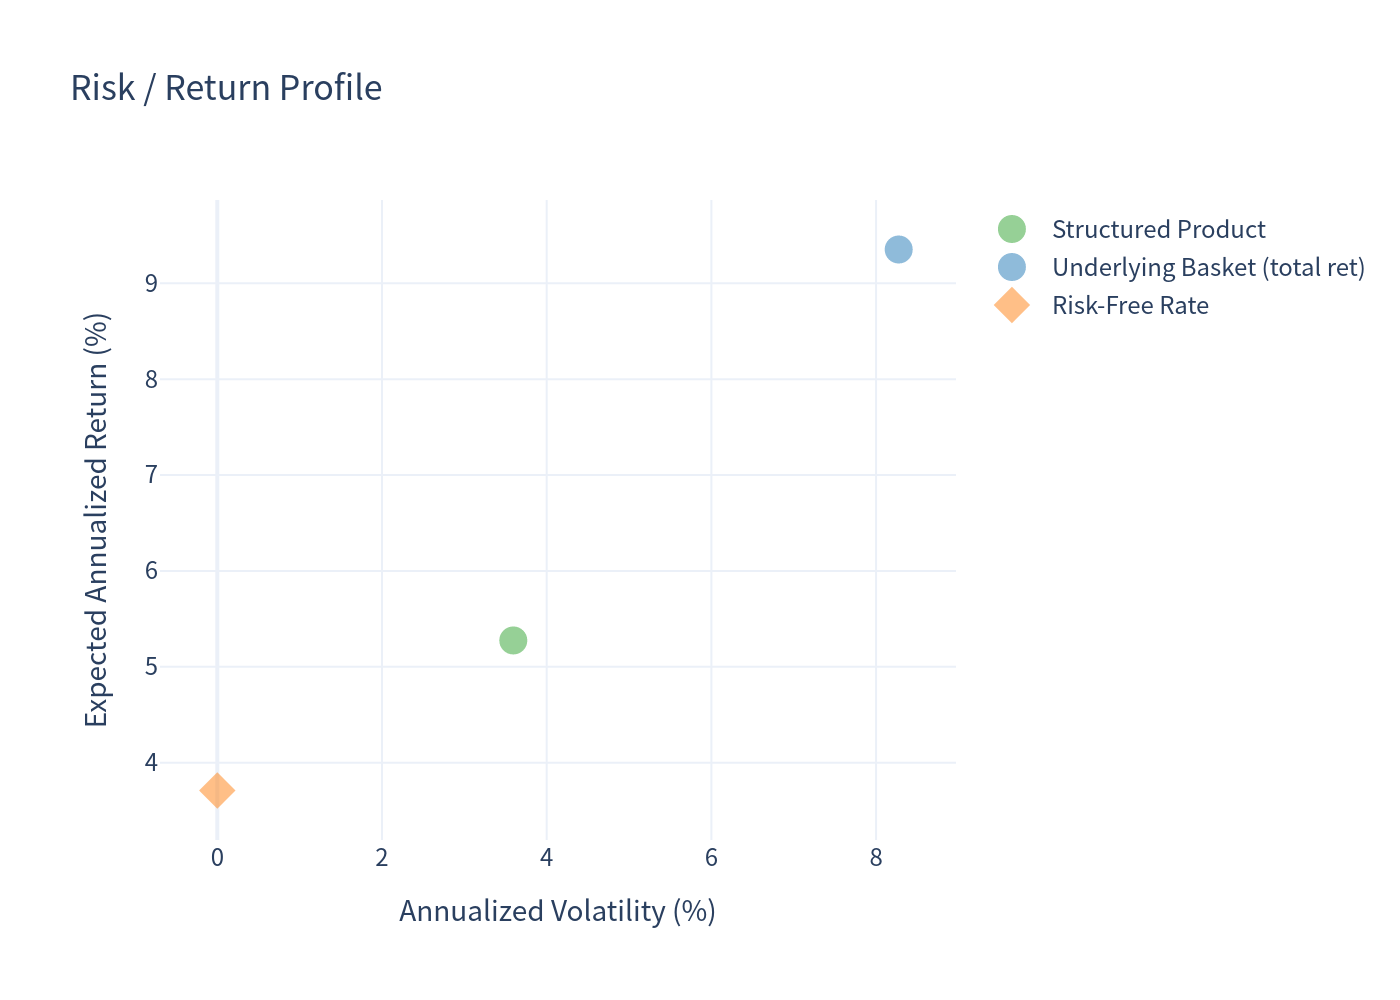
The product sits at a lower expected return and lower volatility than the underlying basket, while the risk-free rate offers 3.71% with zero volatility.
Return Distribution Comparison
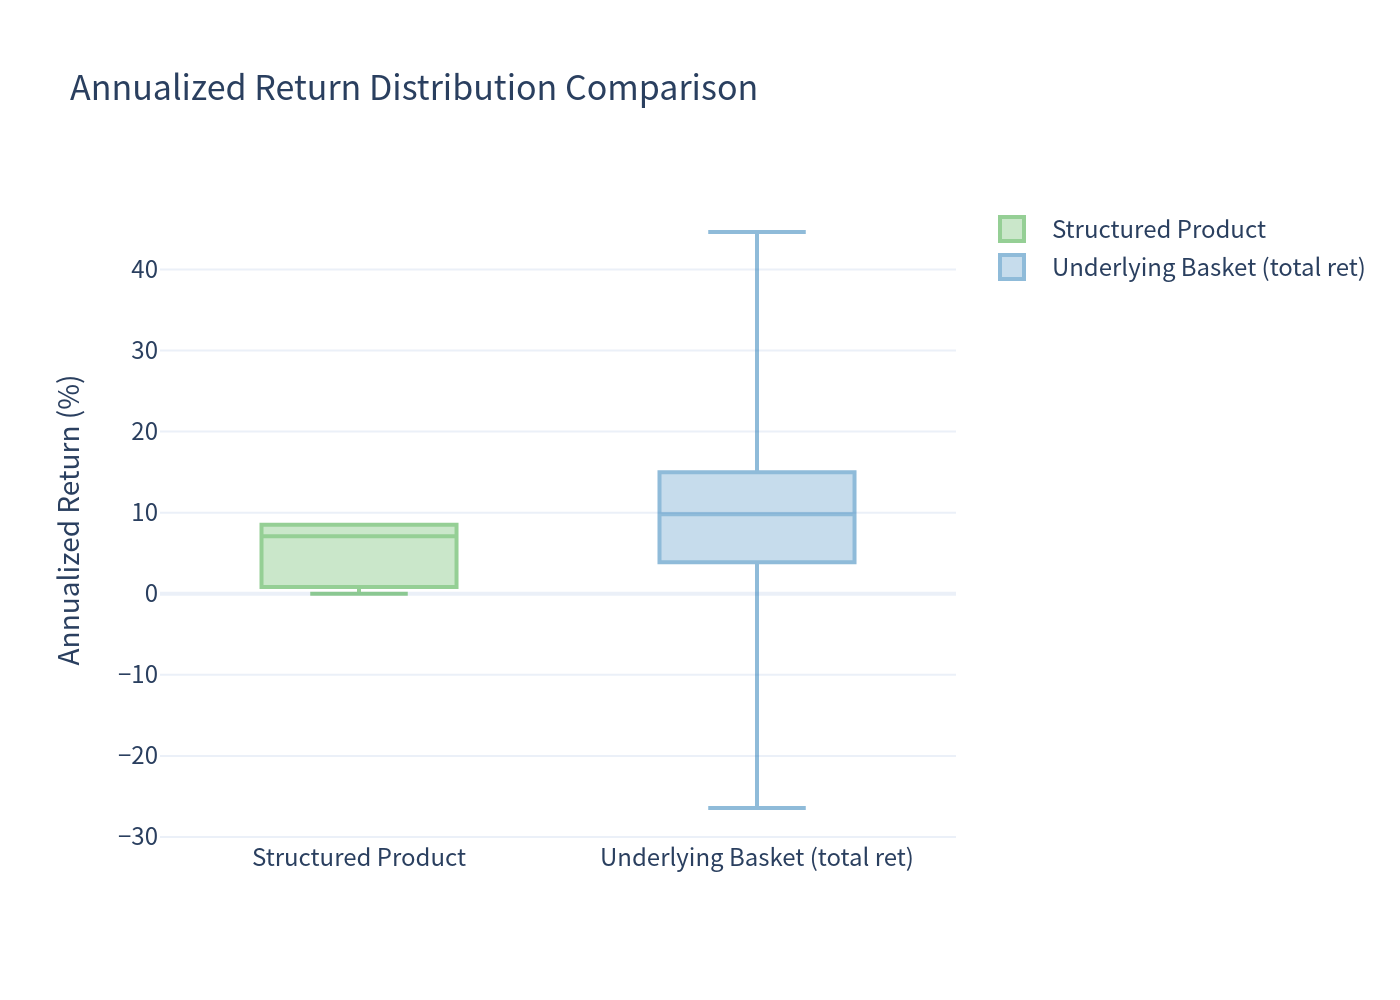
The box plots confirm the product's compressed return range (0% to ~8.5% annualized) versus the wider, negatively-skewed distribution of the underlying basket.
Holding Period & Coupons
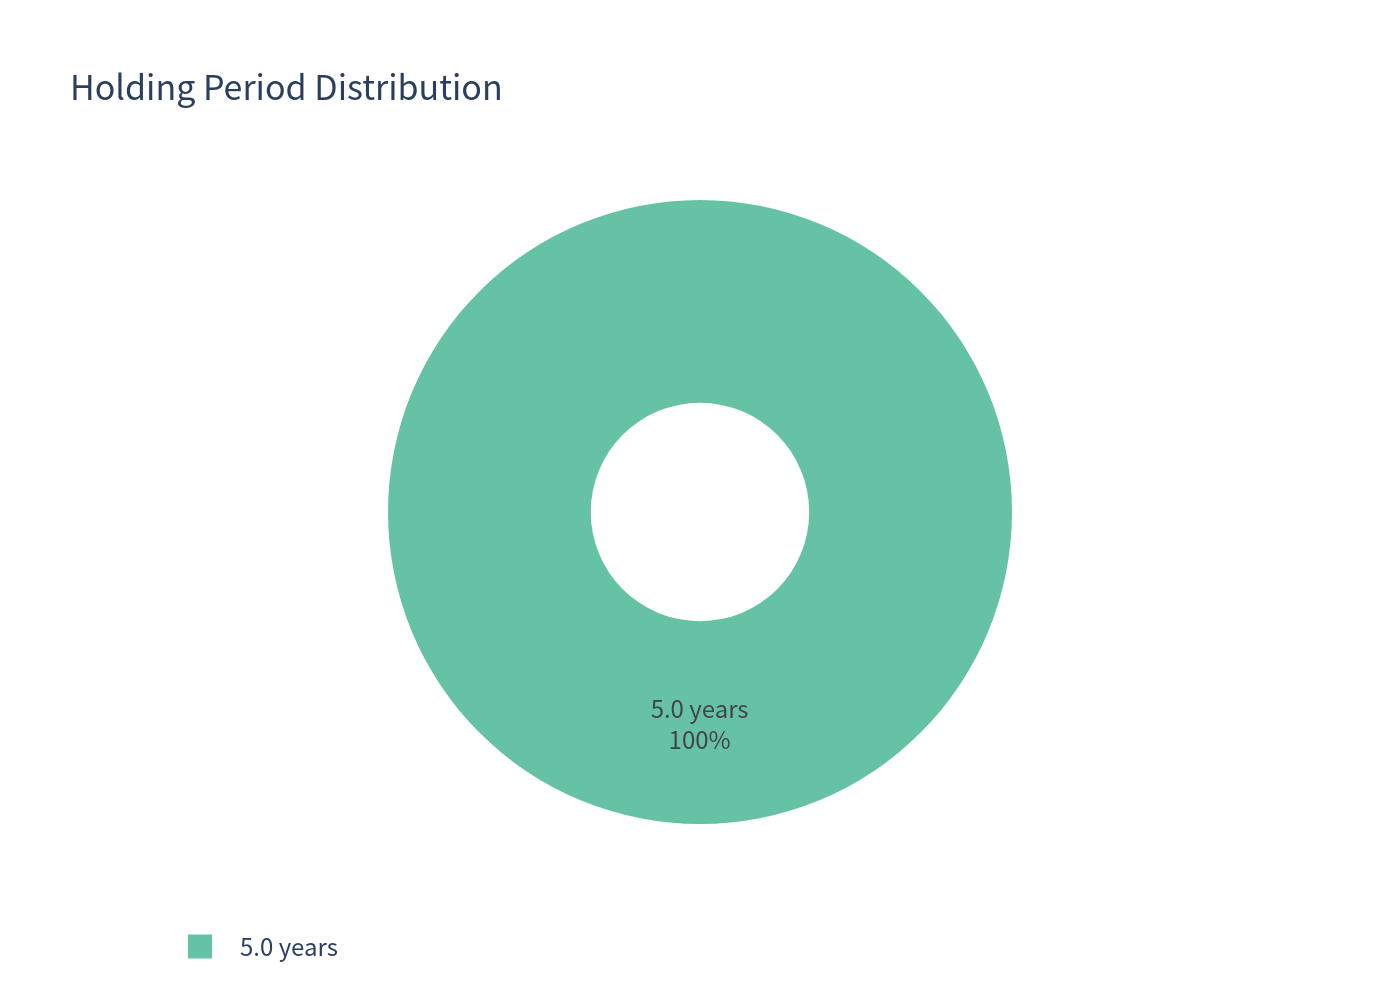
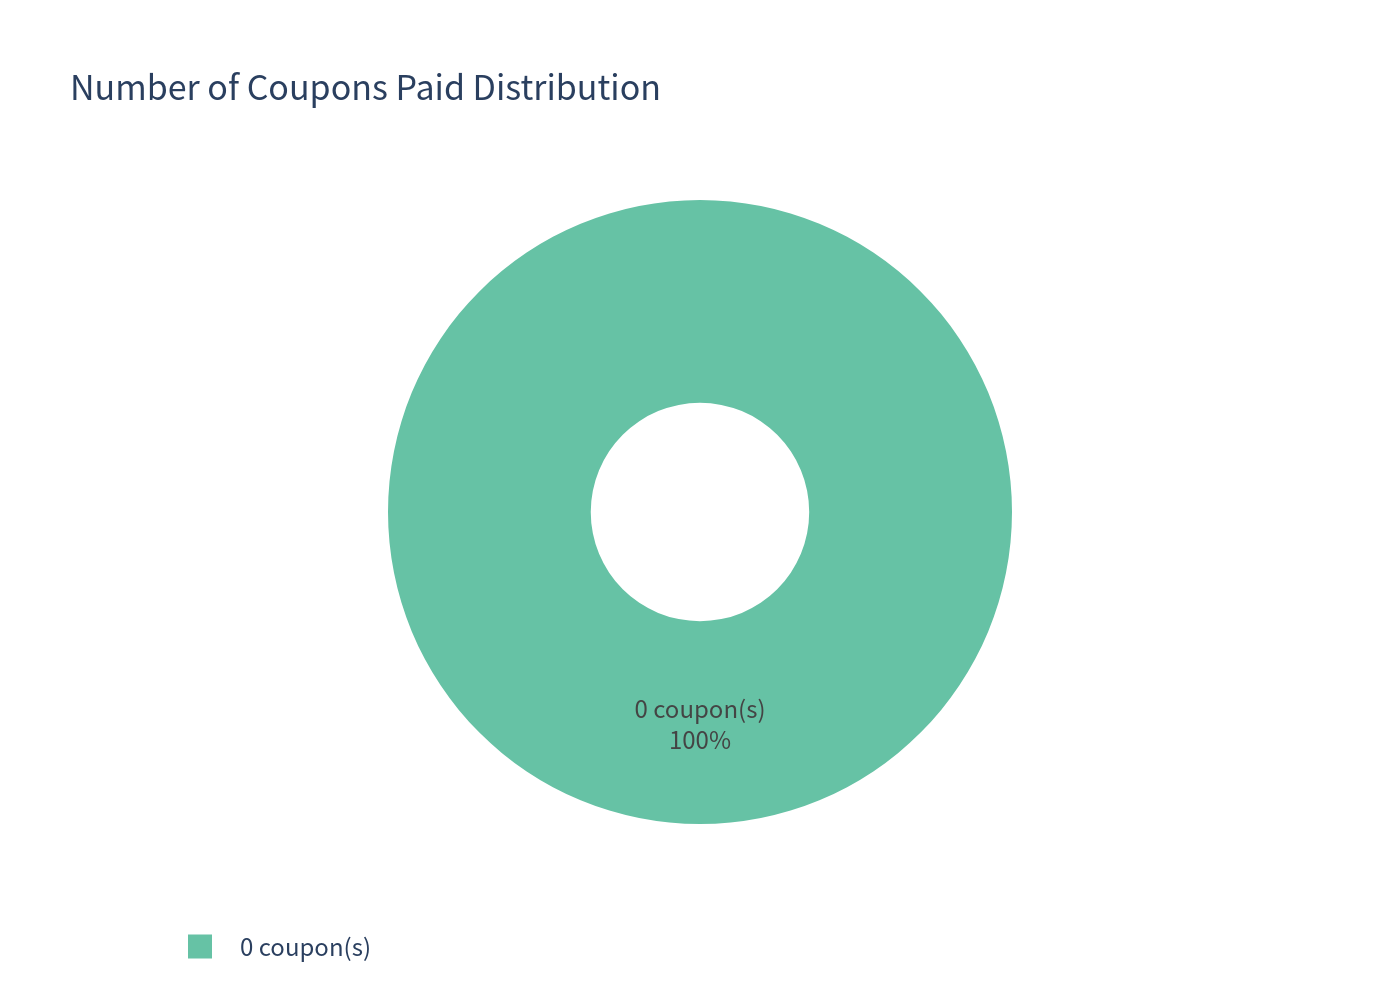
The CD has no early-redemption feature, so it is always held to the full 5-year maturity, and it pays no coupons.
Investment Commentary
Attractive features
- Full principal protection at maturity (FDIC-insured up to $250,000 per depositor), with a 0% probability of loss in the simulation.
- Attractive risk-adjusted profile: expected annualized return of 5.27% with only 3.59% volatility and a 0.00% 1-year 99% VaR — notably better than the risk-free rate of 3.71% in the majority (65.11%) of scenarios.
- Meaningful upside participation: in 43.43% of scenarios the maximum payoff (+50.5%) is reached, and the median total return is 40.86%.
Considerations
- No current income: the CD pays no interest for 5 years; a 0% outcome underperforms a conventional CD and loses purchasing power to inflation.
- Opportunity cost vs direct equity: expected return (5.27% annualized) is well below the underlying basket's 9.35% — the cap and worst-of structure trade away upside.
- 22.14% probability of a flat outcome (both indices must finish above starting levels for any return), and upside is hard-capped.
This analysis is for informational purposes only and does not constitute financial advice or a suitability assessment.
Simulation assumptions: 10,000 Monte Carlo paths over 60 months; upside cap assumed at 50.5% (midpoint of the stated 48%–53% range); risk-free rate 3.71% (1-year U.S. Treasury average); product payouts based on underlying price indices with dividends added only to the benchmark comparison; no fees or commissions modeled.