
Worst-of NDX, RTY and SPX Trigger PLUS due February 4, 2031
Headline Simulation Results
The product participates in the upside of the worst-performing of three equity indices with 400% leverage, but only up to a hard cap of 173.5% of principal. It offers a 30% downside buffer, beyond which the investor takes 1:1 downside. In a strong market (58% of scenarios) the product hits its cap and its return is truncated; the headline expected return therefore sits below the equal-weight basket's expected annualized total return of 9.08%.
How It Works (Layman Explanation)
- Three indices, worst one decides everything. At maturity, the payoff looks only at whichever of the Nasdaq-100, Russell 2000 or S&P 500 performed the worst over the full term. You get the return of the laggard — not the average, not the best.
- No interest / no coupon. The securities pay nothing along the way; all return comes from the maturity payment.
- Leveraged upside, but capped. If the worst index finishes up, you earn 4x its gain, but your maximum payment is $1,735 (a 73.5% gain) regardless of how much higher the index finishes.
- 30% downside buffer. If the worst index finishes anywhere from 0% down to -30%, you still get your $1,000 back.
- Below -30%, full downside. If the worst index falls more than 30%, losses are 1:1, so a -55% worst index means a -55% product loss.
Key Statistics
| Metric | Structured Product | Underlying (Total Return) | Underlying (Price Only) |
|---|---|---|---|
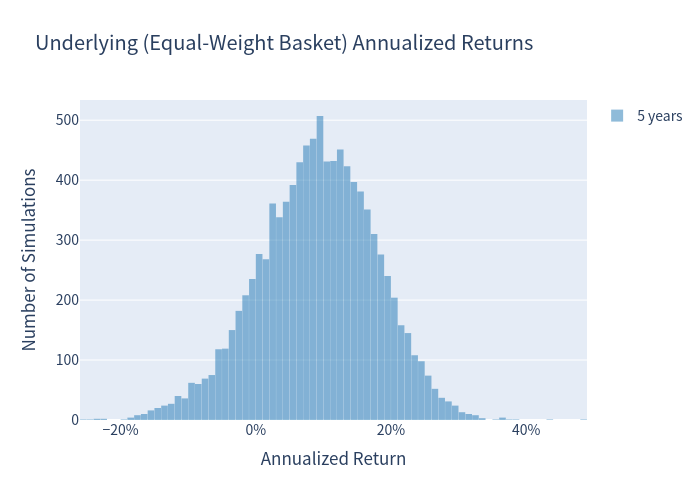
| Expected annualized return | 6.28% | 9.08% | 8.28% |
| Expected annualized volatility | 7.97% | 8.65% | 8.65% |
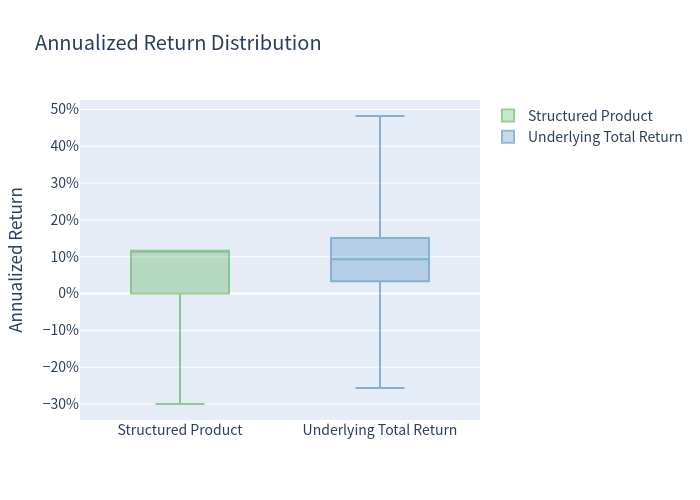
| Probability of loss | 10.85% | 14.70% | 16.79% |
| 99% confidence VaR (1-year) | -18.71% | -12.50% | -13.30% |
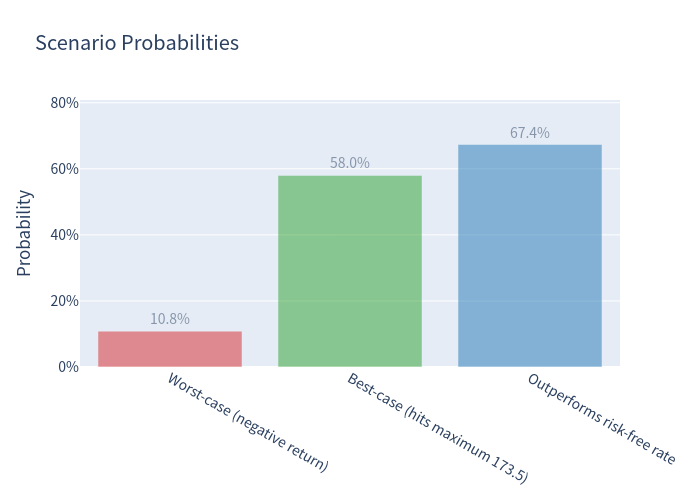
| Probability of beating risk-free rate (3.80%) | 67.36% | - | - |
The “Underlying” column is an equal-weighted basket of the three indices (the comparison benchmark — not the worst-of); total return adds an average dividend yield of ~0.80% p.a. The product is always held for the full 5-year term; there is no early redemption.
Outcome breakdown
| Scenario | Probability |
|---|---|
| Worst index falls below the -30% threshold (principal at risk) | 10.85% |
| Worst index finishes between -30% and 0% (par returned) | 18.23% |
| Worst index finishes at or above 0% | 70.92% |
| Product hits the maximum payment (cap) | 58.01% |
| Product beats the equal-weight basket total return | 30.82% |
Charts
Simulated Outcomes: Product vs Worst-of Underlier
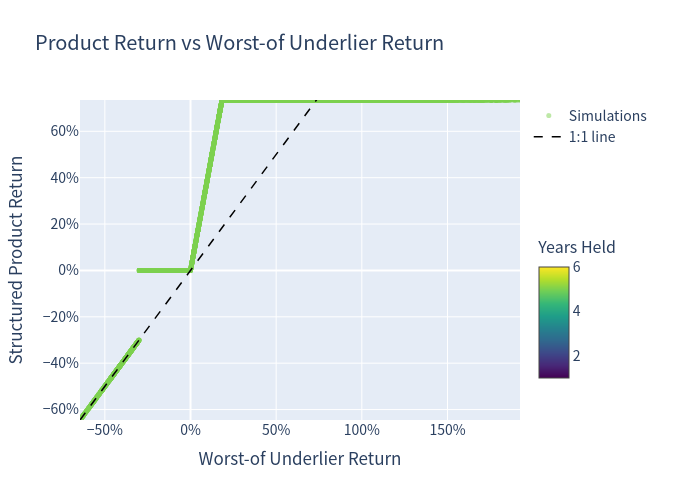
Each dot is one simulation. The payoff structure is clearly visible: a flat plateau at par for worst-index returns between -30% and 0%, a steep 4x-levered segment above 0% that flattens at the 173.5% cap, and a 1:1 line below -30%.
Distribution of Annualized Returns — Underlying Basket
Distribution of Annualized Returns — Structured Product
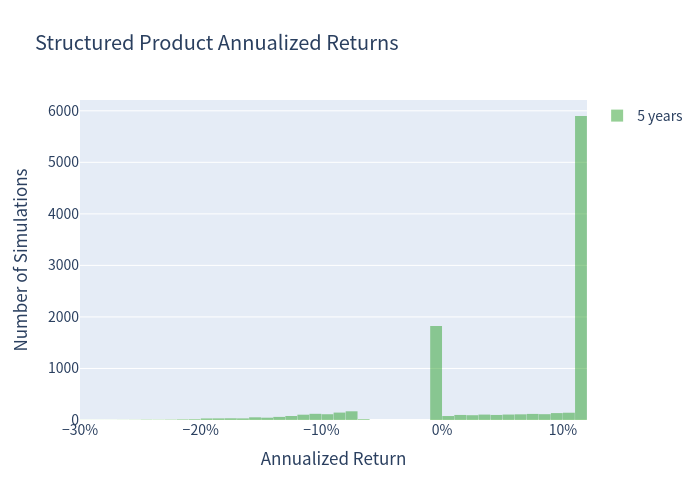
The product's return distribution is packed against the cap: roughly 58% of outcomes land at the maximum annualized return of about 11.65%, producing a sharp spike. Just over a tenth of outcomes sit in the loss region.
Scenario Probabilities
Risk vs Expected Return
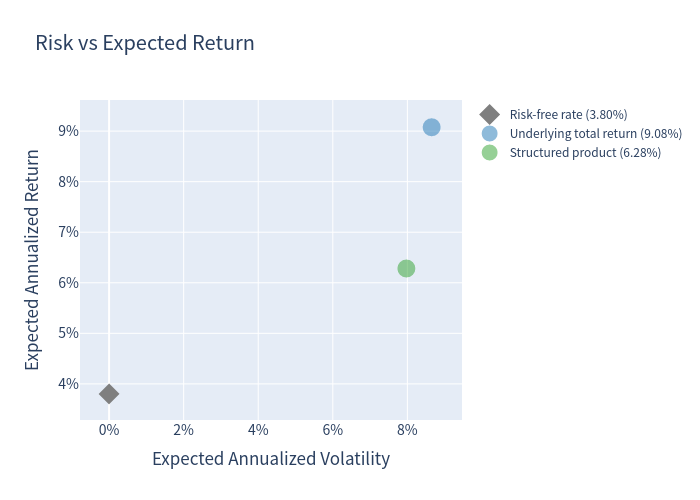
The product offers a slightly lower expected return than the basket but with lower volatility, sitting inside the achievable set relative to the basket.
Annualized Return Box Plot
Investment Commentary
Strengths
- Buffered downside up to -30%: about 19% of scenarios finish with the worst index down but protected, converting what would be a loss into a full return of principal.
- Meaningful leverage on the upside: 4x participation means even a modest +5% move in the worst index produces a +20% return.
- Higher probability of avoiding a loss than the basket (10.85% vs 14.70%) and a lower expected volatility (7.97% vs 8.65%).
- Favorable odds versus cash: 67% of scenarios beat the 3.80% risk-free rate.
Trade-offs to weigh
- Capped upside: the 173.5% cap is reached at just +18.4% on the worst index, so 58% of simulations give up substantial further upside.
- Worst-of linkage lowers the effective participation: the leveraged return is applied to the weakest of the three indices, so the upside reference is structurally lower than the basket's average, and the left tail is fatter — the product's 99% VaR (-18.71%) is materially worse than the basket's (-12.50%). (Note: because the cap requires all three indices to exceed +18.4%, it actually binds less often than a comparable single-index note.)
- No coupon / no income: the product pays nothing until maturity five years out.
- Expected return below the basket: the estimated-value discount and the cap pull the expected annualized return (6.28%) below the equal-weight basket's (9.08%).
All figures are simulation-based estimates (10,000 Monte Carlo paths) and are subject to the issuer's credit risk. Past or simulated performance is not indicative of future results.