
12.50% p.a. Multi Barrier Reverse Convertible on Kardex, Komax & Stadler Rail (CHF)
Headline Simulation Results
Using 10,000 Monte-Carlo simulations of the three underlyings over the product's one-year life:
| Metric | Structured Product | Underlying Basket (3 stocks, equal-weight, total return) |
|---|---|---|
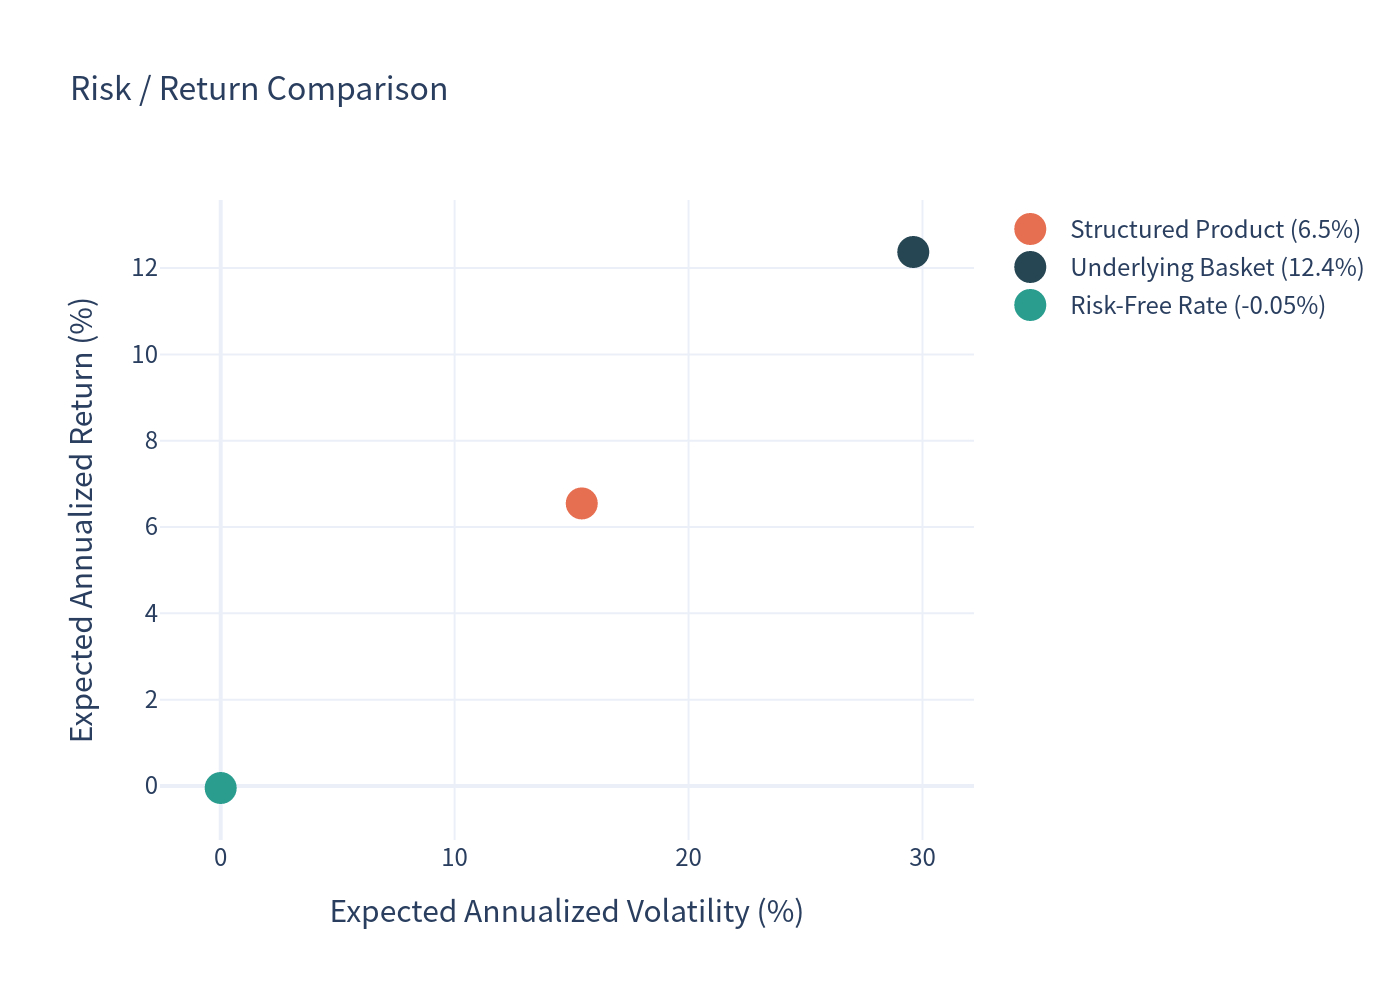
| Expected annualized return | 6.55% | 12.37% |
| Expected annualized volatility | 15.43% | 29.61% |
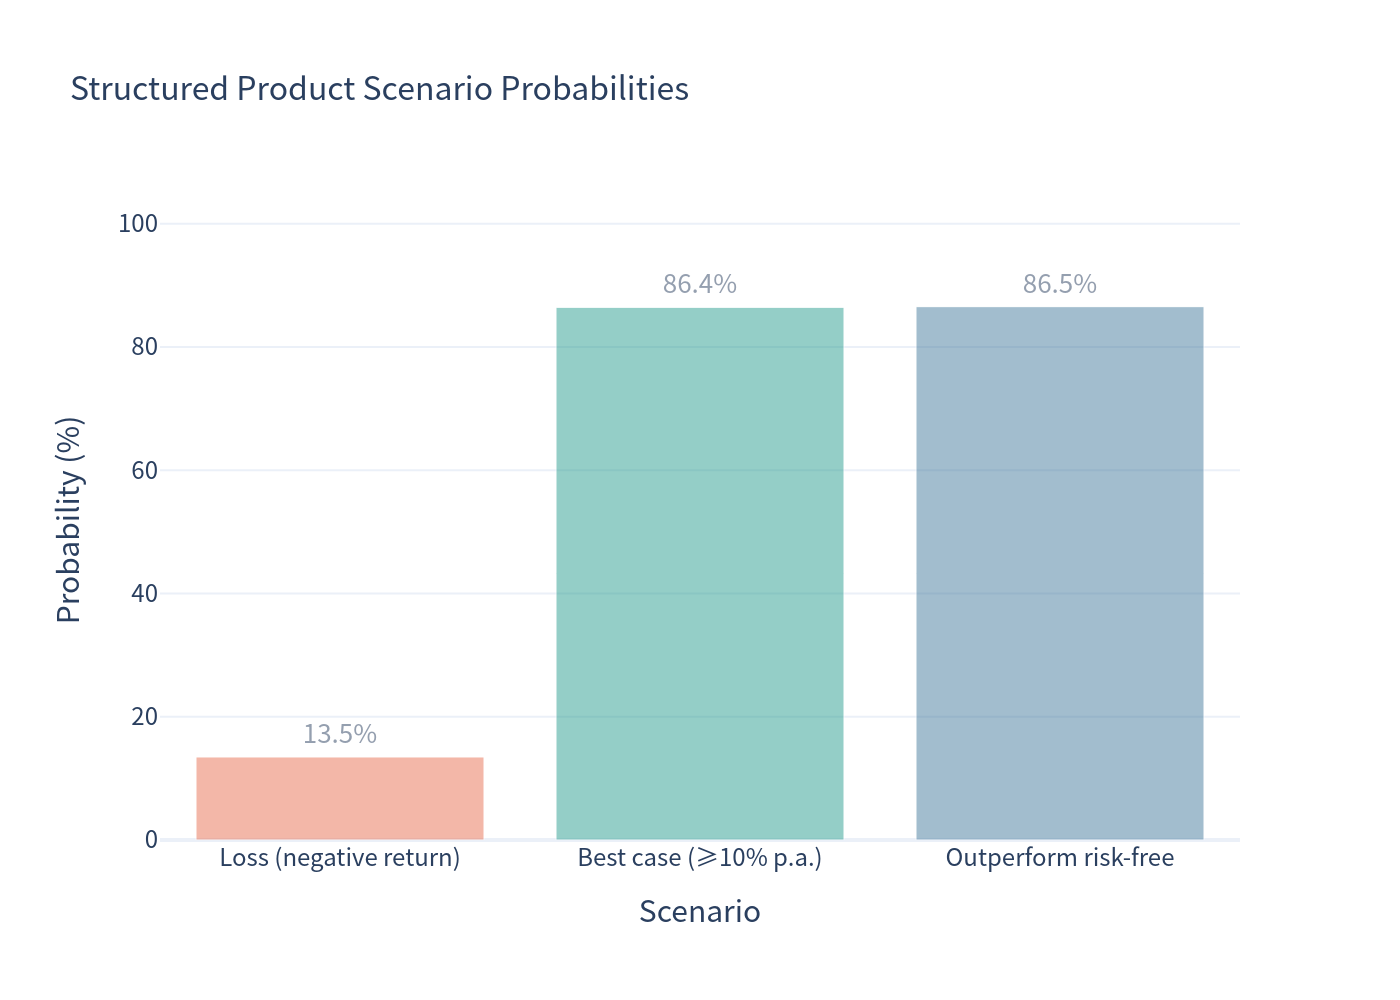
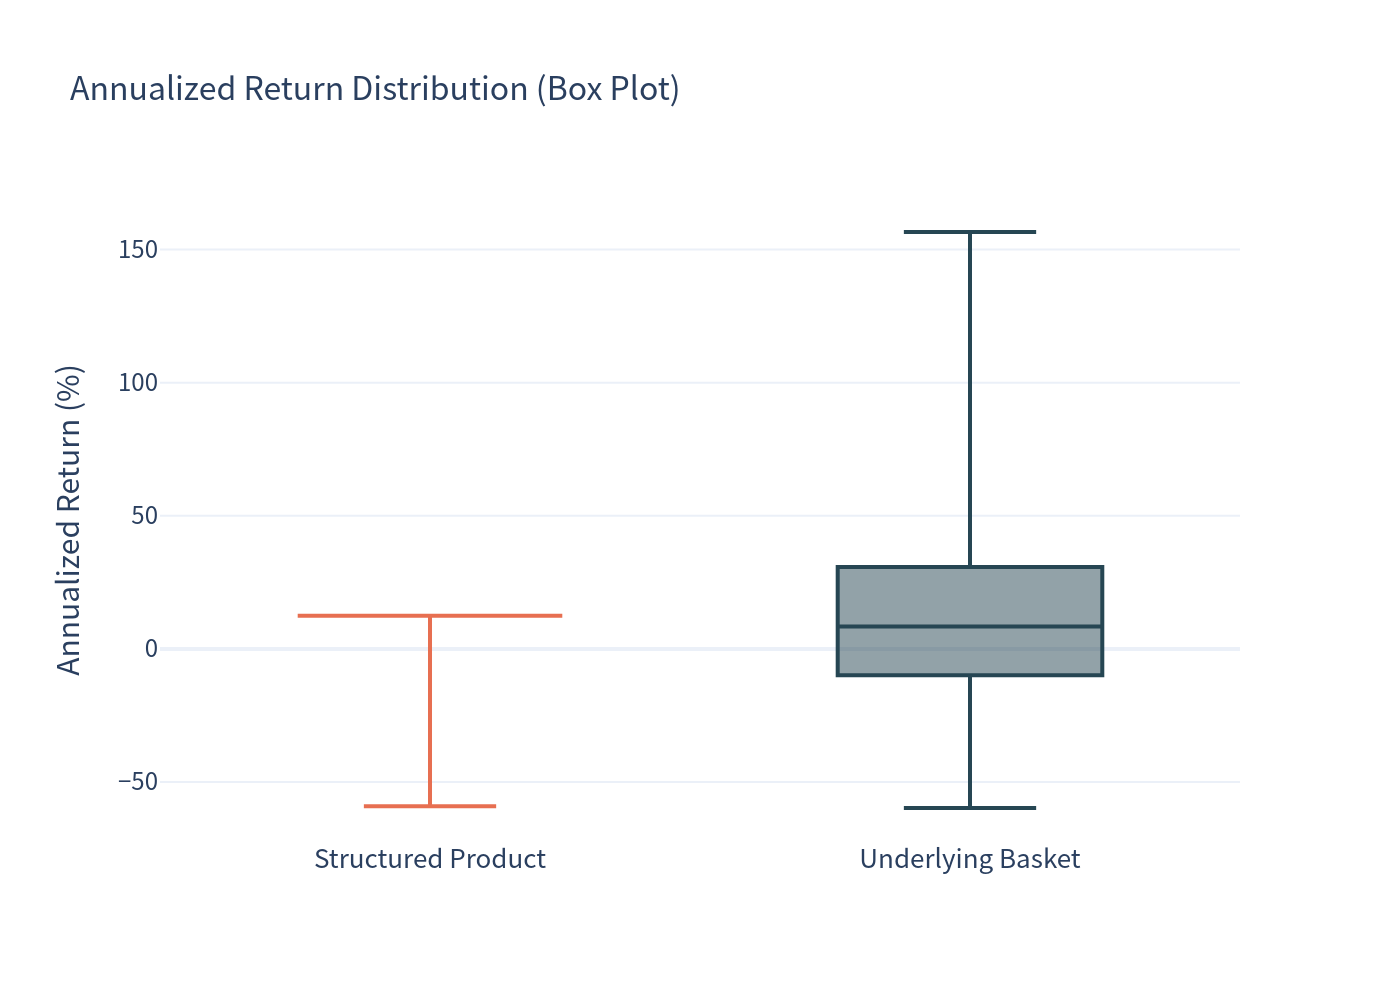
| Probability of a negative return | 13.47% | 40.97% |
| 99% confidence VaR (1-year) | −43.89% | −38.40% |
- Expected total return over the realized holding period: +4.71% (average holding period ≈ 10.2 months).
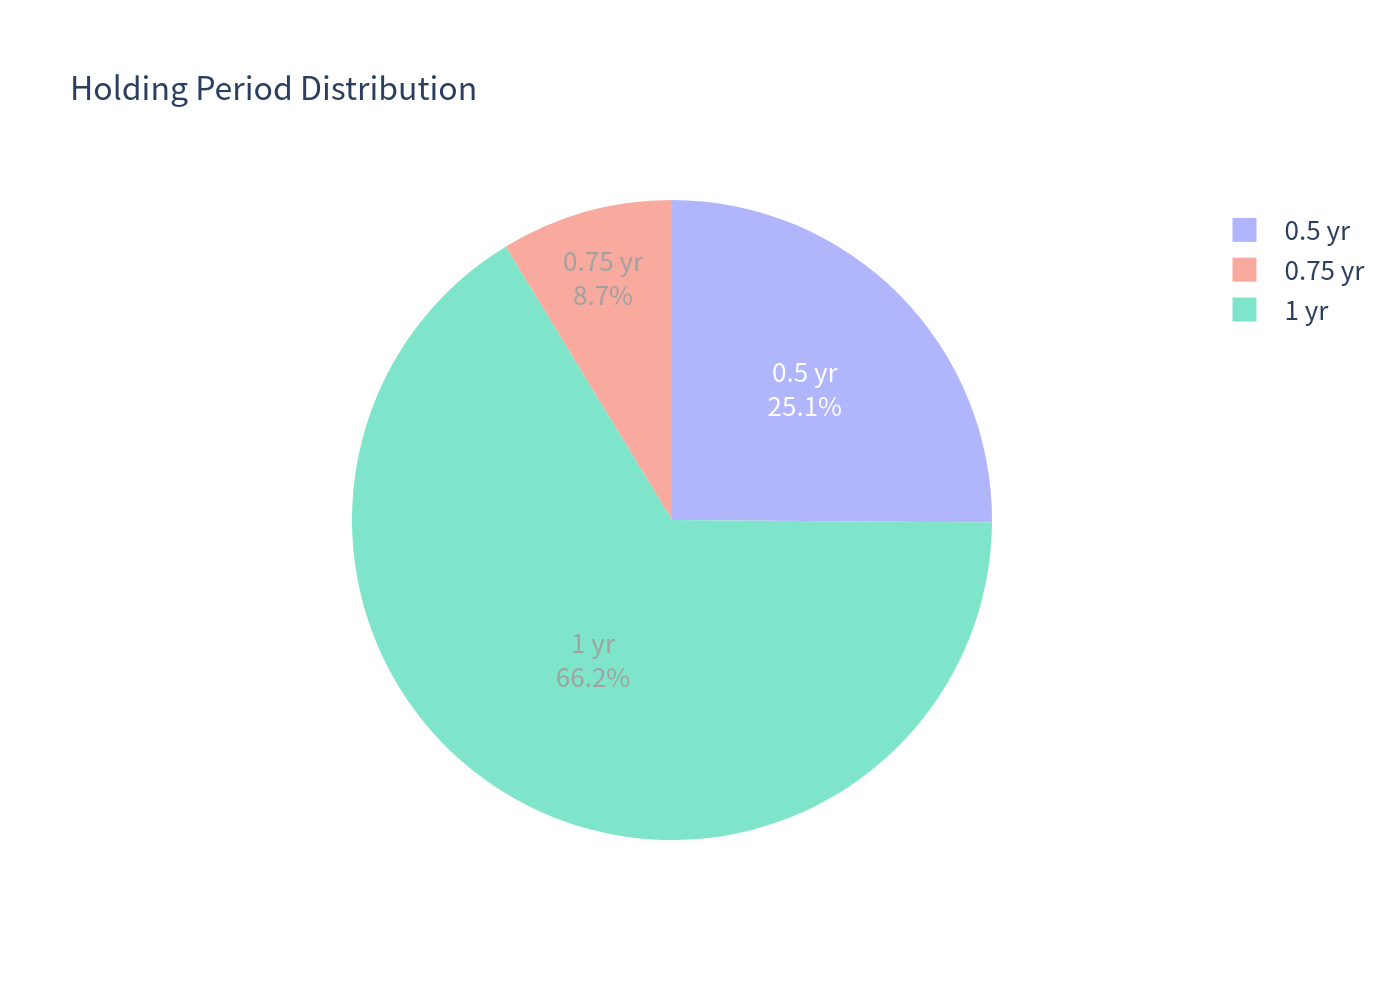
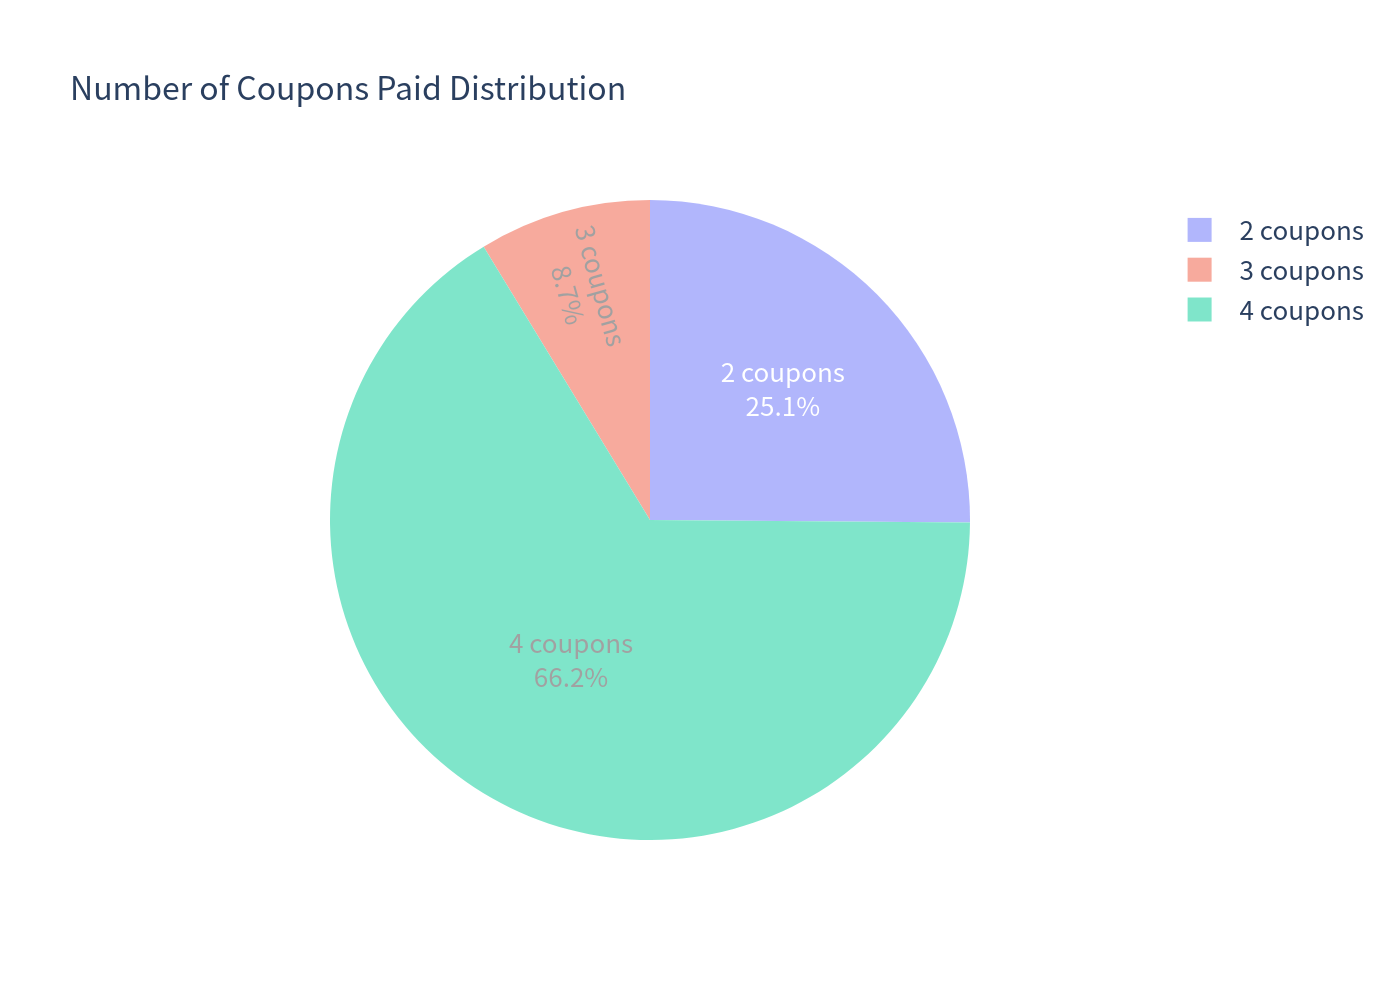
- Probability the issuer calls the note early: 25.12% at month 6 and 8.70% at month 9 (≈ 33.8% combined); otherwise it runs the full 12 months.
- Probability of a barrier event (any underlying trading at/≤ 59% of its start at any time): 13.72%.
- Probability of outperforming the CHF risk-free rate (≈ −0.05%): 86.53%.
- Probability of earning ≥ 10% p.a.: 86.42%.
Basic Product Information
| Product | Multi Barrier Reverse Convertible (worst-of, 3 shares) |
|---|---|
| Underlyings | Kardex AG (KARN), Komax Holding AG (KOMN), Stadler Rail AG (SRAIL) |
| Currency / Denomination | CHF / CHF 1,000 (index 100) |
| Coupon | 12.50% p.a., paid quarterly (3.125 index points = CHF 31.25 per quarter) |
| Barrier | 59.00% of initial level, continuous observation, per underlying |
| Strike | 100.00% (at-the-money) |
| Upside | Capped (fixed coupon only) |
| Early redemption | Issuer-callable at month 6 and month 9 (par + coupon) |
| Term | ≈ 12 months (Issue 14/10/2026 → Redemption 14/10/2027) |
How It Works (In Plain Terms)
- You pay par (100) and receive a fixed 12.50% p.a. coupon paid quarterly, regardless of how the shares perform.
- In exchange you accept downside exposure to the worst-performing of Kardex, Komax and Stadler Rail — but only after a protective trigger is broken.
- A "Barrier Event" occurs if any of the three shares trades at or below 59% of its starting level at any time during the year (continuous monitoring).
- If no barrier is ever hit: you get 100 back at maturity plus all coupons — capital protected (subject to issuer credit risk).
-
If the barrier is hit:
- the worst share finishes below its start → you receive that worst share (physical delivery), so you bear its full loss (e.g. worst ends at 70 → you receive ≈ 70, plus coupons);
- the worst share finishes at or above its start → you still get 100 back.
- The issuer may redeem early on the two observation dates. If it does, you get par (100) + the coupon for that date and the product ends. The issuer is most likely to call when the shares are up — precisely when you would have liked to stay invested.
Charts
Simulation outcomes vs the underlying basket
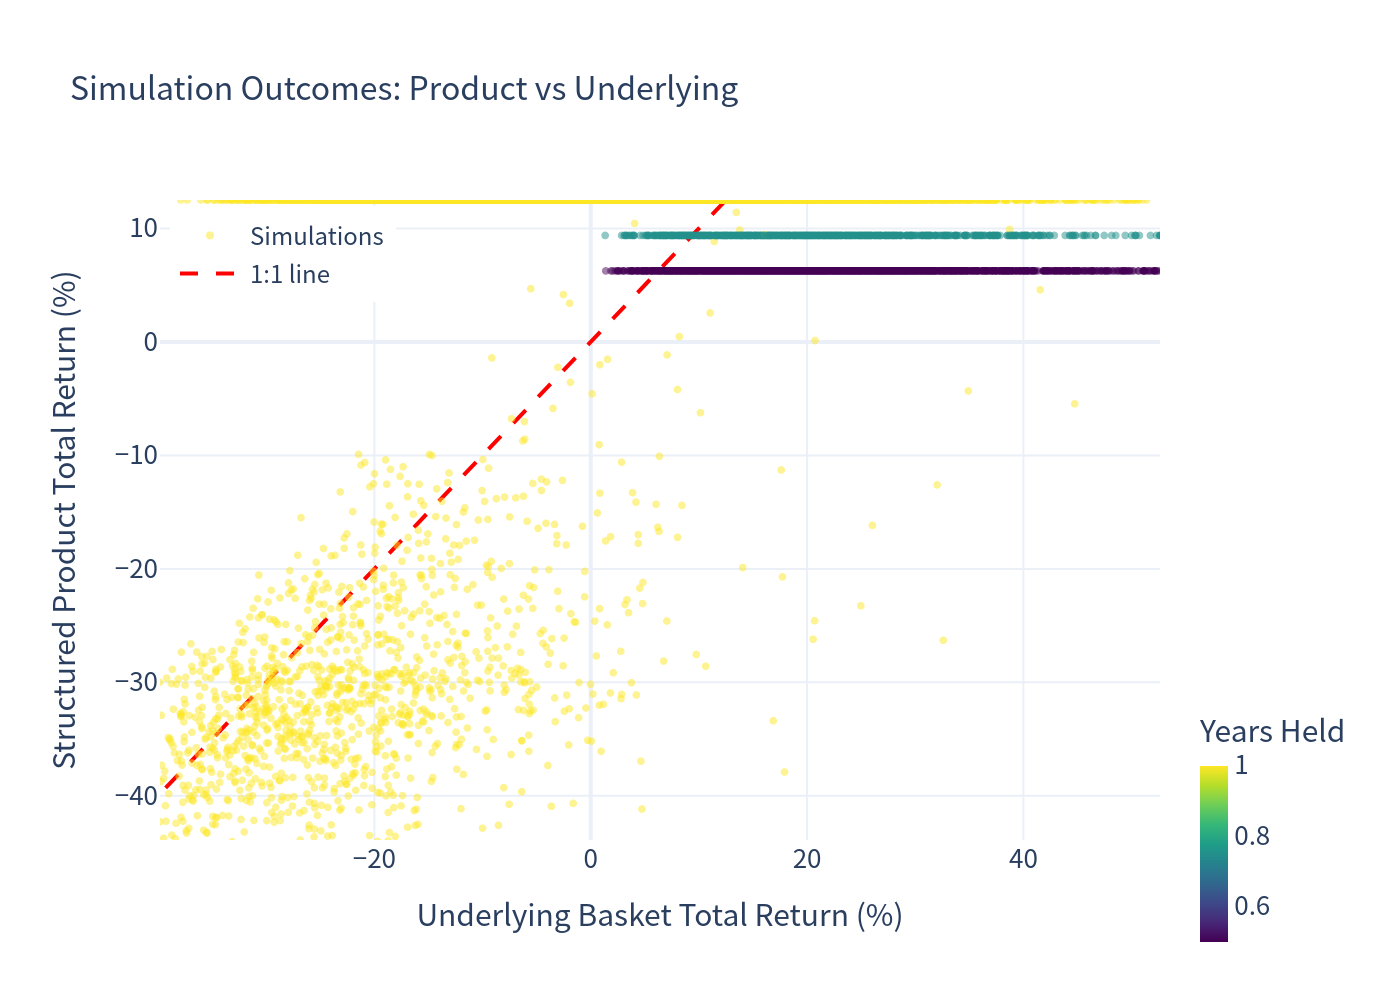
Each point is one simulation: horizontal axis = basket total return, vertical axis = product total return, colour = years held. Points above the dashed 1:1 line represent the product beating the basket.
Annualized return distributions
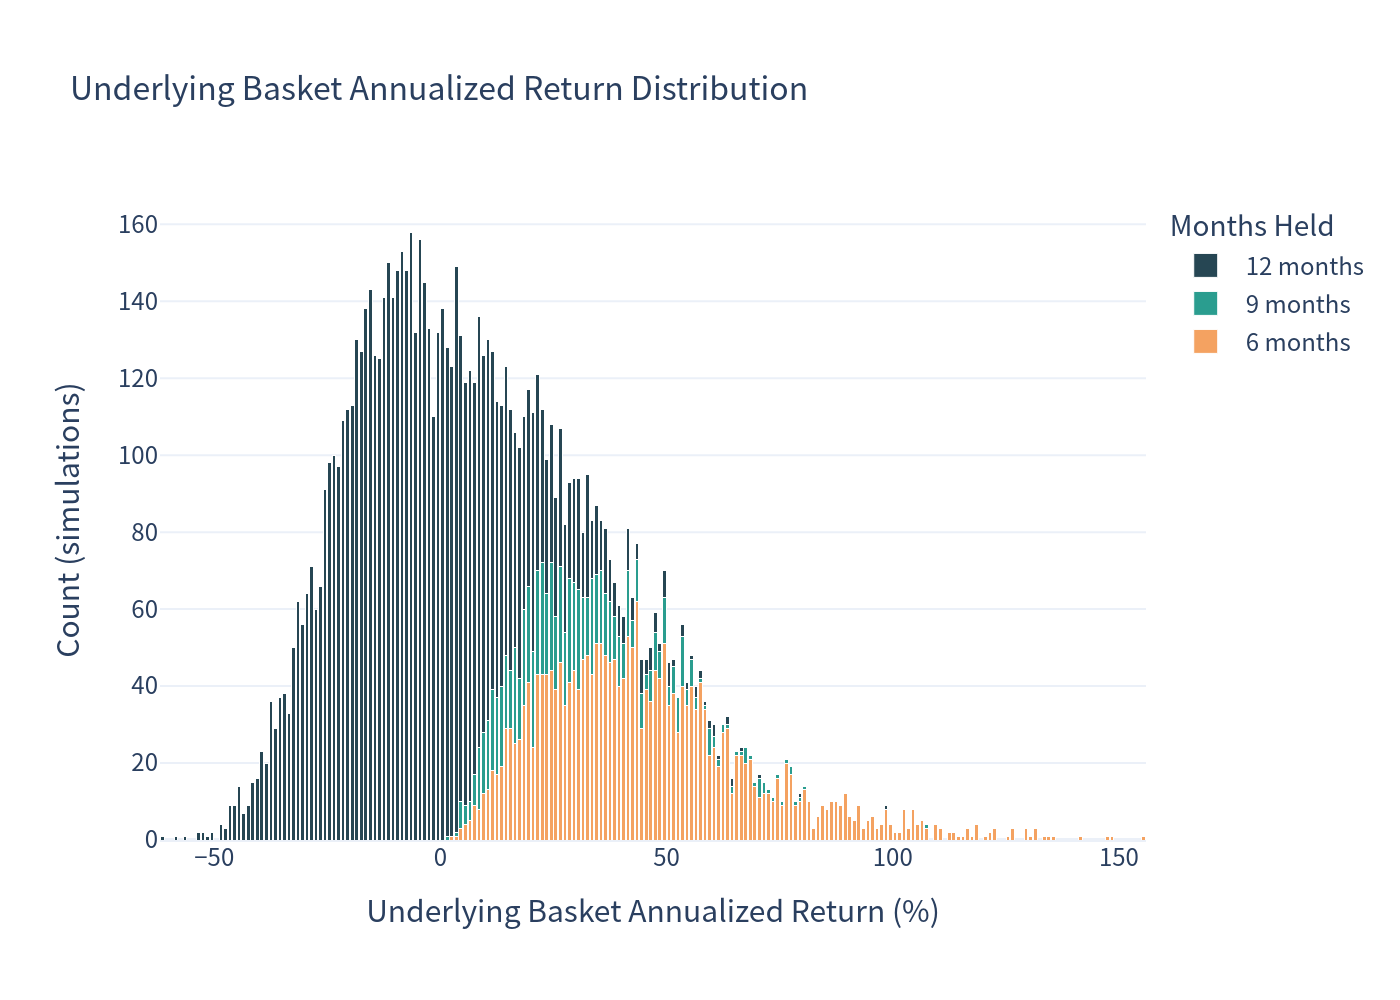
Underlying basket (annualized, %):
Structured product annualized return distribution
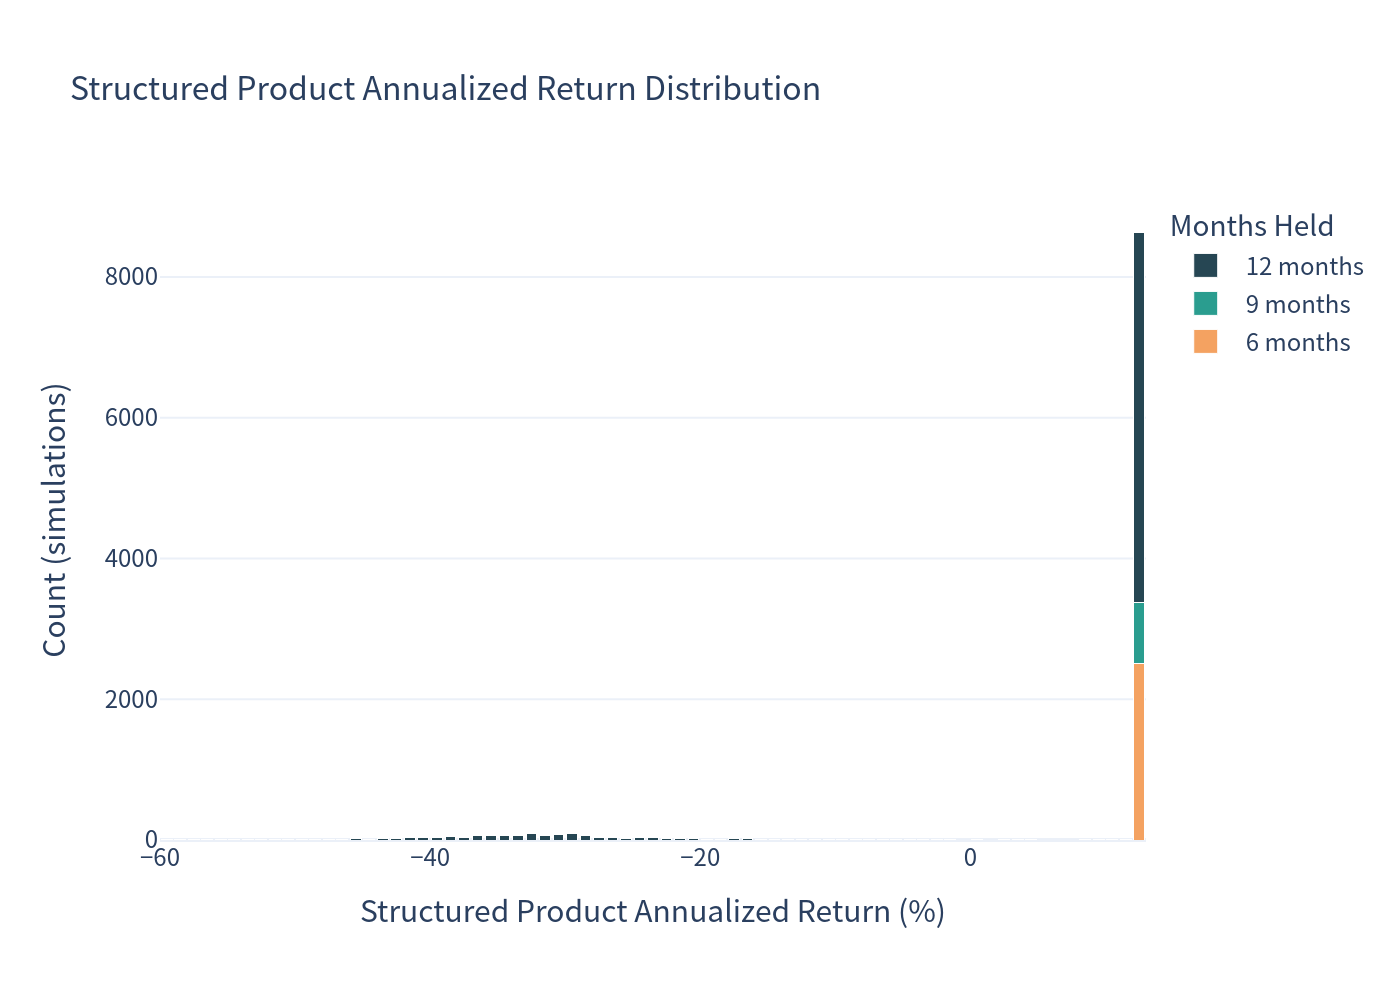
Structured product (annualized, %), stacked by holding period:
Scenario probabilities
Risk / return comparison
Return dispersion (box plot)
Holding period
Distribution of realized holding periods:
Coupons paid
Number of coupons received depending on the path taken:
Investment Commentary
Strengths
- A high 12.50% p.a. coupon — far above CHF deposit and money-market rates (≈ 0%).
- A 41% barrier cushion (59% barrier) that is only breached on a genuinely large fall.
- Conditional capital protection: even a volatile year leaves ~86% of paths with a positive return; a loss requires both a barrier breach and the worst share finishing below its starting level.
- The three underlyings are positively correlated but the barrier must be breached by only one name, giving the barrier structure a meaningful "worst-of cushion".
Risks / Drawbacks
- Worst-of downside: the payoff keys off the single worst of three high-volatility (≈ 30% annualized vol) industrial names. In a broad sell-off all three can fall together, and you bear the worst one.
- Capped upside: you never participate in share rallies; the maximum outcome is the fixed coupon.
- Issuer call: the product is likely to be redeemed exactly when the shares are up (≈ 34% of paths end early), so the high coupon is often earned over only 6–9 months.
- Continuous barrier: a single intraday dip to 59% — even if the share recovers — locks in downside participation; the "protected" outcome is decided by whether the worst share recovers above its start.
- Credit risk: you are exposed to the issuer (Leonteq Securities AG, Guernsey Branch).
Bottom Line
The note trades upside for a high fixed coupon and offers a large downside buffer, but it does not eliminate downside — in the ~14% of scenarios where the barrier breaks and the worst share does not recover, losses can be material (99% VaR ≈ −44% on an annualized basis). The simulated expected annualized return of ≈ 6.5% (≈ 4.7% on a total-return basis over an average 10-month holding period) is below the ≈ 12.4% expected return of holding the equal-weight basket outright, which is the compensation you give up for the coupon and the protective barrier.