
8.50% p.a. Multi Barrier Reverse Convertible (Callable) on 4 Swiss Banks
Headline Simulation Results
| Metric | Structured Product | Underlying (Equal-Weight Basket, total return) |
|---|---|---|
| Expected annualized return | 5.03% | 12.23% |
| Probability of negative return | 12.33% | 17.11% |
| 99% confidence VaR (1-year) | -30.50% | -13.38% |
| Expected annualized volatility | 9.42% | 13.39% |
Based on 10,000 Monte-Carlo scenarios over the product's life (up to 18 months). Returns are expressed as annualized rates in CHF.
Product at a Glance
| Issuer | Leonteq Securities AG, Guernsey Branch |
|---|---|
| Type | Yield-Enhancement — Multi Barrier Reverse Convertible (Callable) |
| Underlyings (worst-of) | Basler Kantonalbank, Julius Bär Group, Liechtensteinische Landesbank, Zuger Kantonalbank |
| Settlement | CHF, Denomination CHF 1,000, Issue Price 100% |
| Coupon | 8.50% p.a., paid quarterly (CHF 21.25 per CHF 1,000) |
| Barrier | 64% of initial (continuous observation) |
| Strike | 100% of initial |
| Issuer call | Quarterly from month 6 (Issuer's right, not obligation) |
| Term | 07/10/2026 → 07/04/2028 (max ~18 months) |
| Upside | Capped — no participation; best outcome is par + coupons |
How it works (plain language)
The investor lends CHF 1,000 and is promised 8.50% per year in quarterly instalments. In return the investor effectively sells a put on the worst-performing of four Swiss bank shares.
- If none of the shares ever trades at or below 64% of its starting level, the investor gets the full denomination back at the end plus all coupons.
- If any share touches 64%, the protection disappears. At maturity the investor then receives par only if the worst share is back at or above its start; otherwise the redemption is scaled down to that worst share's performance (capital loss), while the coupons already paid are kept.
- The Issuer may call the product early on any quarterly date from month 6; the investor then receives par plus the then-current coupon, and no further coupons.
Key Statistics
Structured Product
- Expected total return over the realized holding period: 5.01%
- Expected annualized return: 5.03%
- Expected holding period: 13.96 months (~1.16 years)
- Probability of negative return: 12.33%
- 99% VaR (1-year): -30.50%
Underlying — equal-weight basket of the 4 banks (price + dividends)
- Expected annualized total return: 12.23% (2.89% average dividend yield included)
- Expected annualized volatility: 13.39%
- Probability of negative return: 17.11%
- 99% VaR (1-year): -13.38%
Simulation Outcome — Product vs Underlying
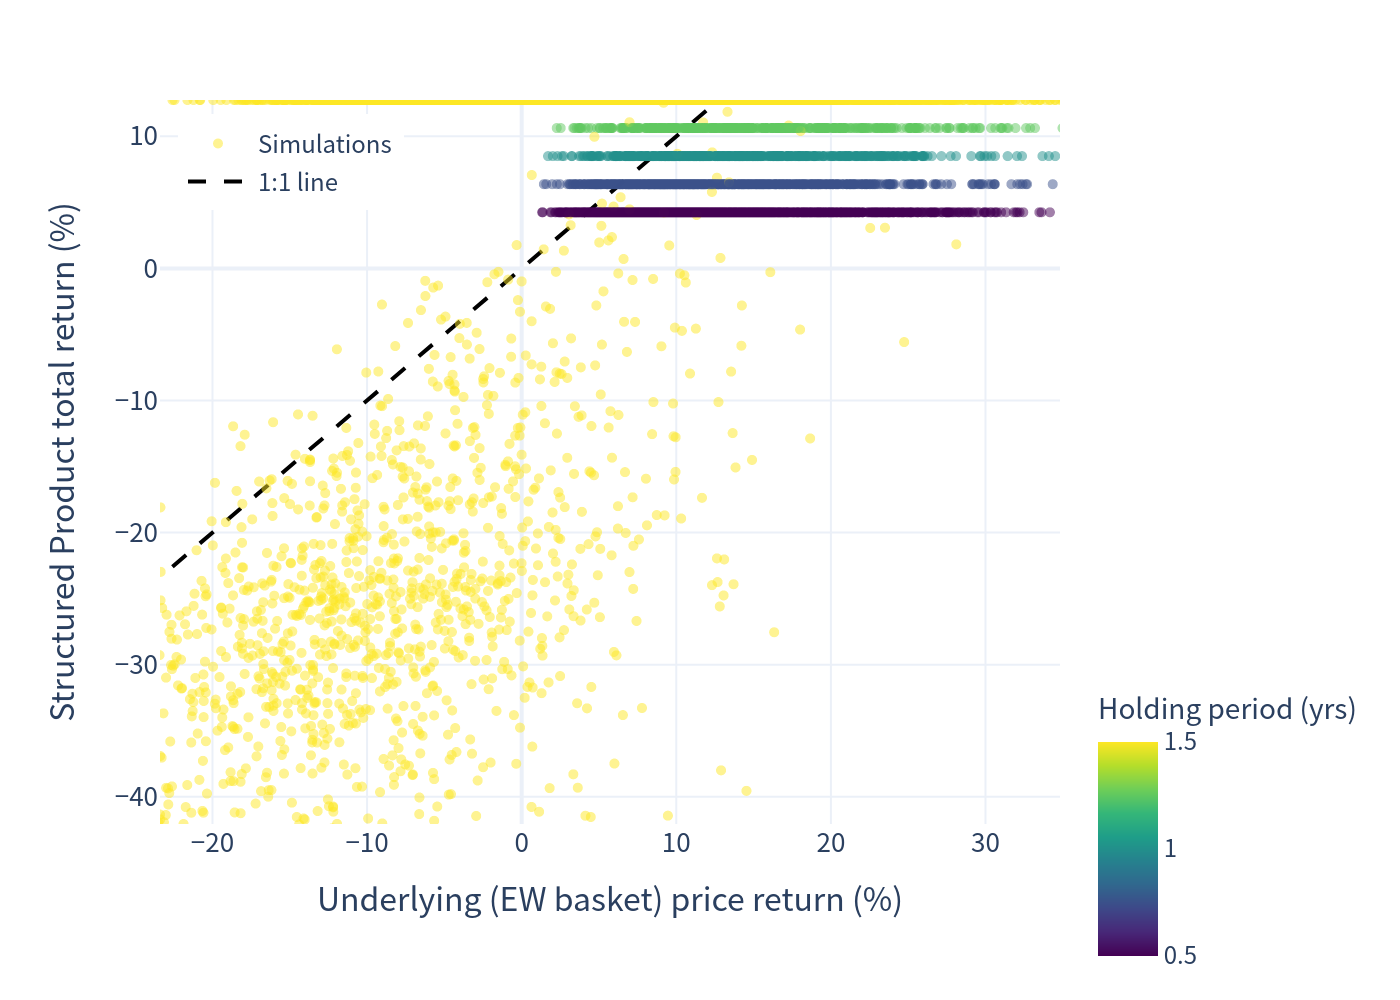
Each point is one scenario (10,000 total); the dashed line is the 1:1 reference. This chart shows the underlying on a price basis (dividends excluded, the standard outcome view); the dividend-inclusive total return is used in the statistics and distribution comparisons below. Points above the line are scenarios where the product total return exceeded the underlying's price return.
Return Distributions
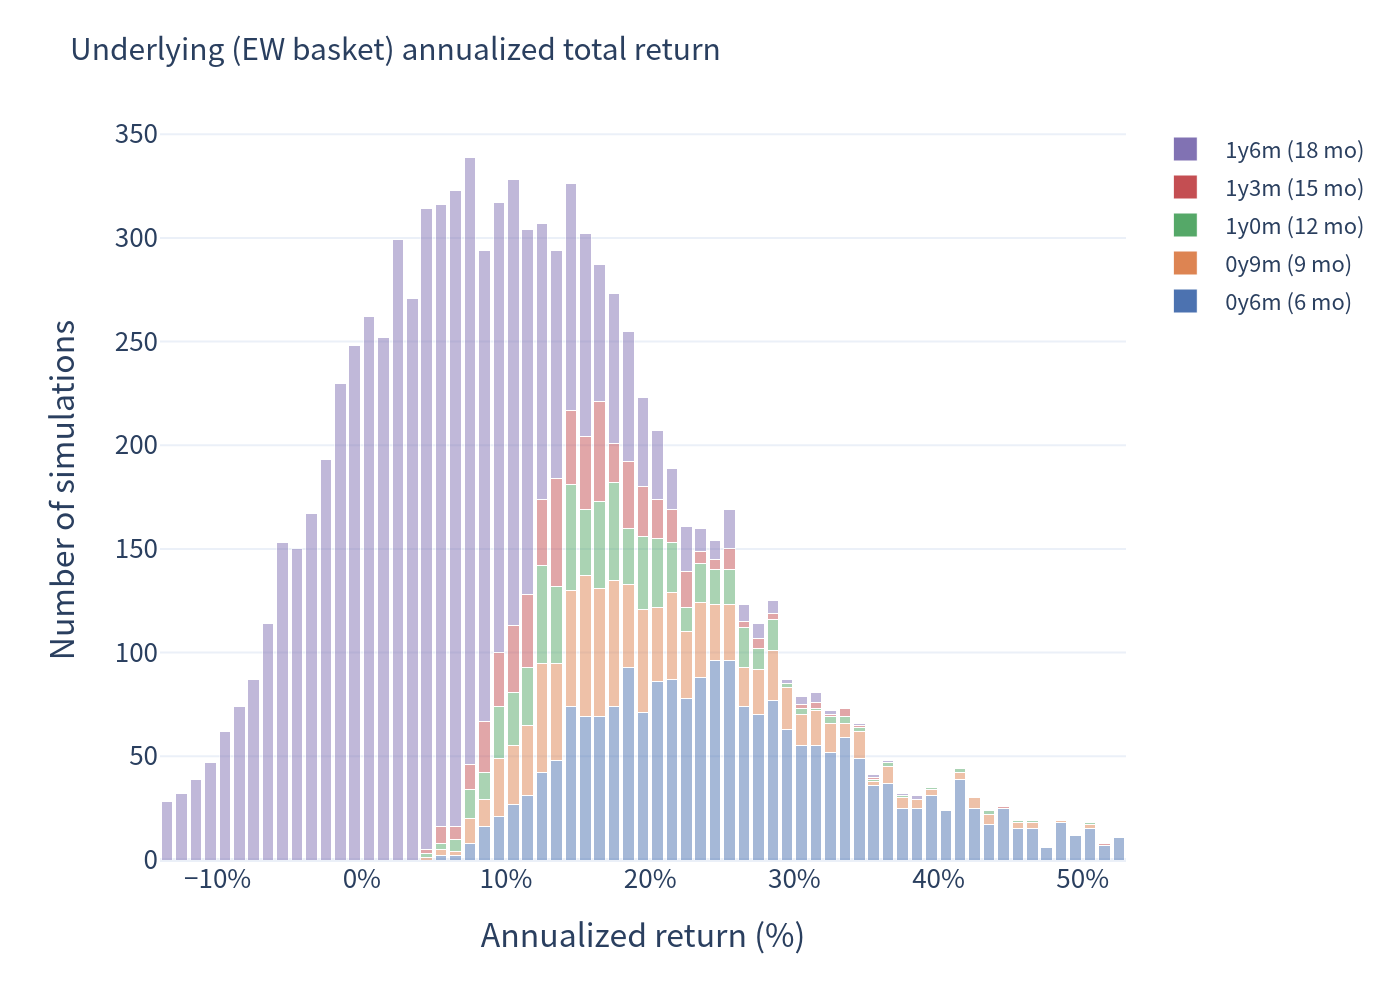
Underlying (equal-weight basket) — annualized total return
Structured Product — annualized return
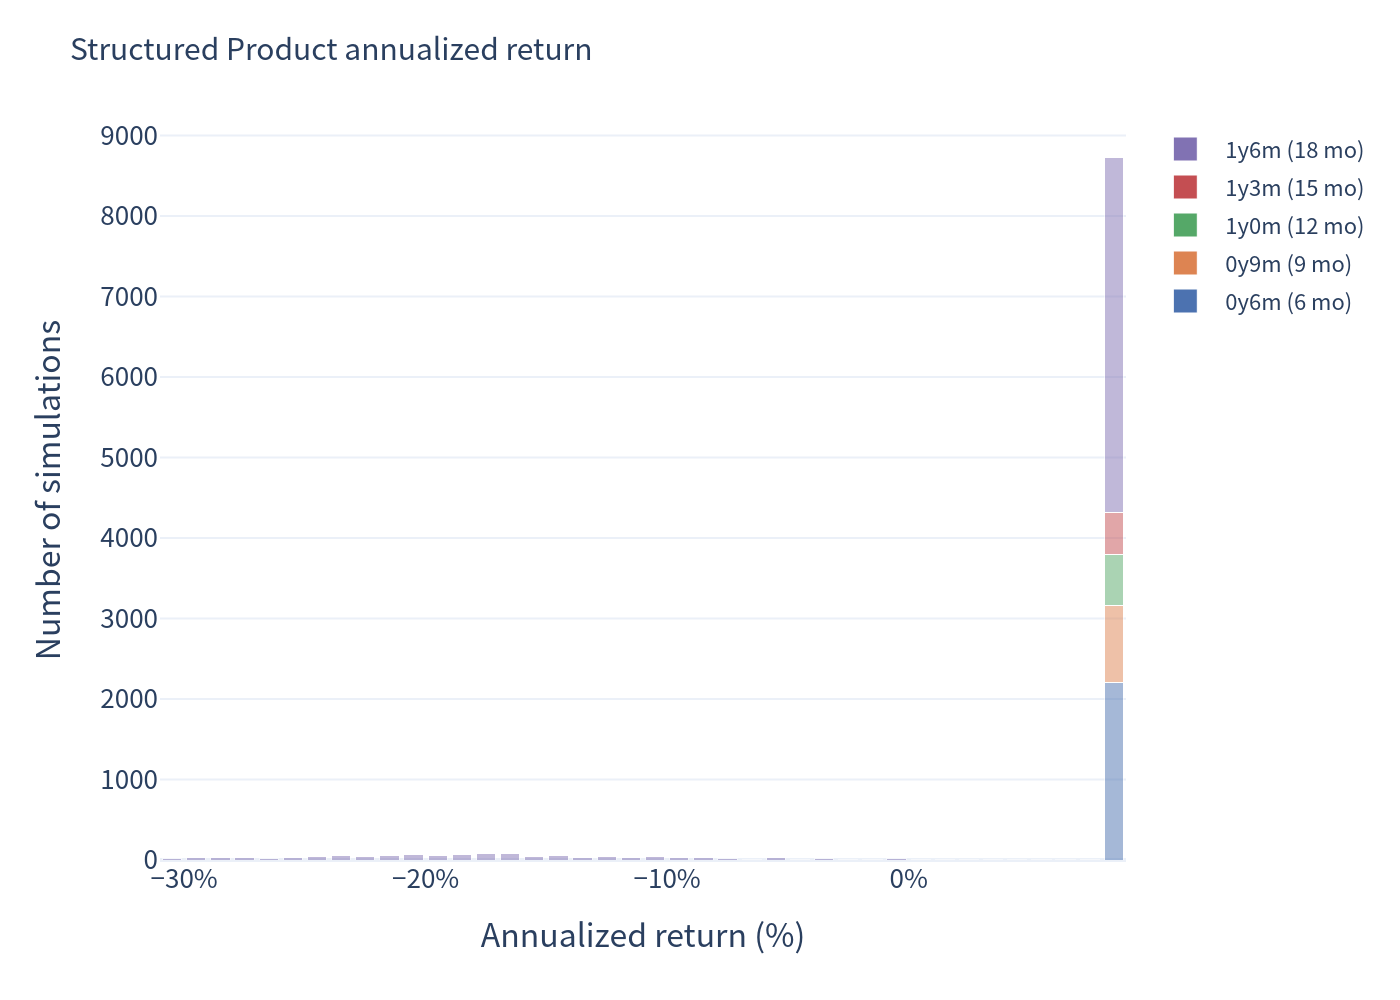
The product distribution is strongly concentrated at the full coupon rate (≈8.3–8.5% annualized) — the capital-protected, coupon-collecting scenarios — with a thin left tail of loss scenarios that pulls the mean down to ~5%.
Risk / Return and Distribution Comparison
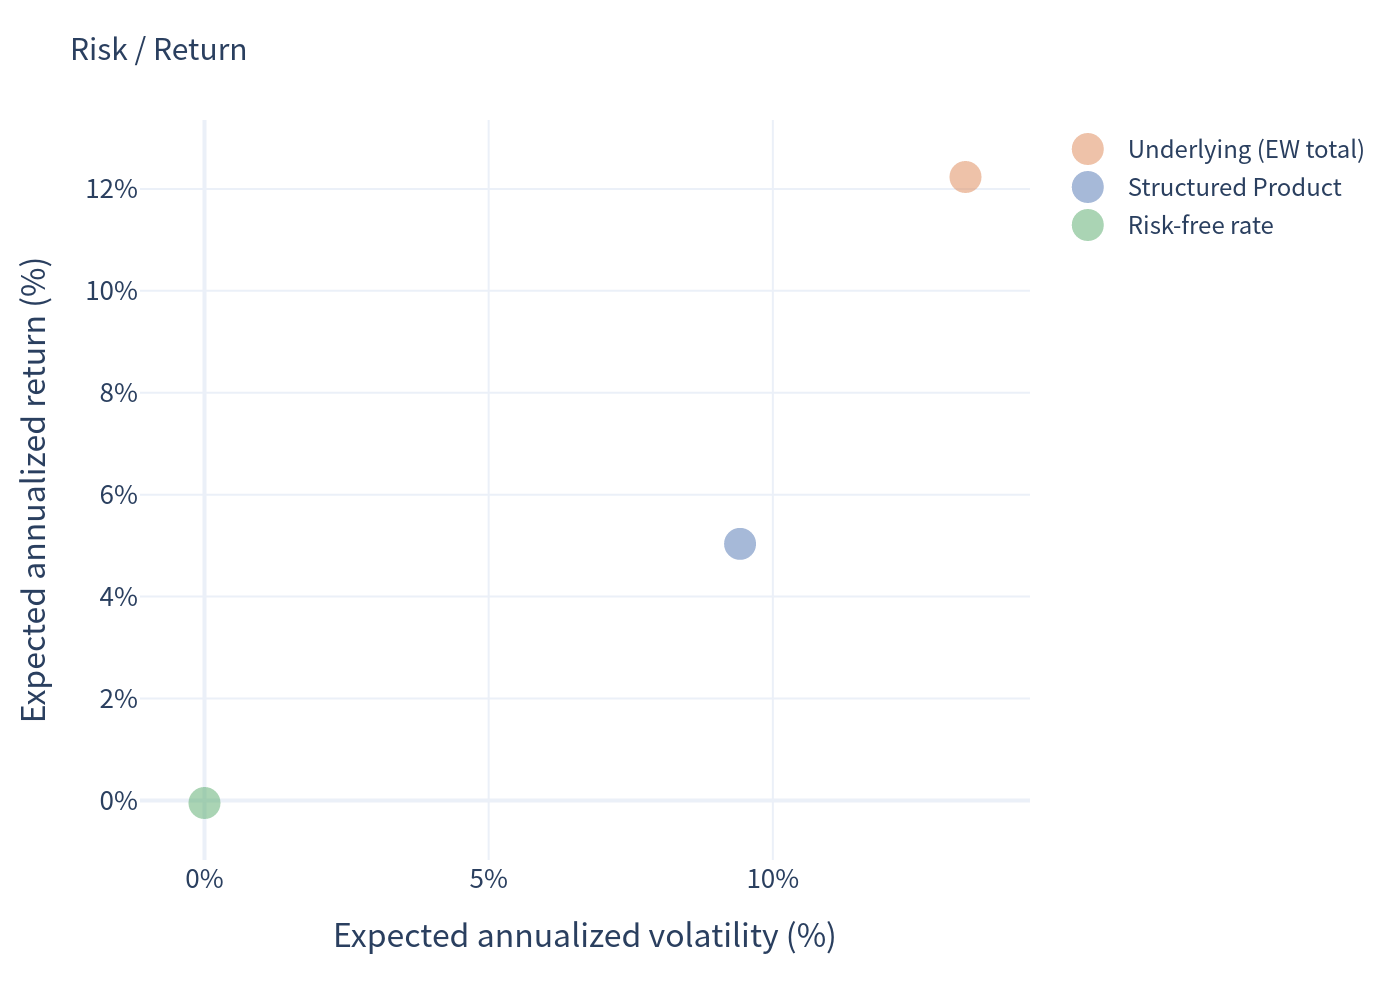
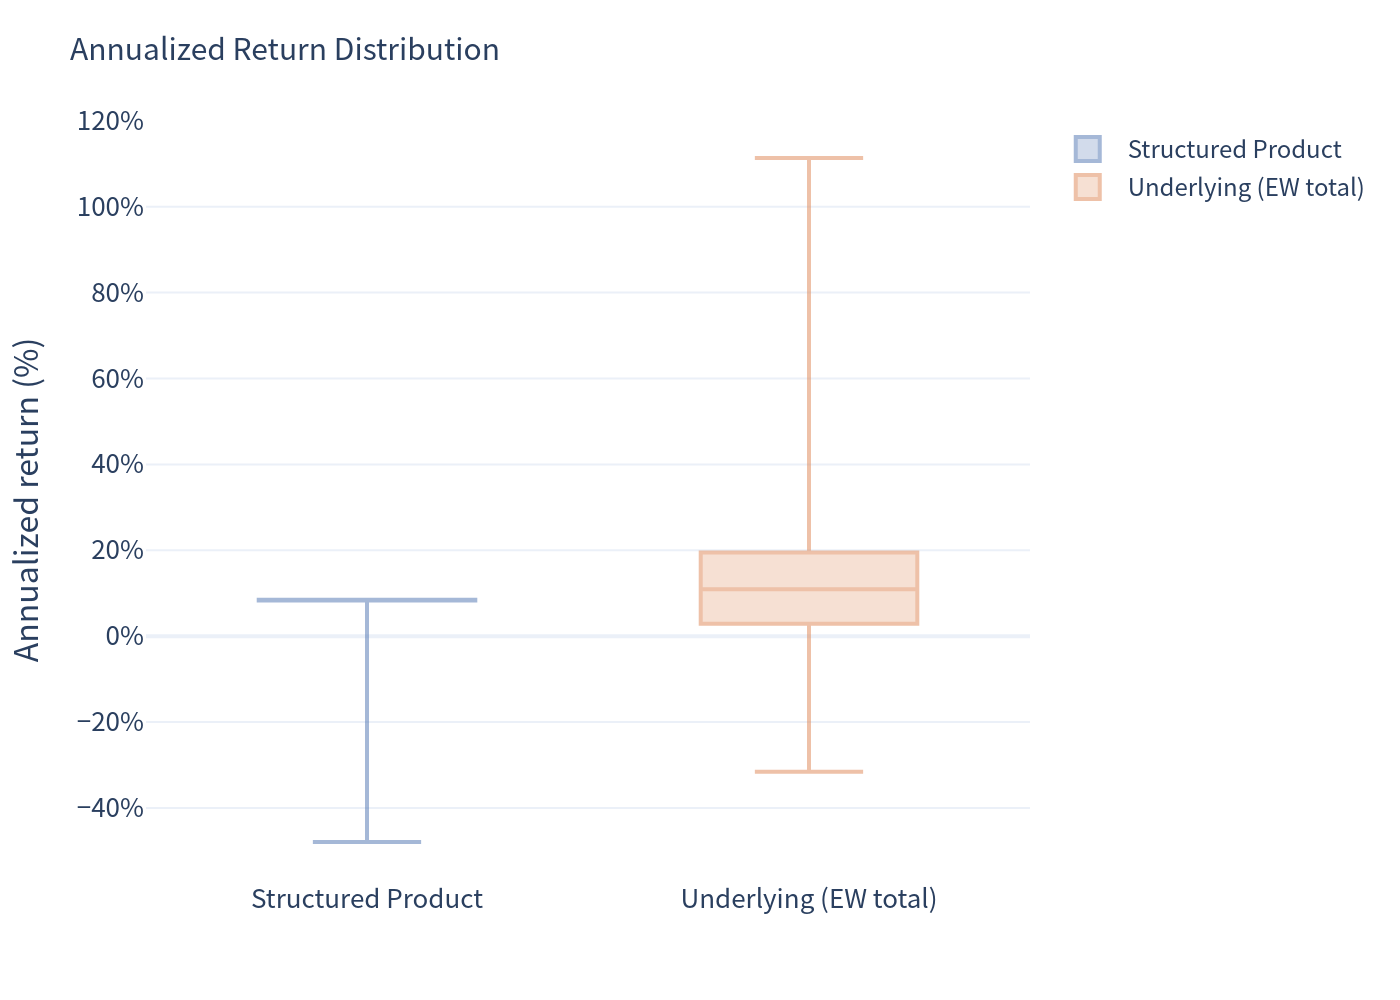
The product sits below and to the left of the underlying: lower expected return (5.03% vs 12.23% total) but also lower volatility (9.42% vs 13.39%). Note, however, that its 99% VaR is more negative than the underlying's (-30.50% vs -13.38%) — the tail risk is concentrated in the worst-of barrier structure and is not diversified away.
Scenario Probabilities
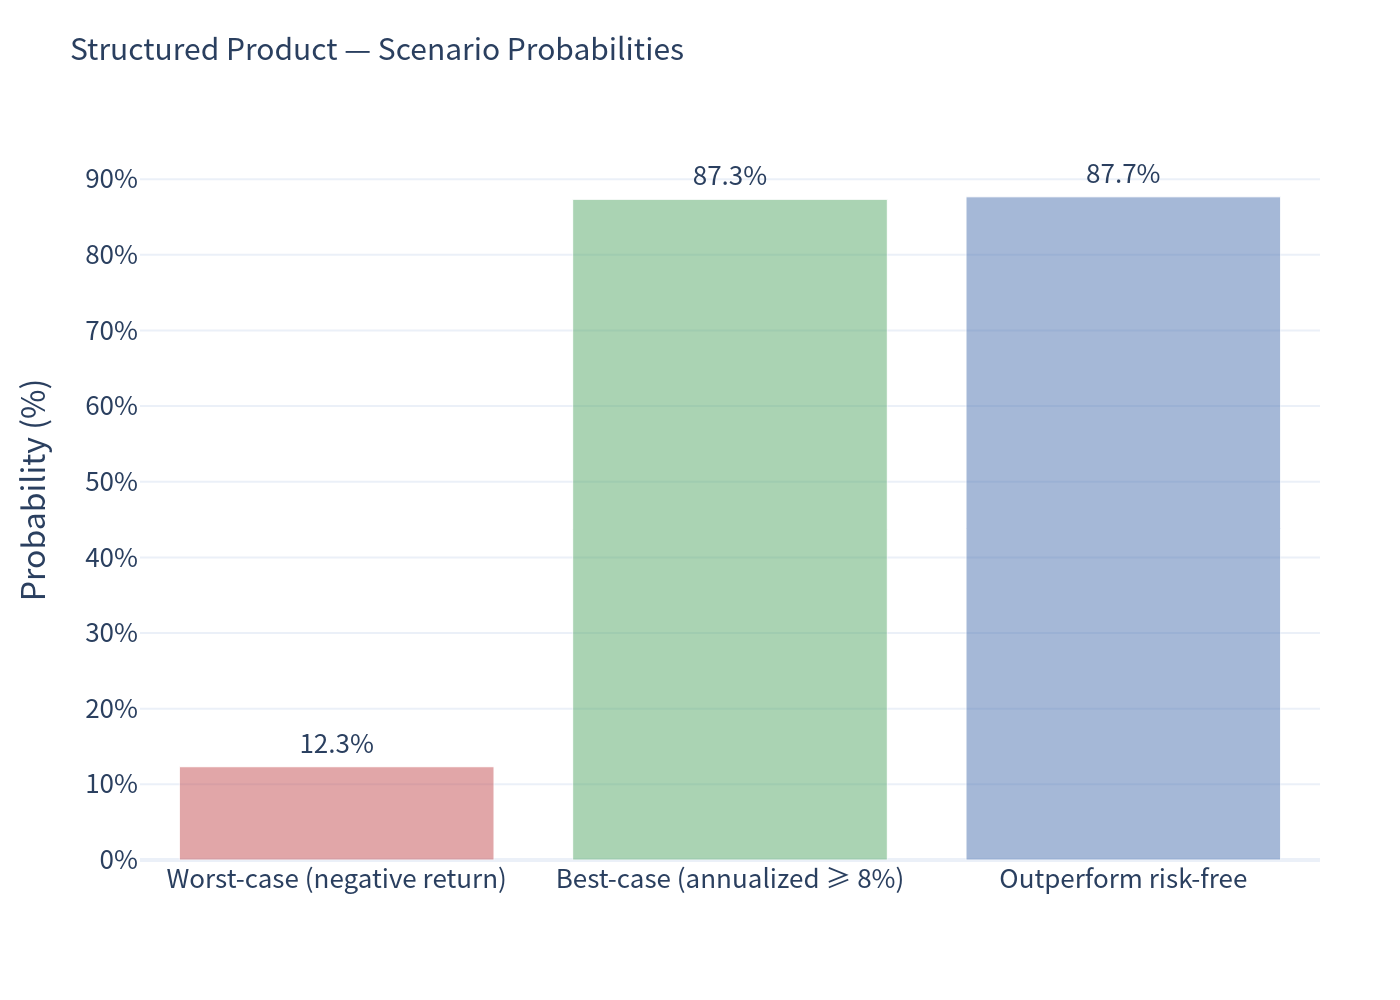
- Worst case (negative total return): 12.33%
- Best case (annualized return ≥ 8%, i.e. at or near the full coupon rate): 87.34%
- Outperforming the risk-free rate (≈0%): 87.67%
When Does the Product End?
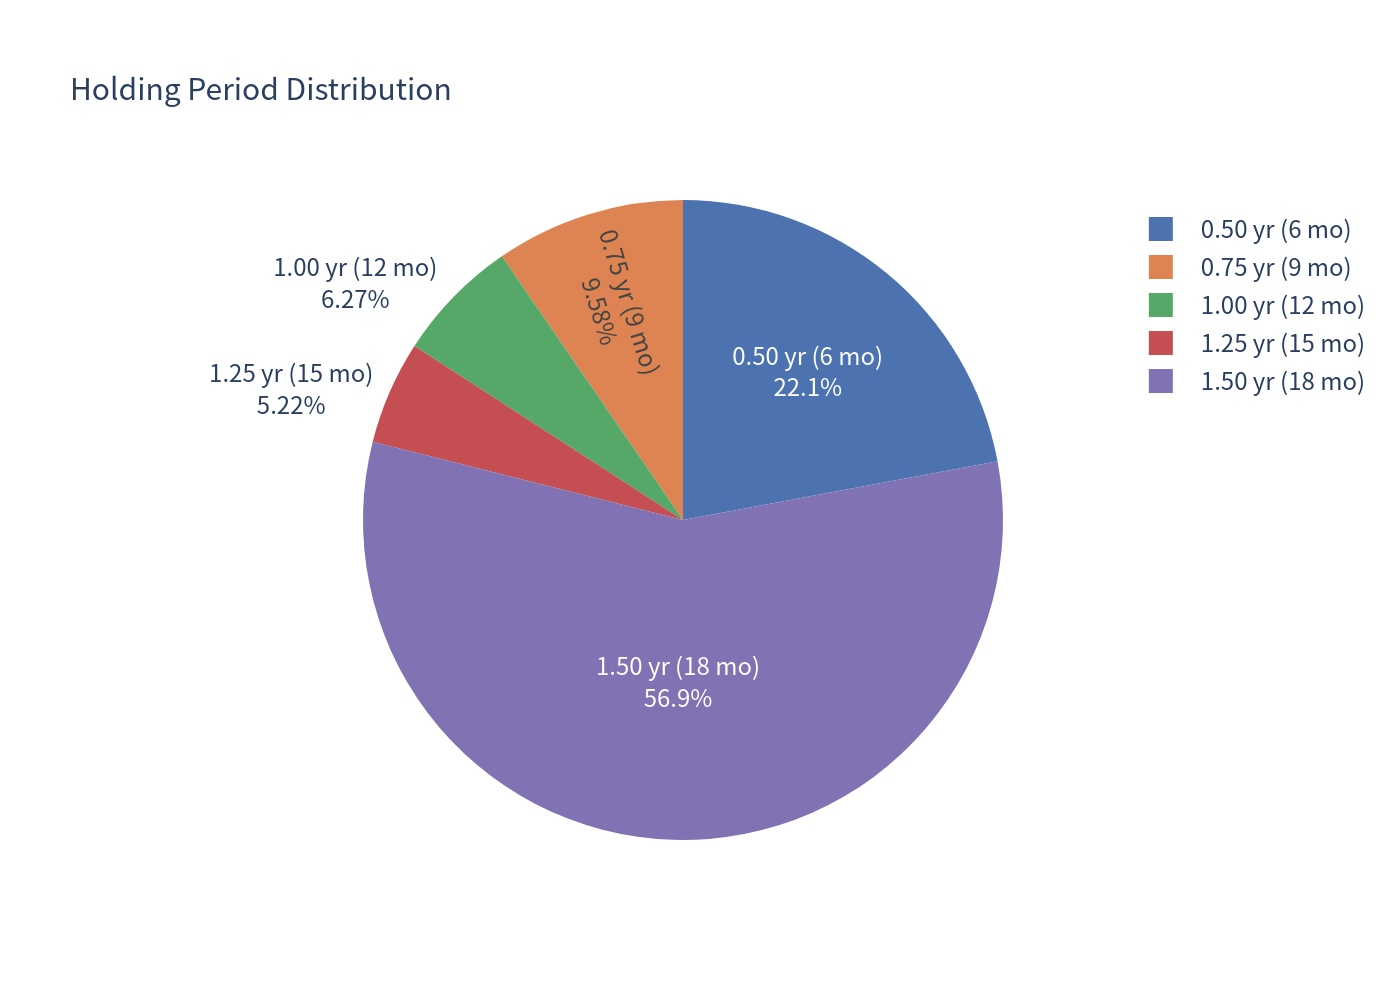
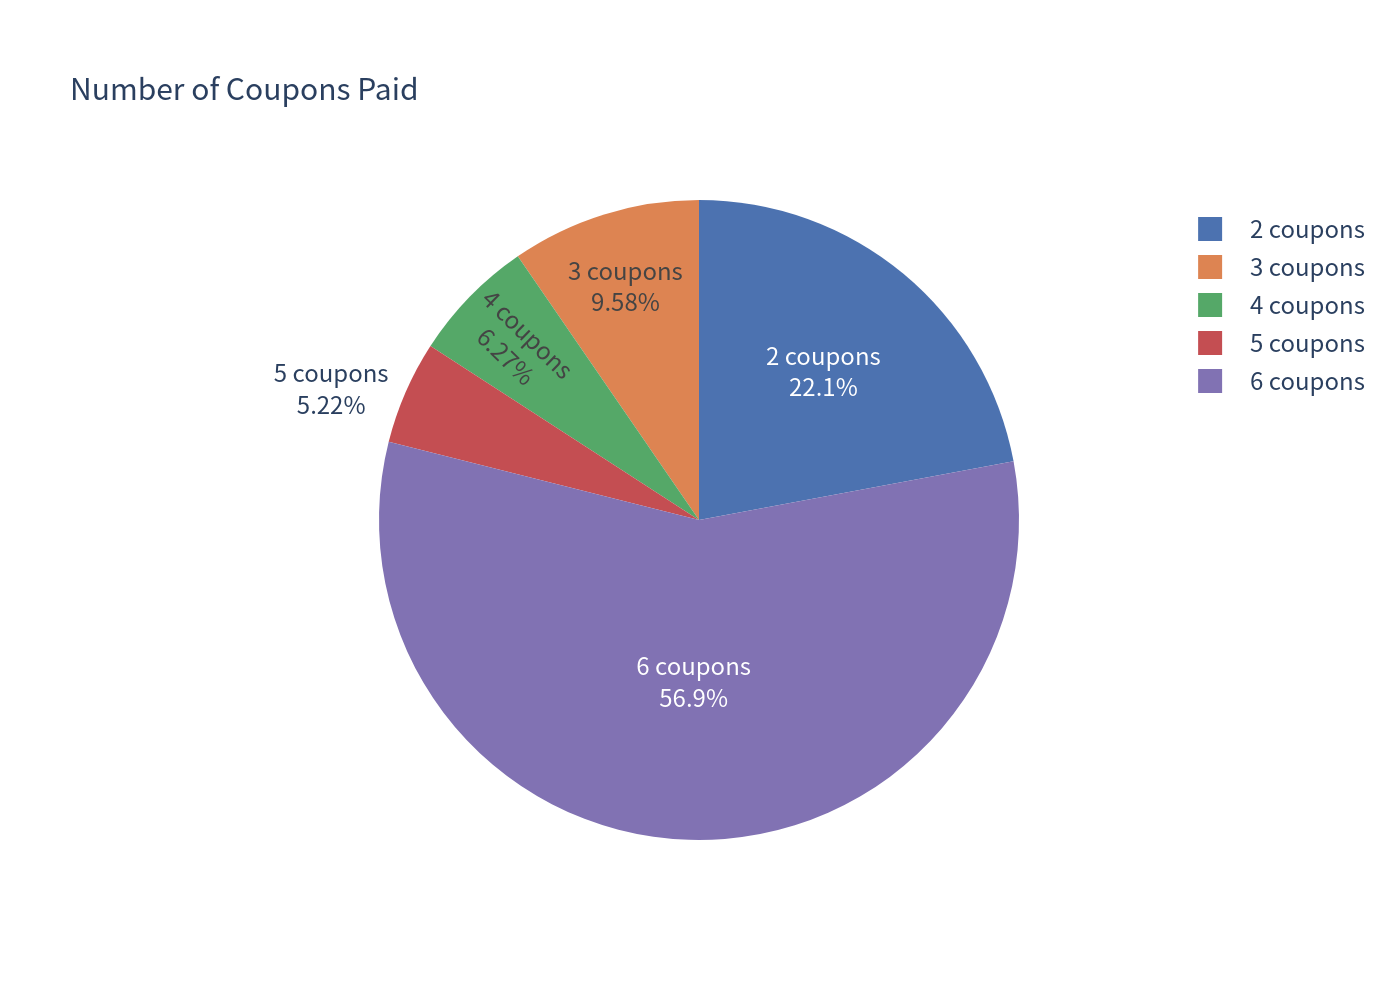
The number of coupons paid mirrors the holding period: 2 coupons (22%), 3 (10%), 4 (6%), 5 (5%), and 6 coupons (57%) when held full term. Barrier events occurred in 13.78% of simulated paths.
Investment Commentary
Potential advantages
- Attractive carry: an 8.50% p.a. coupon is high relative to the near-zero CHF risk-free rate, and the product pays coupons "in any case" while alive.
- Buffered central case: in ~87% of scenarios the investor earns at or near the full annualized coupon rate (8.5%) with capital intact; the probability of a negative outcome (12.33%) is moderate. (Only ~57% of paths run to full maturity and collect all six coupons — an early call simply shortens the coupon stream.)
- Lower volatility than the basket: the conditional 64% barrier shields the common "small dip" cases, giving a realized volatility of 9.42% versus 13.39% for the underlying.
- Only 64% downside cushion required: the barrier is set well below the strike, so a meaningful market correction is needed before capital is exposed.
Considerations / trade-offs
- Capped upside: the investor never participates in gains; the maximum annualized return is ~8.5%.
- Worst-of dependency: protection is judged on the weakest of four correlated financial-sector names; the barrier is more likely to be touched than for a single stock.
- Material tail risk: if the barrier is breached and the worst share finishes below its start, capital is reduced proportionally to that worst performance. The 99% VaR of -30.50% is deeper than the underlying basket's.
- Issuer call: the product can be redeemed early by the Issuer, typically when it is least beneficial to the investor (curtailing the remaining coupon stream).
- Credit and sector risk: returns depend on the Issuer's ability to pay and on the Swiss banking sector, with all four underlyings sharing a common industry exposure.
This analysis is a quantitative simulation exercise and does not constitute financial advice or a suitability assessment. Figures are model outputs and depend on the stated assumptions.