
info@tokenengine.ai
Morgan Stanley “Trigger PLUS” due February 4, 2031 – Investment Analysis
Headline Simulation Results
| Metric | Value |
|---|---|
| Expected annualized return | 10.25% |
| Mean total return across simulations (5-year) | 73.12% |
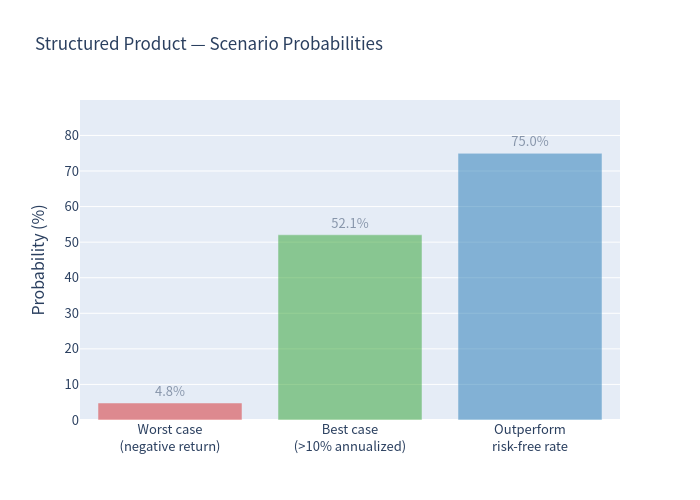
| Probability of negative return | 4.78% |
| 99% confidence VaR (1-year) | -11.60% |
| Expected annualized volatility | 8.76% |
| Probability of outperforming the risk-free rate | 74.97% |
Over 10,000 simulated 5-year scenarios, the note delivered a mean annualized return of 10.25%, lost money in only 4.78% of cases, and its worst 1% of outcomes averaged around -11.60% annualized. The buffered structure converts a large share of “small down” equity years into a flat (0%) result, which is why the frequency of losses is low even though the tail, when breached, is severe.
Basic Product Information
- Issuer / Guarantor: Morgan Stanley Finance LLC / Morgan Stanley
- CUSIP / ISIN: 61780AFA8 / US61780AFA88
- Stated principal / Issue price: $1,000 per security
- Underliers: Dow Jones Industrial Average (INDU) and S&P 500 Index (SPX) – worst-of
- Term: ~5 years (issue February 4, 2026; maturity February 4, 2031)
- Coupon: None – the securities pay no interest
- Upside: Uncapped, leveraged participation (leverage factor 138%–153%; base case 138%) in the worst-performing underlier
- Buffer / Downside threshold: 75% of each underlier’s initial level (25% cushion), observed once, at maturity
- Early redemption: None
- Estimated value at pricing: approximately $962.70 per $1,000 (about 3.7% embedded cost)
How It Works (plain language)
At maturity you look at the two indices and pick the worse performer:
- Both indices up: you receive your $1,000 back plus 138% of the worst index’s gain. Upside is uncapped.
- At least one index flat/down, but neither down more than 25%: you simply get your $1,000 back (0% return).
- Either index falls more than 25%: the buffer disappears and you take the full downside of the worse index, losing 1% for every 1% it fell. Your principal could be substantially reduced.
Because it is a worst-of structure, only one index needs to breach its 75% barrier to trigger losses, even if the other rallies strongly. The trade-off for the 25% buffer and the leveraged upside is that you give up the coupon and accept this concentrated downside.
Key Statistics (Annualized)
| Metric | Structured Product | Underlying (equal-weight basket) | Underlying + Dividends |
|---|---|---|---|
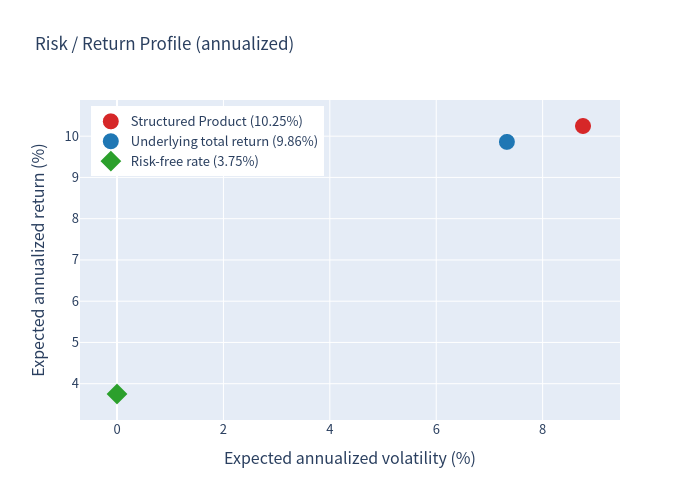
| Expected annualized return | 10.25% | 8.68% | 9.86% |
| Expected annualized volatility | 8.76% | 7.33% | 7.33% |
| Probability of loss | 4.78% | 11.93% | 9.41% |
| 99% confidence VaR (1 year) | -11.60% | -9.84% | -8.66% |
The benchmark is an equal-weight basket of the DJIA and S&P 500 (a like-for-like comparator, rather than the worse-of). Dividend yields (about 1.38% and about 0.98%, blended about 1.18%) are added to the benchmark total return for a fair comparison.
Simulation Outcomes
Product vs Underlying Final Return (60-month)
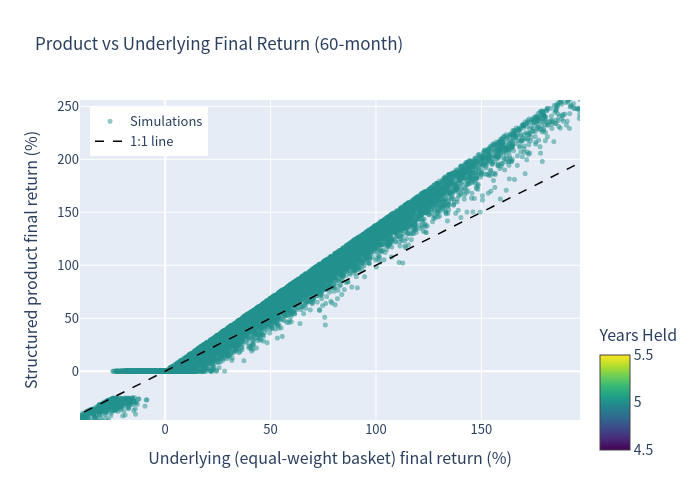
Points above the dashed 1:1 line are scenarios where the note beats the basket. The upward-sloping, convex-then-linear pattern reflects the 138% leverage in up markets and the 25% buffer in mildly negative markets; the scatter that drops below the line at the far left reflects barrier breaches of the worse index.
Annualized Return Distributions
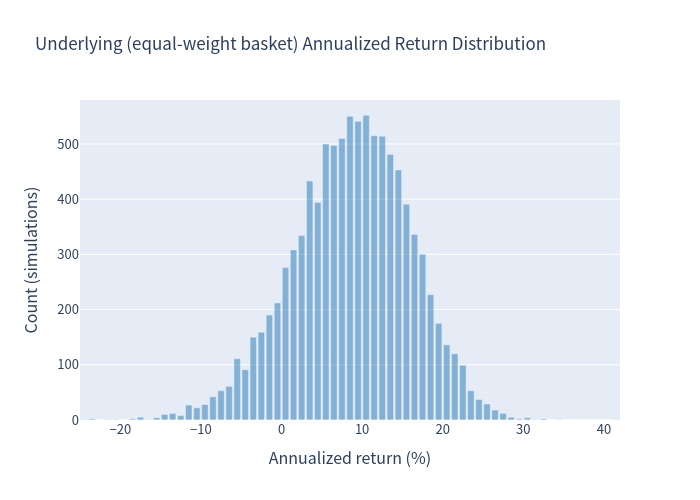
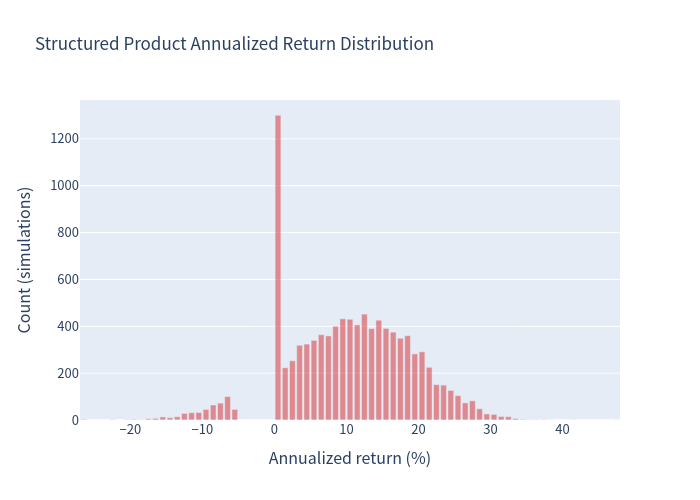
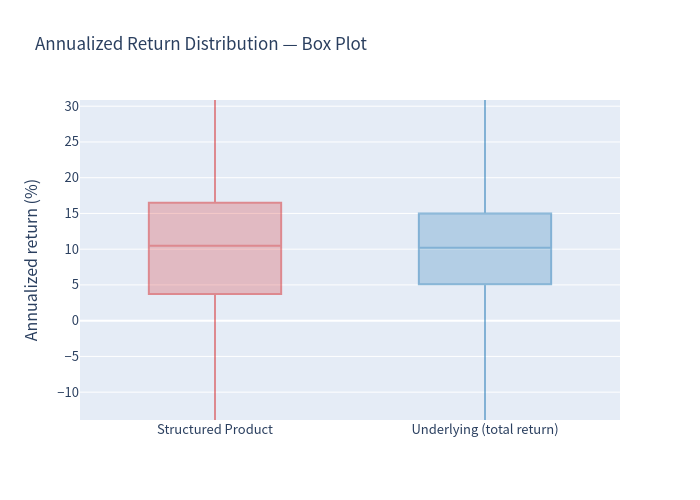
The basket’s return distribution is roughly bell-shaped with a left tail. The structured product’s distribution is heavily concentrated around a flat outcome (the many scenarios where the buffer absorbs a modest decline) together with a right-skewed cluster of leveraged gains, and only a thin left tail where the barrier is breached.
Risk / Return Profile
Return Distribution – Box Plot
Scenario Probabilities
Investment Commentary
Strengths
- Leveraged, uncapped upside. Both indices need only be positive for the note to pay 138% of the worse index’s gain – a meaningful uplift versus owning the index directly.
- 25% downside buffer at maturity. As long as neither index closes more than 25% below its initial level, principal is returned in full. This materially lowers the frequency of loss (4.78% vs 9.41% for the dividend-adjusted basket).
- Higher expected return than the underlying in this simulation (10.25% vs 9.86% total-return benchmark), the compensation for accepting worst-of concentration risk.
Risks to Consider
- Worst-of concentration. The note is only as strong as its weaker link. One index breaching its barrier is enough to trigger losses, even if the other index soars.
- Cliff-edge downside. The buffer is binary. Just below the 75% line the entire 25% cushion vanishes and losses compound toward (in the extreme) -100%. The 99% VaR of -11.60% is worse than the basket’s -9.84%, so the tail, though rare, is deeper.
- No income. No coupon is paid over the five-year life.
- Credit exposure & embedded cost. Returns depend on Morgan Stanley’s ability to pay; the approximately $962.70 estimated value implies roughly 3.7% of the issue price is absorbed by structuring/hedging costs.
Summary
This is a 5-year, no-coupon, worst-of (DJIA / S&P 500) note with 138% leveraged uncapped upside and a 25% maturity buffer. In simulation it shows an attractive expected annualized return of about 10.25% with a low 4.78% chance of a loss, but that profile comes bundled with a binary downside and a heavier tail than simply holding the indices – a classic trade of “less often wrong, more painful when wrong.”