
Callable Jump Notes due November 4, 2031 — Simulation Analysis
Headline simulation results
- Expected annualized return: 8.85%
- Probability of negative return: 0.00% (principal protected at maturity; issuer credit risk is ignored in the simulation)
- 99% confidence VaR (1-year, 1st percentile annualized return): 0.00%
- Expected holding period: 4.07 years (48.89 months)
- Probability of early call: 38.65%
The product is a principal-protected, callable equity-linked note. In the simulation it produced a non-negative return in every path, but its upside is materially constrained by the issuer's call feature. The expected total return over the realized holding period is 34.24%, with a median total return of 29.58%.
Product at a glance
| Item | Detail |
|---|---|
| Issuer / guarantor | Morgan Stanley Finance LLC / Morgan Stanley |
| Underlying | S&P 500 Futures Excess Return Index |
| Principal amount | $1,000 per note; 100 index points |
| Coupon | None |
| Participation rate | 160% of the underlying's upside |
| Downside | Principal protected at maturity, subject to issuer credit risk |
| Call feature | Monthly from November 2027; increasing redemption payments; model-dependent |
| Maturity | November 4, 2031 |
How it works
- If the notes are not called and the underlying finishes above its initial level, the investor receives the principal plus 160% of the index gain.
- If the underlying finishes at or below its initial level, the investor receives the principal back.
- The issuer can call the notes monthly beginning in November 2027. The first call redemption is 117.75 index points (a 17.75% return); the final scheduled call redemption is 187.27 index points (an 87.27% return).
- The call is not an automatic index trigger. It depends on the issuer's risk-neutral valuation model. In the simulation, the notes are called when the model value of continuing exceeds the scheduled redemption payment.
- Because the issuer is more likely to call after strong index performance, the call feature effectively caps the investor's upside. Once called, no further payments are made.
- There is no coupon; the only return comes from the call redemption or the maturity payment.
Key statistics
Risk and return summary
| Strategy | Expected annualized return | Expected annualized volatility | Probability of loss | 99% VaR (1st percentile annualized return) |
|---|---|---|---|---|
| Structured product | 8.85% | 6.72% | 0.00% | 0.00% |
| Underlying total return (incl. dividends) | 9.49% | 11.56% | 19.65% | -13.34% |
| Underlying price return | 8.50% | 11.56% | 22.89% | -14.33% |
| Risk-free rate (1-year T-bill average) | 3.85% | 0.00% | 0.00% | 0.00% |
Holding period and scenario probabilities
| Metric | Value |
|---|---|
| Expected total return over realized holding period | 34.24% |
| Median total return | 29.58% |
| Expected holding period | 48.89 months (4.07 years) |
| Called early | 38.65% |
| Held to maturity | 61.35% |
| Probability total return less than or equal to 0% | 22.89% |
| Probability annualized return greater than 10% | 48.99% |
| Probability annualized return greater than the risk-free rate | 67.10% |
| Probability product total return exceeds underlying total return | 61.25% |
Because holding periods vary from one to five years, the annualized figures are averages of each simulation's CAGR, not the CAGR of the average total return. The average total return of 34.24% over the average 4.07-year holding period implies a CAGR of about 7.49%, while the mean of per-simulation CAGRs is 8.85%. The difference reflects the mix of early-call outcomes, zero-return outcomes, and different holding periods. The product's median annualized return is 9.66%.
The product's expected annualized return is lower than the underlying's total-return figure by about 0.64 percentage points, but it is achieved with roughly 58% of the underlying's volatility and with no negative outcomes in the simulation. The trade-off is a capped upside: the product's best annualized outcome is about 17.75%, while the underlying's 99th percentile annualized total return is about 39.55%.
Simulation charts
Product vs underlying outcomes
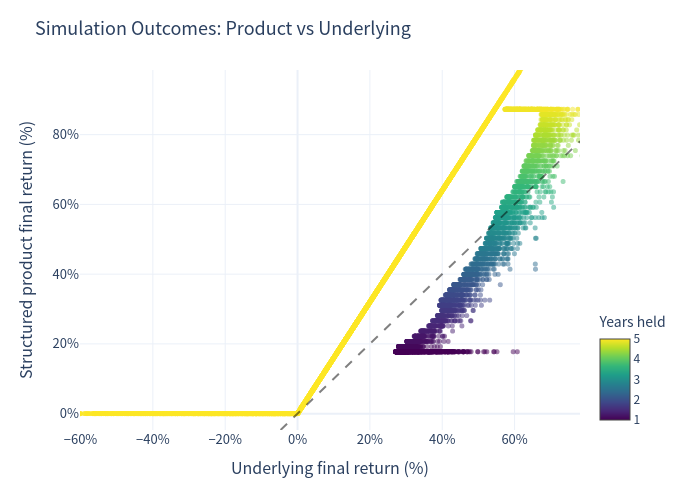
Points above the dashed 1:1 line are simulations in which the product beats the underlying. The product has a hard floor at 0% and a cluster of outcomes around the early-call redemption levels. The underlying has a much wider range, including large losses and large gains.
Underlying annualized total-return distribution
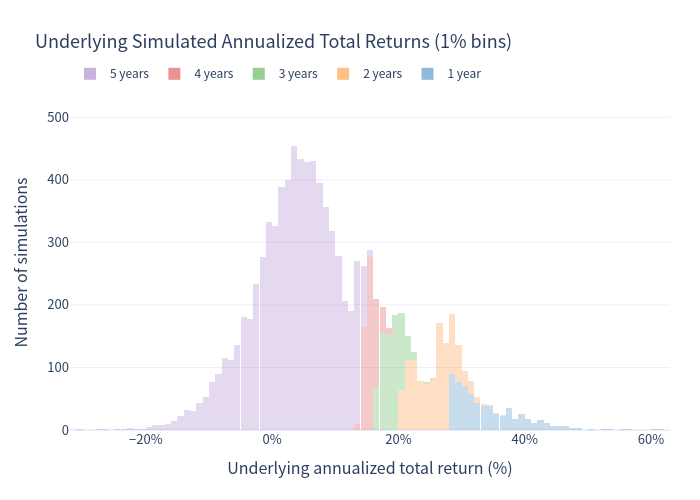
The underlying's simulated annualized total return has a mean of 9.49%, a median of 7.43%, and a 1st percentile of -13.34%. The right tail is visible: the 99th percentile is about 39.55%.
Product annualized return distribution
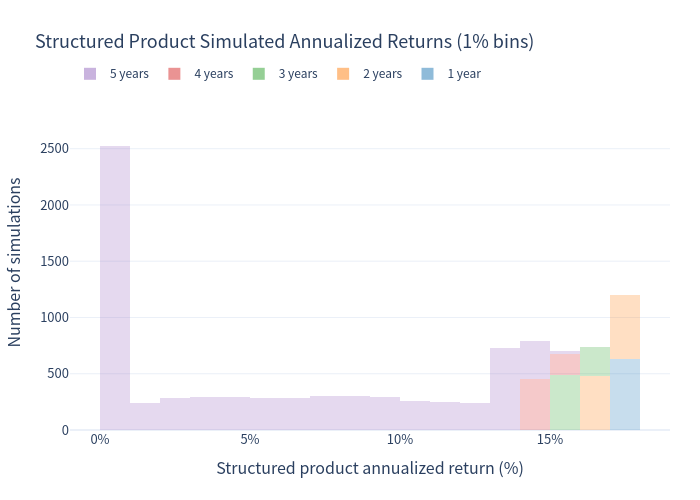
The product's simulated annualized return has a mean of 8.85%, a median of 9.66%, and a 1st percentile of 0.00%. The spike at 0% represents paths that are not called and finish at or below the initial index level. The upper cluster reflects early calls and maturity outcomes.
Scenario probabilities
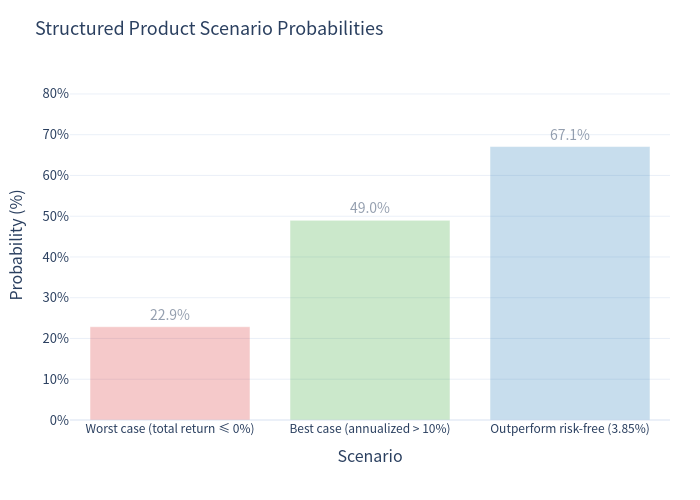
- Worst case (total return ≤ 0%): 22.89% — all of these are zero-return outcomes, not losses.
- Best case (annualized return > 10%): 48.99%.
- Outperform the risk-free rate: 67.10%.
Risk / return comparison
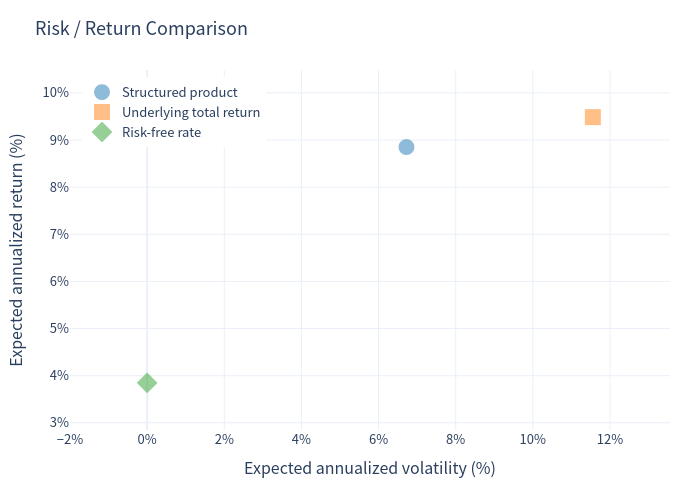
The product sits between the risk-free rate and the underlying total return: higher expected return than cash, lower volatility than the underlying, and a lower mean annualized return than the underlying total return.
Annualized return box plot
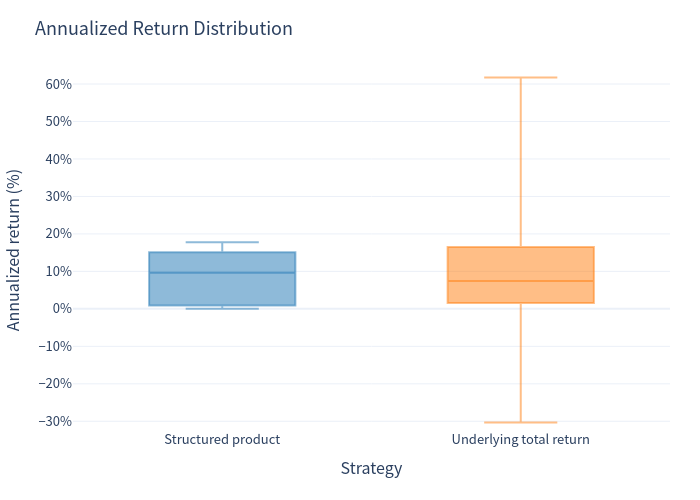
The product's interquartile range is much tighter than the underlying's, with no downside tail below 0%. The underlying's box extends into negative territory.
Holding-period distribution
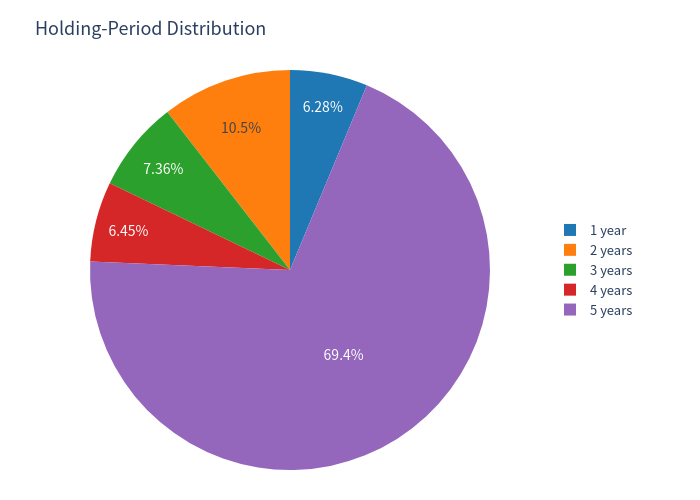
About 69.40% of paths are held into year 5 or to maturity (including the final call date and maturity), while 6.28% are called in year 1, 10.51% in year 2, 7.36% in year 3, and 6.45% in year 4.
Call outcome
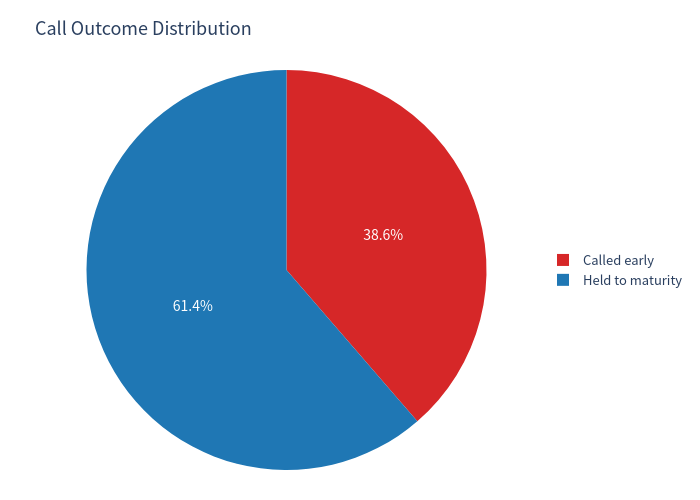
The notes are called early in 38.65% of simulations and held to maturity in 61.35%.
Investment commentary
Positive features
- Principal protection at maturity: the simulated product never produces a negative return; the minimum outcome is a return of principal.
- Leveraged upside: if the index rises and the notes are not called, the investor receives 160% of the index gain.
- Attractive call premiums: the first call redemption is 17.75% and the final scheduled call redemption is 87.27%, which supports the product's return in rising markets.
- Lower volatility than the underlying: simulated annualized volatility is 6.72% versus 11.56% for the underlying total return.
- Frequent outperformance of cash: the product beats the risk-free rate in 67.10% of simulations.
- Frequent outperformance of the underlying on a total-return basis: the product's total return exceeds the underlying's total return in 61.25% of simulations over the same holding period.
Trade-offs and risks
- Upside is effectively capped by the call feature. In strong markets, the underlying can materially outperform the product. The product's best annualized outcome is about 17.75%, versus a 99th percentile underlying annualized total return of about 39.55%.
- Early call / reinvestment risk. The notes are called early in 38.65% of simulations. If called, the investor receives the scheduled redemption payment but must reinvest the proceeds at prevailing market terms.
- Zero-return risk. In 22.89% of simulations the notes are held to maturity and the index finishes at or below its initial level, producing a 0.00% total return over roughly five years.
- No coupon income. The product provides no regular cash flow; the investor forgoes coupon income in exchange for principal protection and upside participation.
- Model-dependent call. The actual call decision is at the issuer's discretion and depends on its risk-neutral valuation model, market inputs, and credit spreads. The simulation uses a risk-neutral optimal-call boundary as a practical approximation; actual calls may differ.
- Credit risk. Payments are obligations of Morgan Stanley Finance LLC and are guaranteed by Morgan Stanley. The notes are not deposits and are not FDIC-insured. The simulation ignores credit risk.
- Underlying definition. The reference index is an excess-return index and does not include dividends. The benchmark comparison adds a 0.99% dividend yield to the underlying price return; the product itself does not receive that dividend yield.
- Liquidity. The notes are not listed on an exchange.
Key assumptions
- 10,000 monthly simulations over a 60-month horizon.
- Historical underlying volatility of approximately 19.55% annualized.
- Risk-free/discount rate of 3.85% (1-year average T-bill yield).
- Real-world equity risk premium of 6.00% applied to the excess-return index; no risk-free add-on.
- Benchmark dividend yield of 0.99% added for total-return comparison only.
- The exact S&P 500 Futures Excess Return Index does not provide a long daily history; the S&P 500 price index is used as a practical proxy.
- Returns are gross of fees, commissions, and taxes.
This report is a quantitative product evaluation, not investment advice or a suitability assessment.