
Structured Product Evaluator
info@tokenengine.ai
Morgan Stanley SPXFP Callable Jump Notes due November 4, 2031 — Simulation Analysis
Headline Simulation Results
Based on a Monte-Carlo simulation of the SPXFP index (10,000 paths, monthly steps, 5-year horizon), applying the issuer's stated risk-neutral call rule and the contractual maturity payoff:
| Metric | Structured Product | Underlying (SPXFP proxy) |
|---|---|---|
| Expected annualized return | 10.98% | 9.60% |
| Probability of a nominal loss | 0.00% | 21.21% |
| 99% confidence VaR (1-yr, annualized) | 0.00% | −14.51% |
| Expected annualized volatility | 7.47% | 10.92% |
Downside is fully protected: across all 10,000 simulations the note never returns less than the $1,000 principal. The trade-off is a capped upside — the note's return is truncated near 17.75% p.a. because the issuer redeems (calls) the note once the index has risen enough.
Interpretation caveat: these returns embed a ~5% p.a. equity risk-premium assumption. On a pure risk-neutral basis the notes are worth only ~$930 (see Estimated value, below), so the modeled "excess" return over cash is compensation for equity risk, not a guaranteed edge. The ~7% gap between the $1,000 issue price and the estimated value is embedded cost that this analysis (per methodology) ignores.
How the Note Works (plain language)
- You pay $1,000 (the principal). The note pays no interest.
- The issuer can "call" the note — starting one year after issue and then every month — whenever a risk-neutral valuation model says redeeming is cheaper for the issuer than keeping the note alive. When called, you receive a pre-set redemption amount that "jumps" higher the longer you've held (e.g., $1,177.50 after 1 year, up to $1,872.708 after ~4.9 years — ≈ 17.75% per year, simple).
-
If the note is never called, at maturity (Nov 2031) you get:
- 160% of any index gain, plus your principal; but
- your principal back (no gain, no loss) if the index is flat or down — i.e., 100% principal protection.
So the note is a capital-protected, upside-participating structure whose realistic upside is delivered mainly through the fixed step-up call yield, not through the market.
Key Statistics — Product vs Underlying
The table below compares the structured product with simply holding the underlying SPXFP index over each simulation's matched holding period (per methodology). A 5-year unconditional buy-and-hold of the index is shown for reference.
| Metric | Structured Product | Underlying (matched horizon) | Underlying (unconditional 5-yr buy & hold) |
|---|---|---|---|
| Expected annualized return | 10.98% | 9.60% | ~3.81% |
| Annualized volatility | 7.47% | 10.92% | ~15.3% |
| Probability of loss | 0.00% | 21.21% | 28.6% |
| 99% VaR (annualized) | 0.00% | −14.51% | −15.22% |
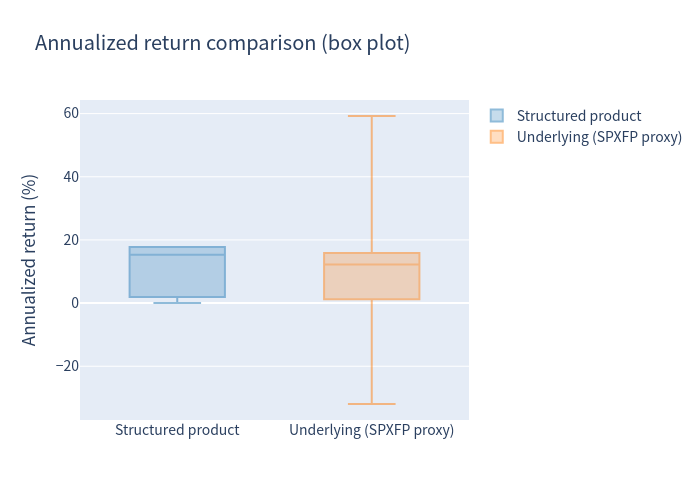
| Median annualized return | 15.29% | 12.23% | 4.29% |
| 5th / 95th percentile (annualized) | 0.00% / 17.75% | −8.17% / 27.27% | — |
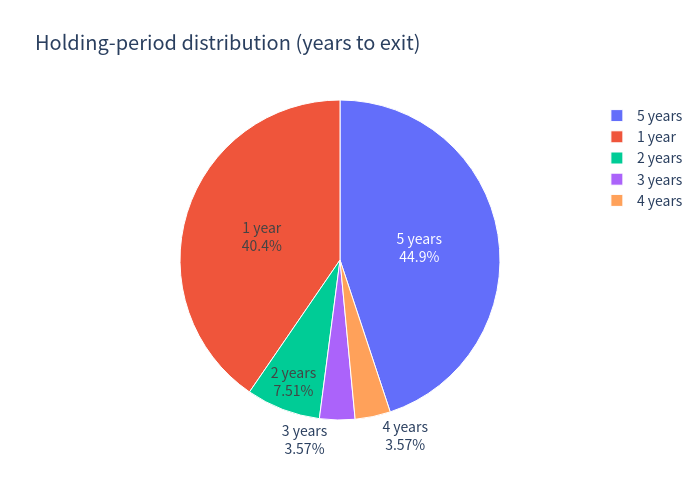
- Expected holding period: ~3.06 years (36.7 months). The note is called early ~56.5% of the time and held to maturity ~43.5% of the time.
- Expected total return over the realized holding period: 23.54% (product) vs 14.50% (index over the same periods).
- The product returned more than the index over the same holding period in 80.97% of simulations. The index "wins" mainly in the ~19% of aggressive-rally scenarios where the note's upside is capped.
- (Matched-horizon index returns overstate the index's long-run return because the note exits early when the market is up; the unconditional 5-year buy-and-hold averages ~4% p.a.)
Simulation Charts
Outcome scatter — product vs underlying total return (colour = years held)
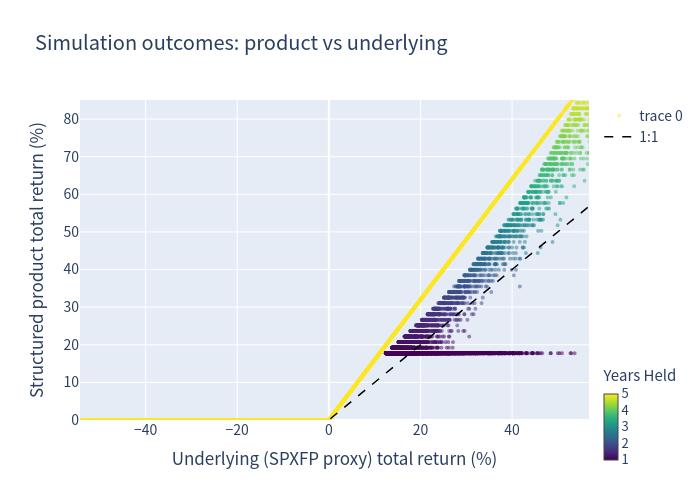
Each dot is one simulation. Dots at a return of 0% are capital-protected scenarios (principal returned). The horizontal bands of dots above 0% are the fixed "jump" redemption returns; the diagonal shows where the index simply outpaced the capped note.
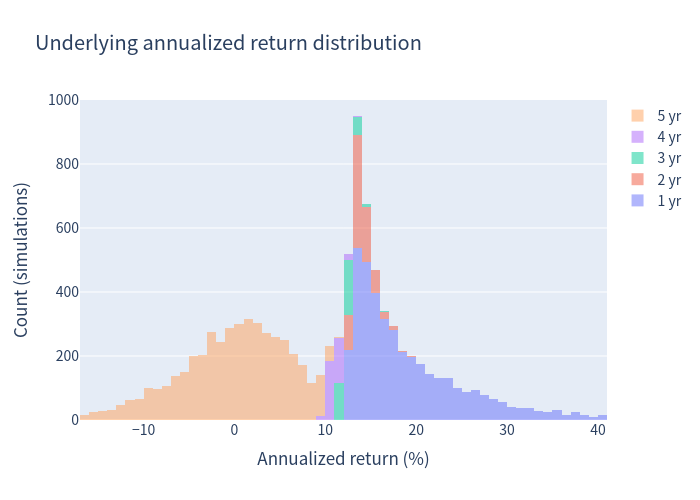
Underlying annualized-return distribution (1% bins, stacked by holding period)
Structured product annualized-return distribution (1% bins, stacked by holding period)
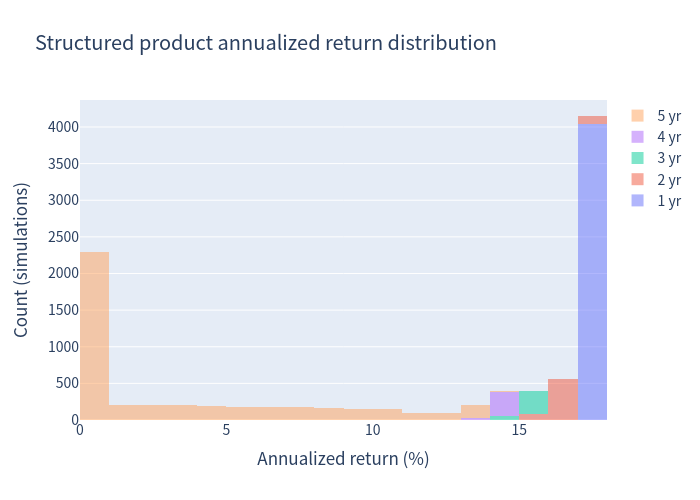
The product distribution is bimodal: a large mass at exactly 0% (held to maturity, index flat/down) and a cluster near the 15–17.75% cap (called). There are no negative-return outcomes.
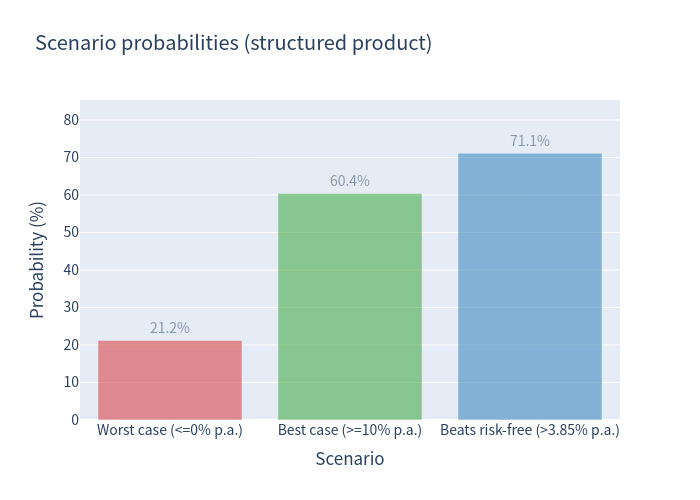
Scenario probabilities
Risk / return comparison
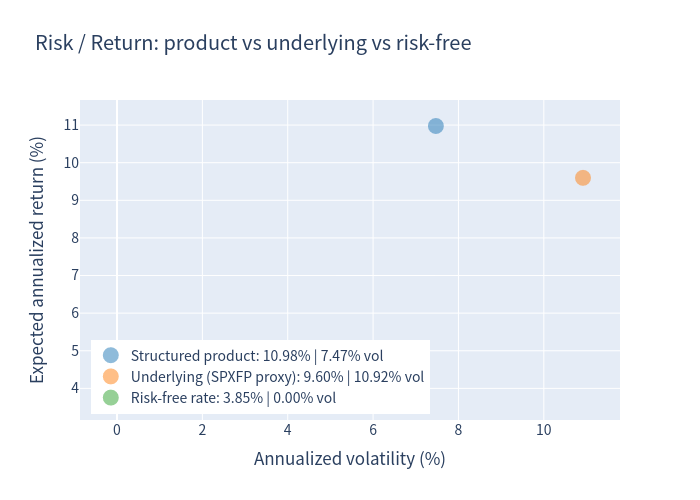
The product sits far to the left (lower volatility) of the index at a higher expected return — the visual signature of a principal-protected, capped-upside structure.
Annualized return box plot
Holding-period distribution
Investment Commentary
Favourable features
- Full principal protection with no nominal downside in any simulated path; a genuine equity-linked exposure with a 0% modeled loss probability and 0 VaR.
- High, predictable "jump" yield when called (~17.75% p.a., simple): in a moderately rising market the note is called early and locks in a strong return well above cash and above the index's long-run drift.
- 160% participation on the upside if the note is held to maturity.
- Lower volatility than the index (7.5% vs ~11% modeled) and a much better risk-adjusted profile.
Points to weigh
- Upside is effectively capped near ~17.75% p.a. by the issuer's economic call. In strong rallies the note materially underperforms the index (e.g., index's 95th percentile ≈ +27% p.a. vs note's capped +17.75%), and this is precisely when the issuer redeems.
- The attractive expected return depends on the equity risk premium (~5% p.a.) — it is not arbitrage. On a risk-neutral basis the note is worth ~$930 vs the $1,000 issue price, so ~7% of embedded fees/hedging cost is paid up front. Net of that cost, the edge over simply owning the index narrows considerably.
- Return is delivered as a fixed coupon-like jump, not market participation. In a flat or slowly falling market you simply get your principal back after up to five years (a real opportunity cost versus cash/T-bills).
- Issuer credit risk: all payments depend on Morgan Stanley's creditworthiness.
This analysis is a quantitative simulation for informational purposes only. It is not investment advice, an offer, or a recommendation, and makes no suitability assessment. Simulated results are hypothetical, depend on model assumptions (notably the equity risk premium and volatility), and are not indicative of future performance.