
SPXFP Market-Linked Certificate of Deposit — Simulation Analysis
Morgan Stanley SPXFP Market-Linked Certificates of Deposit due August 30, 2029 (CUSIP 61779WB25) — Monte Carlo simulation of payoff outcomes over the full 36-month term.
Headline Results
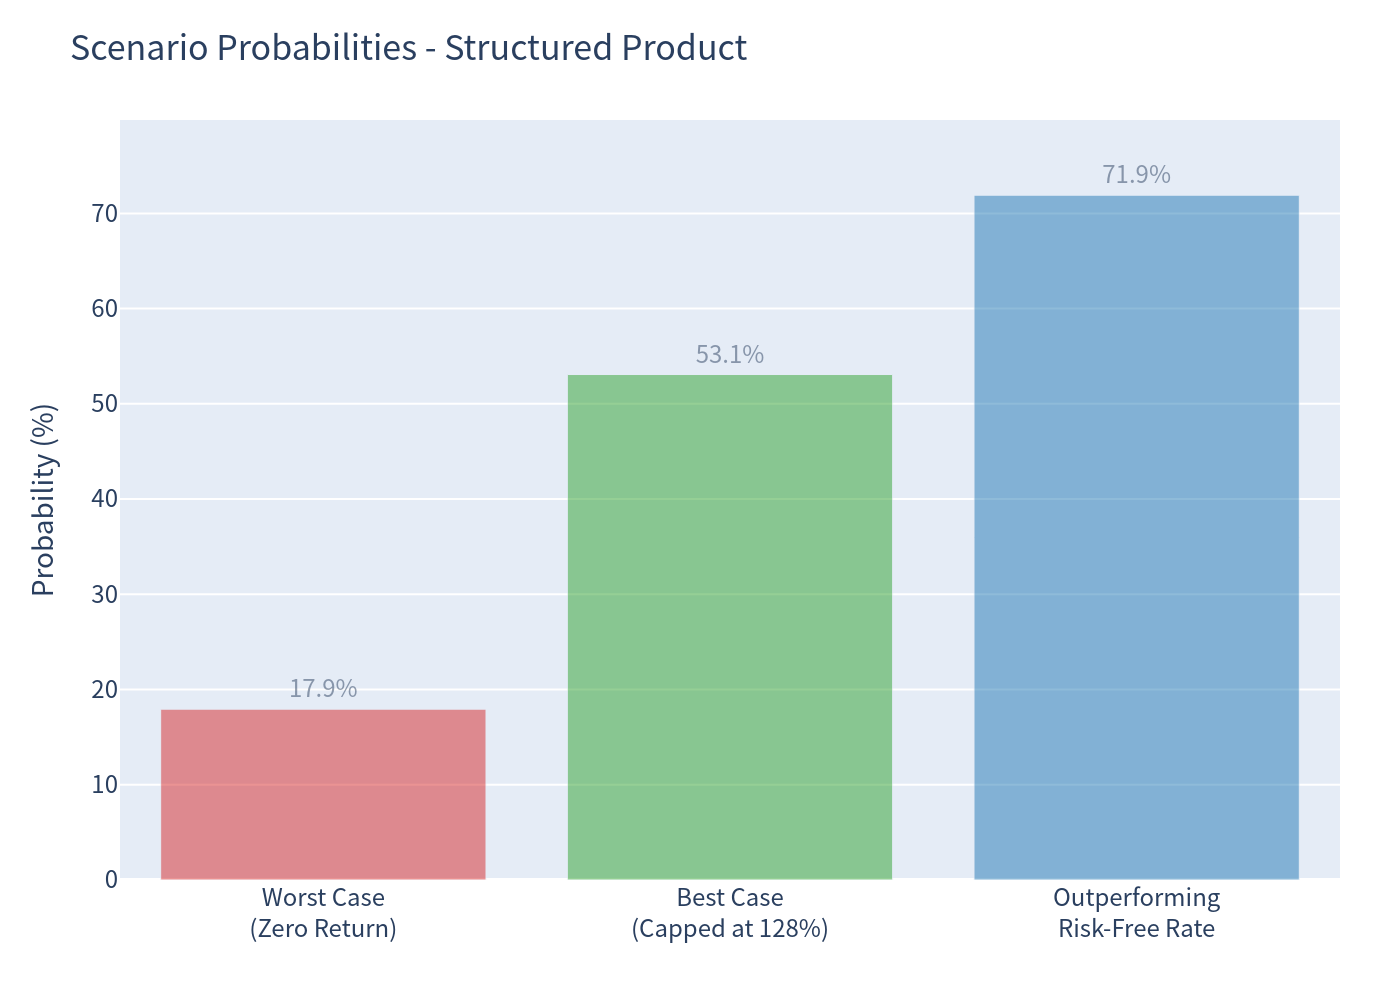
The CD offers full downside protection in exchange for capped upside. In 53.08% of simulated scenarios the underlier appreciated enough to hit the maximum payment cap (128% of deposit), while in 17.94% of scenarios the underlier finished lower and investors simply received their $1,000 principal back.
Basic Product Information
Morgan Stanley SPXFP Market-Linked Certificates of Deposit due August 30, 2029 (CUSIP 61779WB25)
- How it works: This is a principal-protected, market-linked Certificate of Deposit with a ~3-year term. The return is linked to the performance of the S&P 500 Futures Excess Return Index (SPXFP) measured only on the observation date (August 27, 2029). If the underlier is up at maturity, investors capture 100% of the gain up to a maximum payment of $1,280–$1,320 per $1,000 CD (28%–32% cap; base case analysis uses 128%). If the underlier is flat or down, investors still receive their full $1,000 deposit amount.
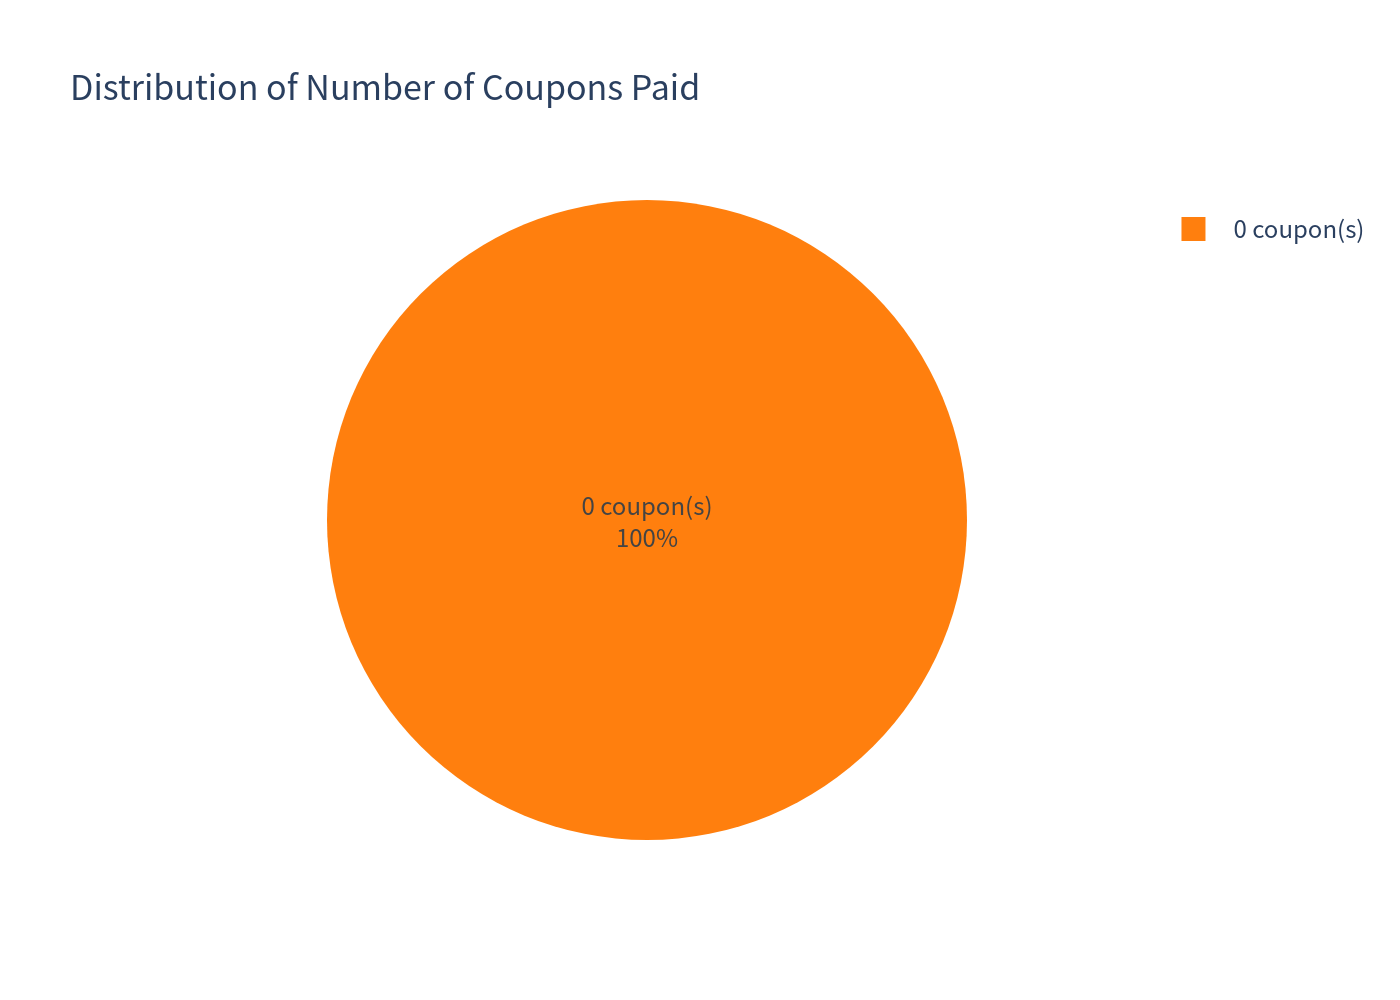
- Key features: No interest/coupon payments; no early redemption or autocall; not redeemable before maturity except on death; full principal protection (subject to issuer credit and FDIC limits).
- Trade-off: The price for protection is a capped upside — the maximum possible gain is 28%–32% over three years, regardless of how far the underlier rallies.
Key Statistics (Simulated, Annualized)
| Metric | Structured Product | Benchmark (S&P 500 Total Return) |
|---|---|---|
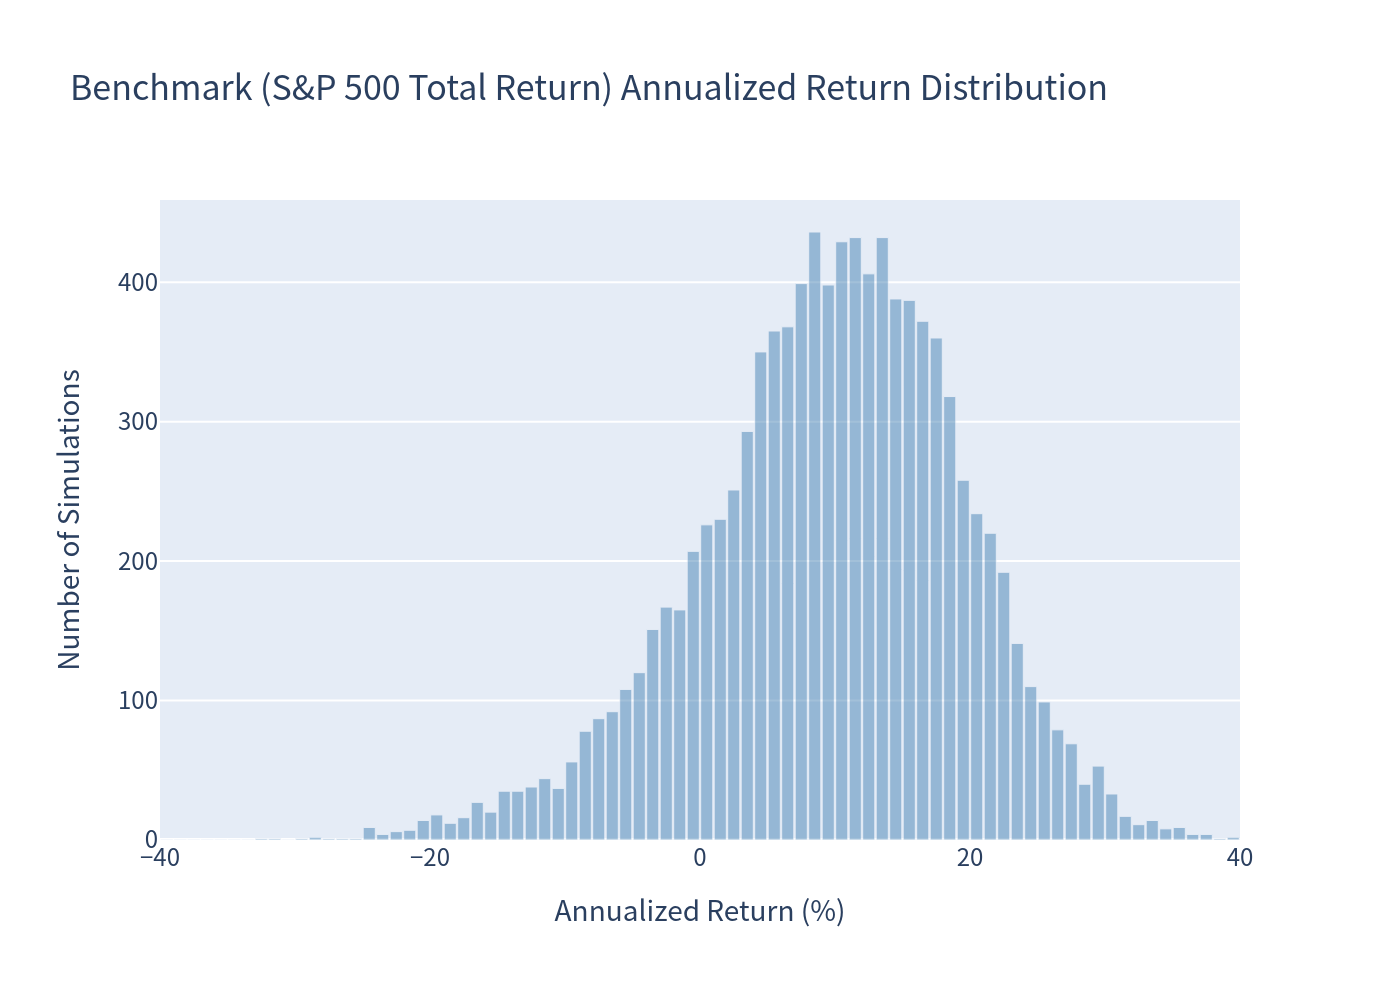
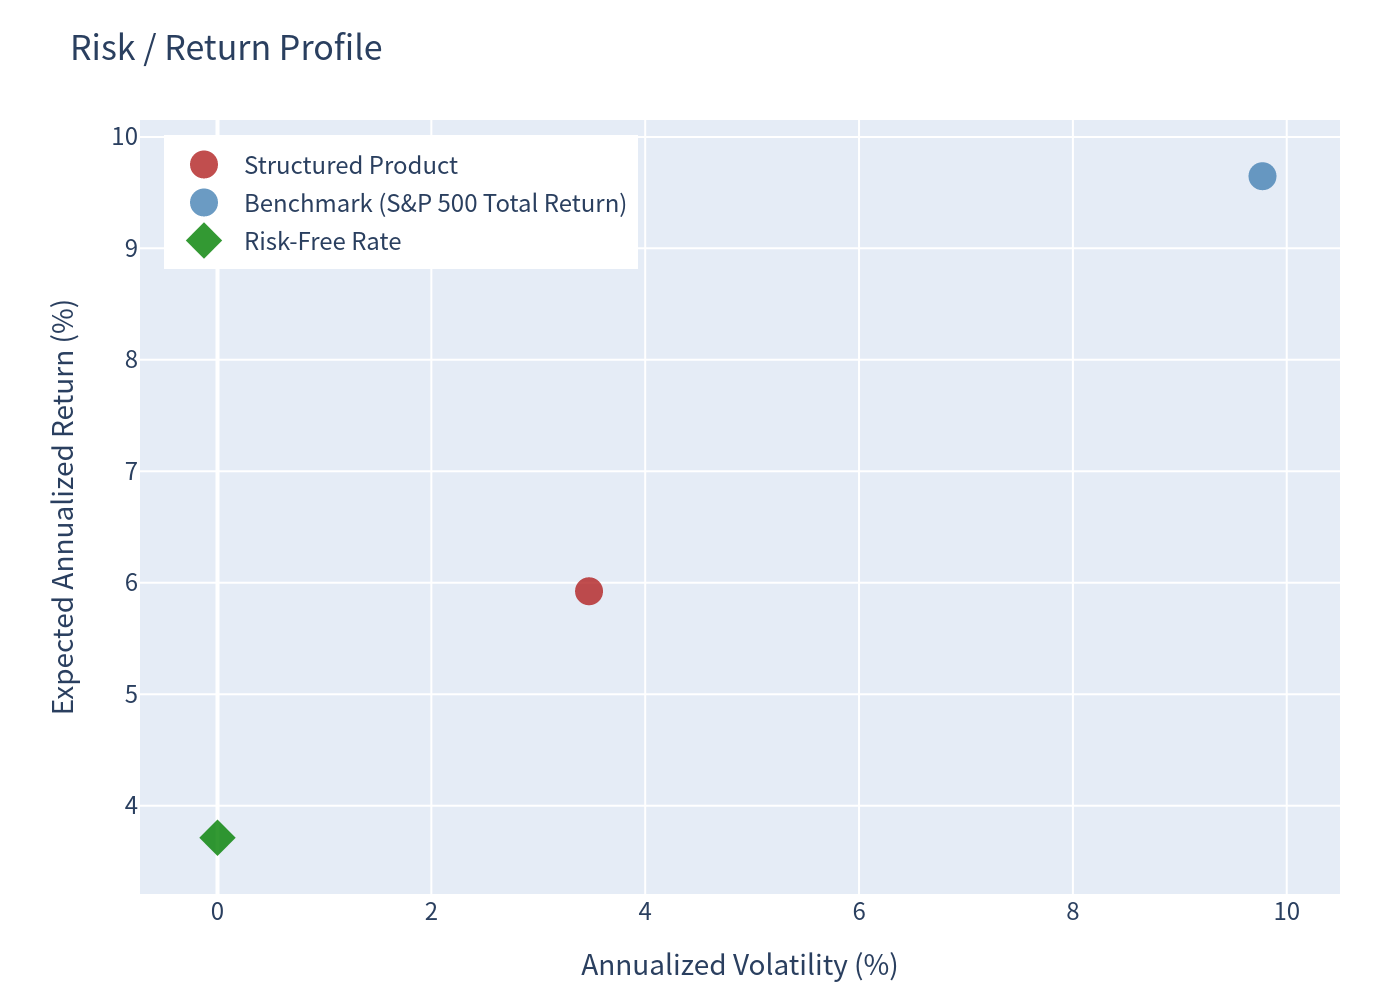
| Expected annualized return | 5.92% | 9.65% |
| Expected annualized volatility | 3.47% | 9.77% |
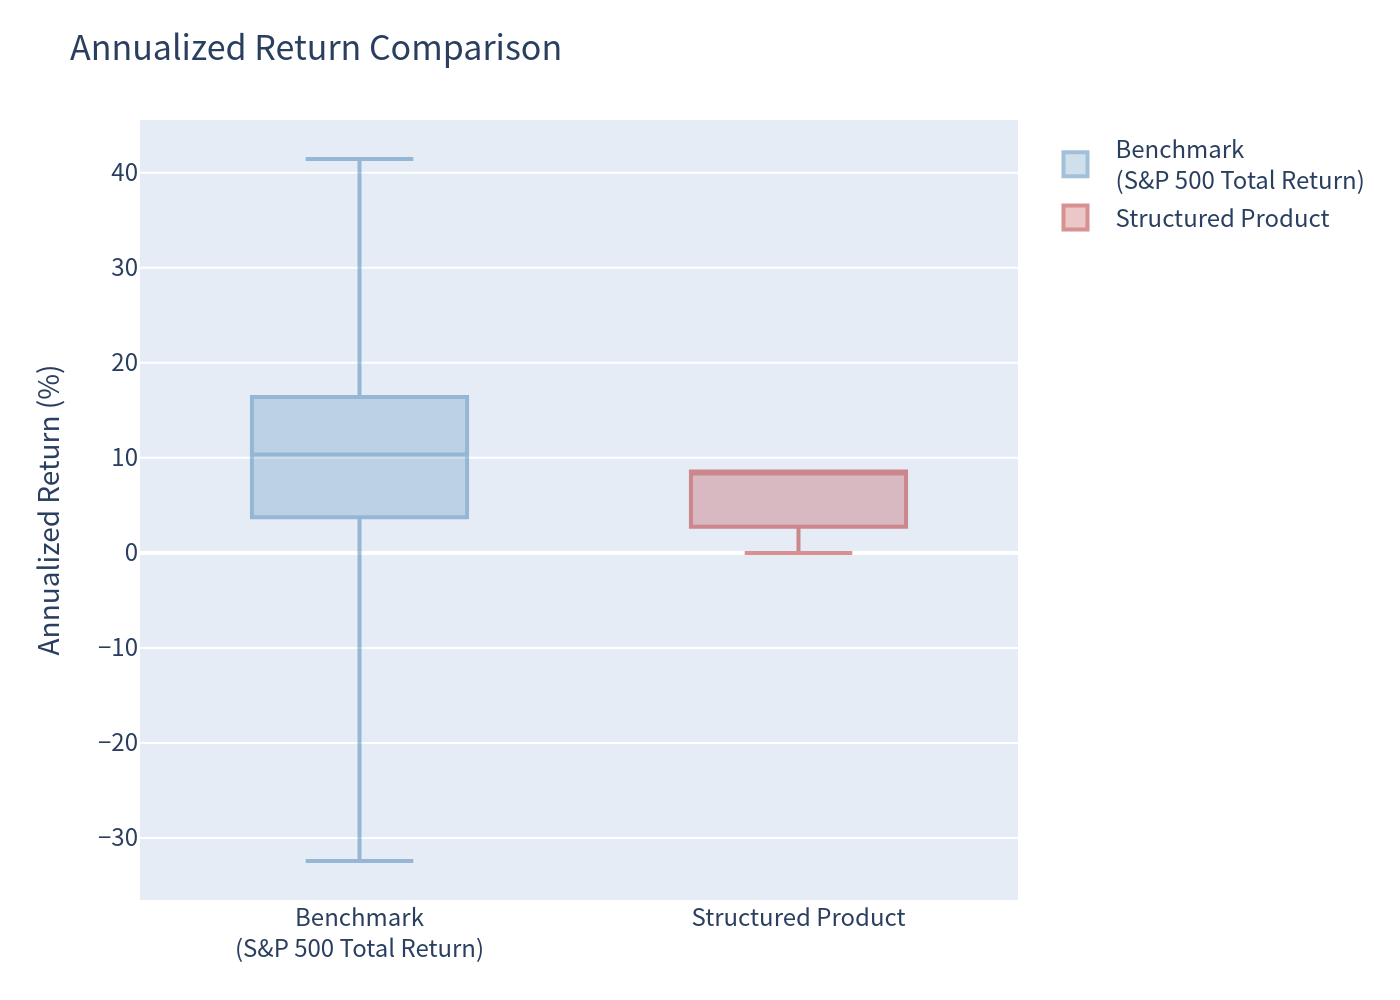
| Probability of loss | 0.00% | 15.61% |
| 99% VaR (1 year) | 0.00% | −16.67% |
| Median annualized return | 8.58% | 10.34% |
Notes: The product's payoff underlier is the S&P 500 Futures Excess Return Index (SPXFP), an excess-return futures index whose long-run performance tends to trail the S&P 500 total return (it does not earn the full cash/financing return embedded in futures). The S&P 500 price index is used as the return/volatility proxy for the payoff underlier. The benchmark column shows the S&P 500 total return (price appreciation plus reinvested dividends), which is used for performance comparison only. The small difference between the benchmark's 15.61% loss probability and the product's 17.94% principal-only probability reflects (i) dividends lifting some slightly-negative price scenarios above zero and (ii) annualized vs. 3-year total-return measurement horizons.
Outcome Distribution
| Scenario | Probability |
|---|---|
| Principal only returned (underlier ≤ 0%) | 17.94% |
| Partial participation (0% < underlier < 28%) | 28.98% |
| Maximum payment reached (underlier ≥ 28%) | 53.08% |
| Cap (term sheet range $1,280–$1,320) | Expected annualized return | Expected 3-yr total return |
|---|---|---|
| 28% (128% max) | 5.92% | 19.22% |
| 30% (130% max) | 6.22% | 20.26% |
| 32% (132% max) | 6.49% | 21.25% |
Cap sensitivity: the term sheet allows a maximum payment between $1,280 and $1,320 per $1,000 CD; the base case analysis uses the 128% cap.
Charts
Simulation Outcomes — Structured Product vs Underlying
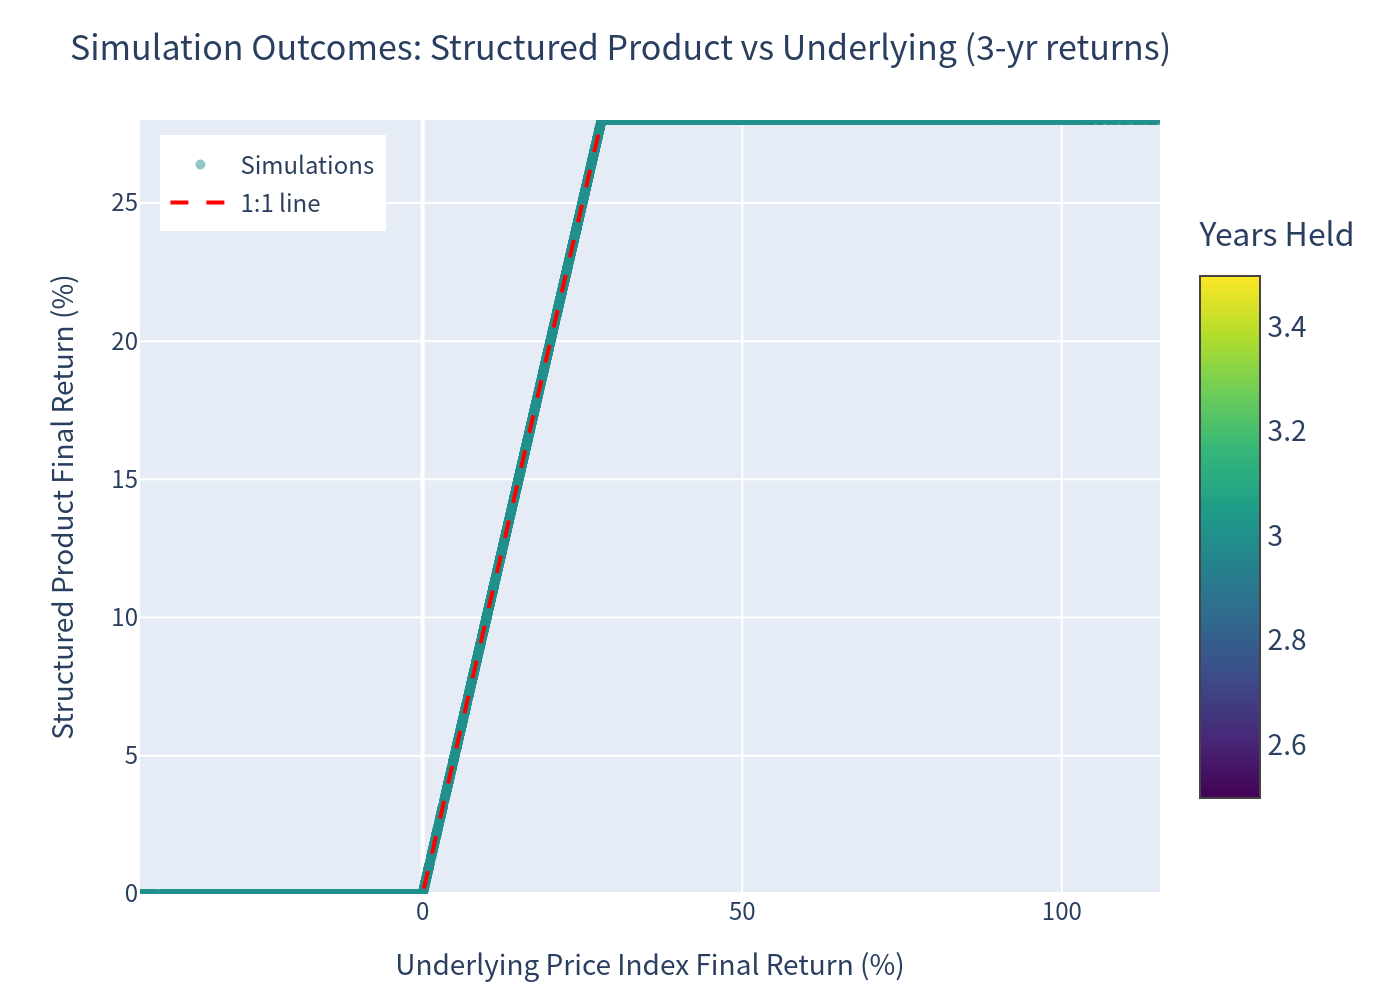
Each dot is one simulation. The product's final return is floored at 0% (principal protection) and capped at 28% (maximum payment). The dashed 1:1 line shows the uncapped pass-through reference.
Benchmark Annualized Return Distribution (S&P 500 Total Return)
Structured Product Annualized Return Distribution
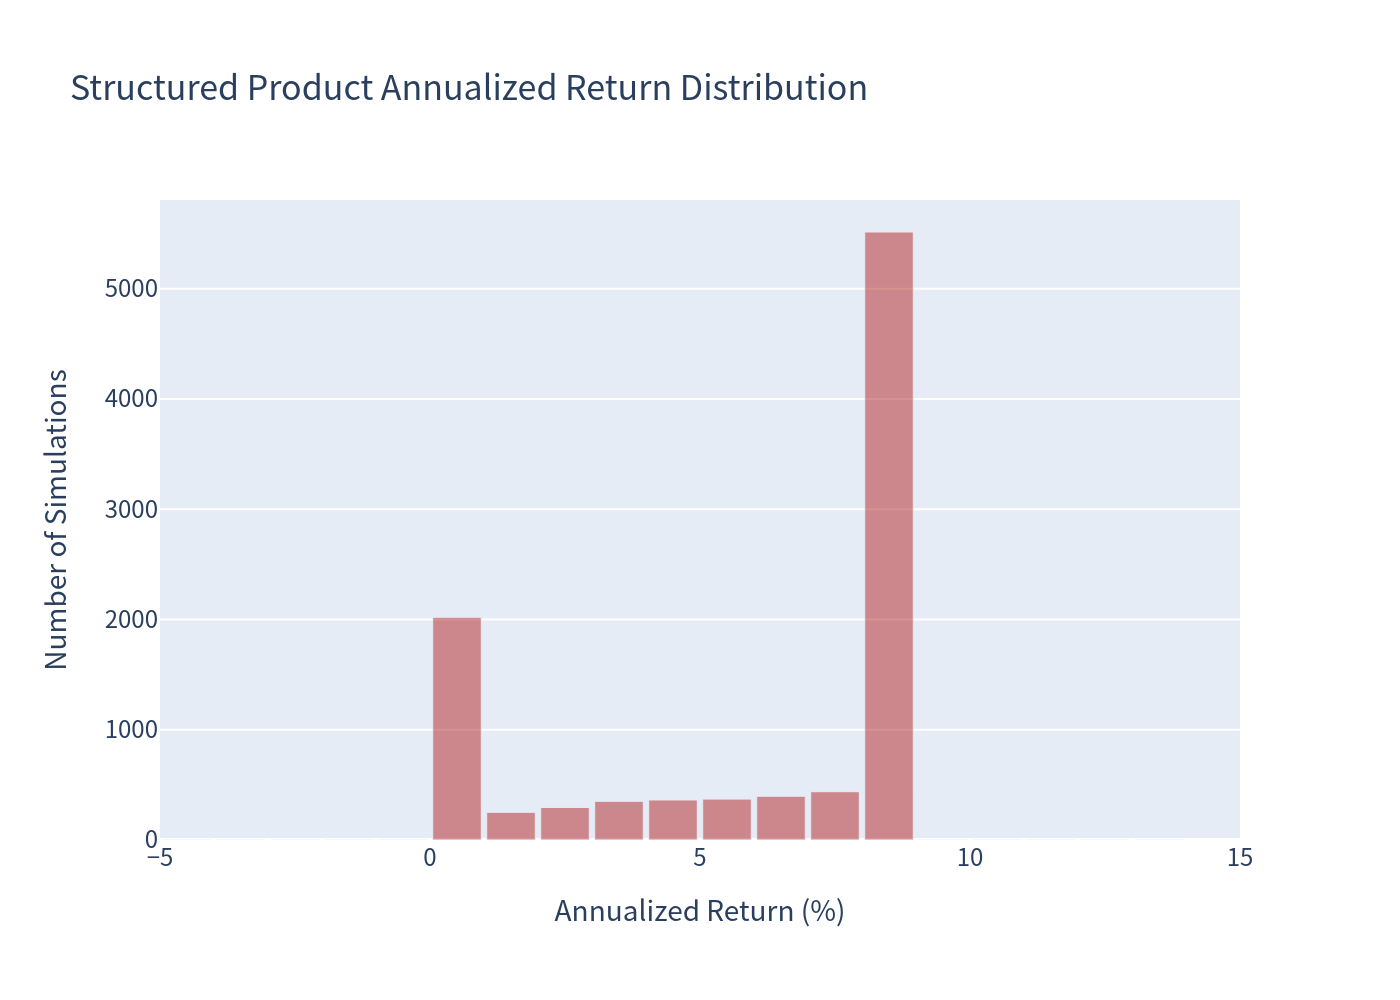
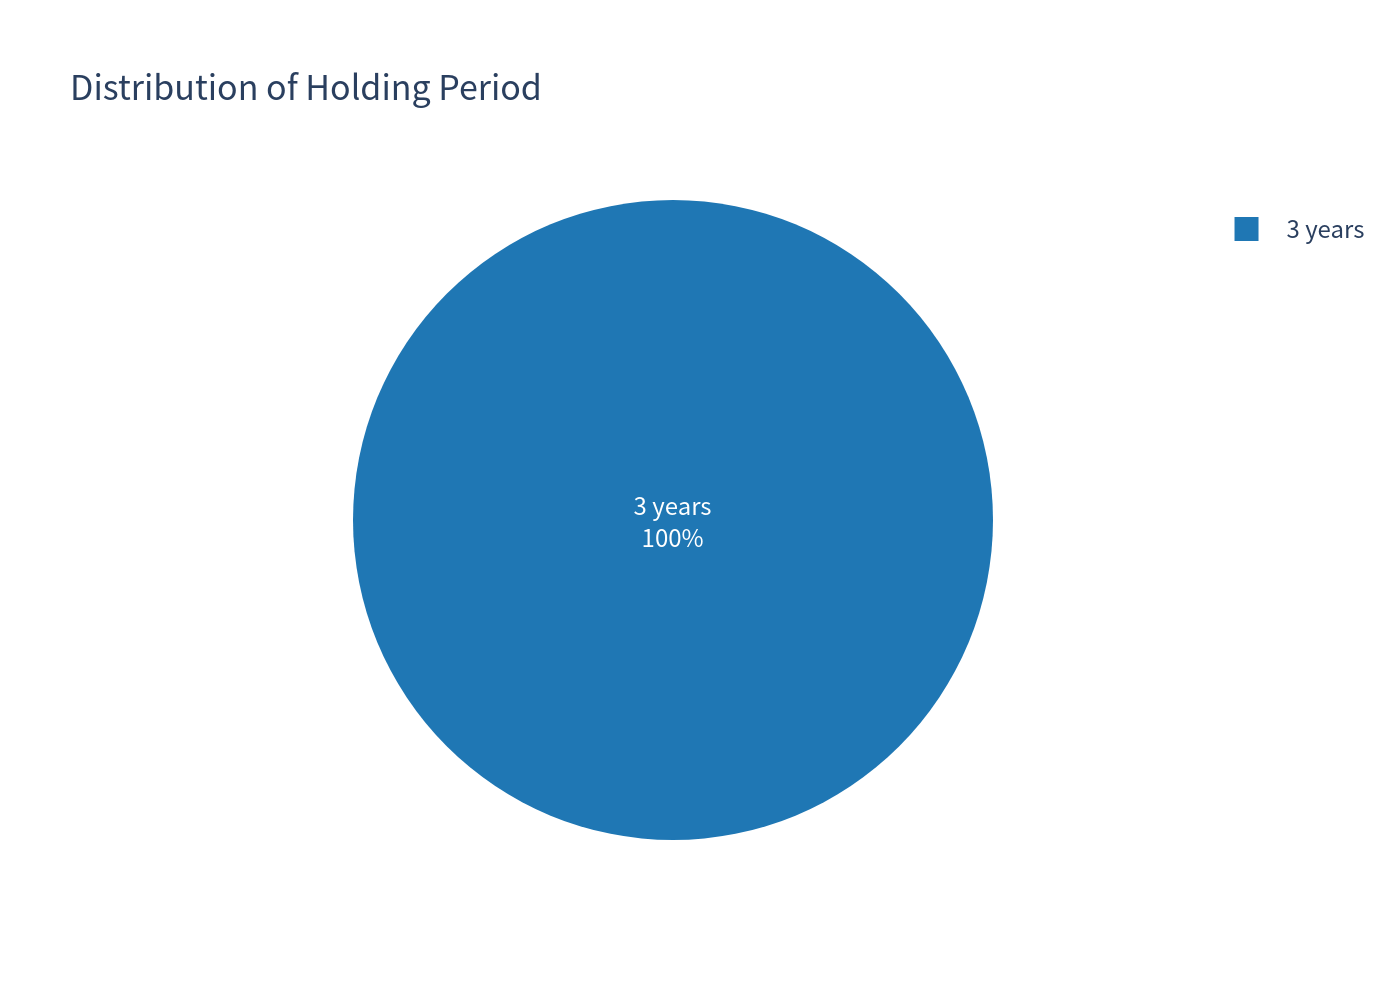
All simulations run the full 36-month term, so bars reflect 3-year holdings only.
Scenario Probabilities
Risk / Return Profile
Annualized Return Comparison (Box Plot)
Holding Period Distribution
Coupon Payment Distribution
Investment Commentary
Strengths
- Full principal protection: the worst outcome is receiving the $1,000 deposit back, with a simulated 0% probability of loss and 0% VaR.
- 100% participation in underlier gains up to the cap, giving meaningful upside in roughly 82% of scenarios where the underlier finishes higher.
- No coupons or interim events to track; simple, transparent payoff at maturity.
- Expected return of 5.92% annualized comfortably exceeds the risk-free rate (3.71%), with ~71.9% of simulations beating cash.
Considerations
- Upside is capped at 28%–32% over three years; in over half of simulated scenarios the cap is binding, so investors give up tail gains.
- Expected return is well below the direct equity benchmark (9.65% with dividends) because the principal-protection "put" and the cap are not free — the cap effectively sells away upside beyond ~9% annualized.
- The underlier (SPXFP, a futures excess-return index) structurally underperforms the S&P 500 total return over time due to roll/carry dynamics, so realized product returns may trail a simple buy-and-hold equity investment in rising markets.
- Illiquid structure: funds are locked until maturity (no early withdrawal except on death); FDIC coverage applies only up to deposit insurance limits.
This analysis is for information only and does not constitute investment advice or a suitability assessment.