
Structured Product Analysis
Morgan Stanley "Jump" Market-Linked Certificate of Deposit with Auto-Callable Feature
| Metric | Structured Product |
|---|---|
| Expected annualized return | 7.61% |
| Expected total return over realized holding period | 10.99% |
| Expected holding period | 1.62 years |
| Probability of negative return | 0.00% |
| 99% confidence VaR (1 year) | 0.00% |
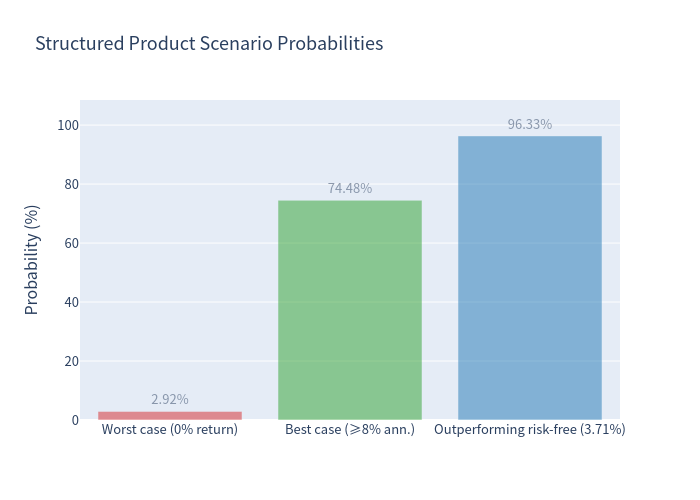
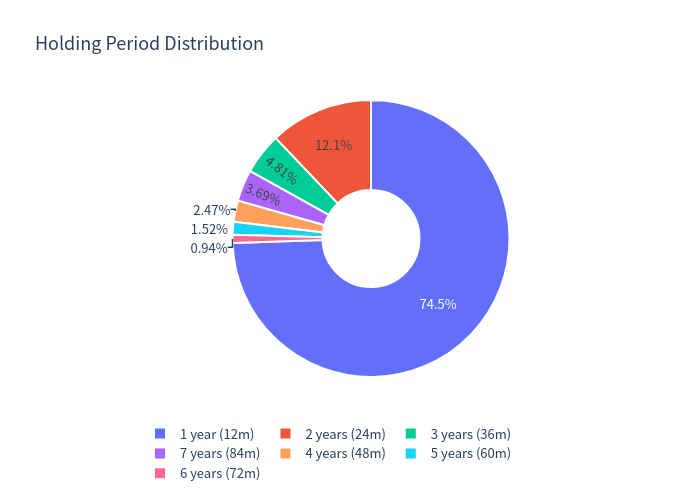
| Probability of auto-call in Year 1 | 74.48% |
How it works (layman's explanation)
- You deposit $1,000 per CD. The CD pays no periodic interest.
- Each year (from Year 1 through Year 6), if the underlying index is at or above 101% of its starting level, the CD is automatically redeemed and you receive your deposit plus 8% per year held:
- $1,080 (Year 1) · $1,160 (Year 2) · $1,240 (Year 3) · $1,320 (Year 4) · $1,400 (Year 5) · $1,480 (Year 6).
- No further payments are made after redemption.
- If the CD is never auto-called, at maturity (Year 7):
- If the index is above its starting level: you receive your deposit plus 100% of the index gain (uncapped upside).
- If the index is flat or down: you simply receive your deposit amount (principal protected).
- The deposit amount is FDIC-insured up to applicable limits ($250,000).
Underlying asset
The Morgan Stanley Amplitude Index™ is a proprietary, rules-based equity index without a public price series. This analysis uses the S&P 500 as a public proxy — all results are conditional on this assumption.
| Metric (annualized) | Structured Product | Underlying (total return, w/ dividends) |
|---|---|---|
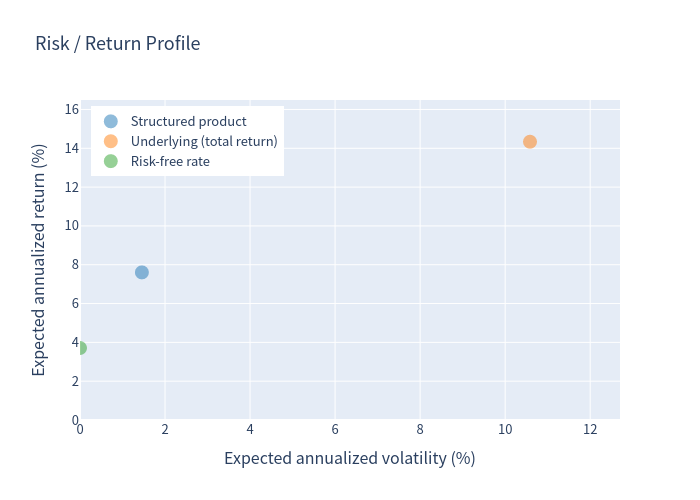
| Expected annualized return | 7.61% | 14.34% |
| Expected annualized volatility | 1.46% | 10.58% |
| Probability of loss | 0.00% | 2.53% |
| 99% confidence VaR (1 year) | 0.00% | -4.38% |
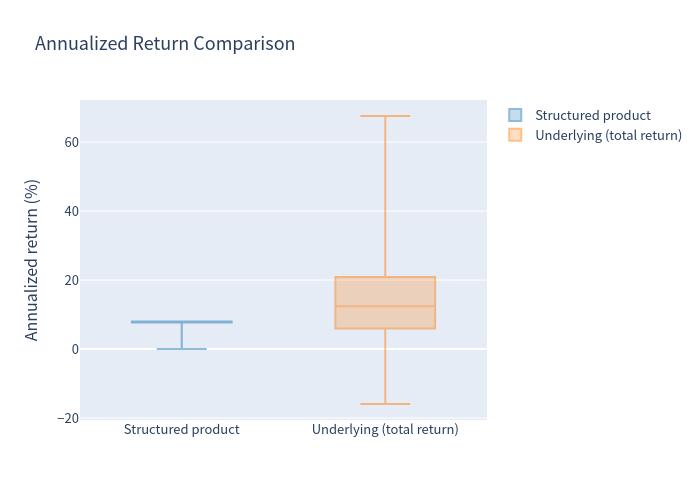
| Median annualized return | 8.00% | 12.44% |
Simulation Outcomes — Structured Product vs Underlying
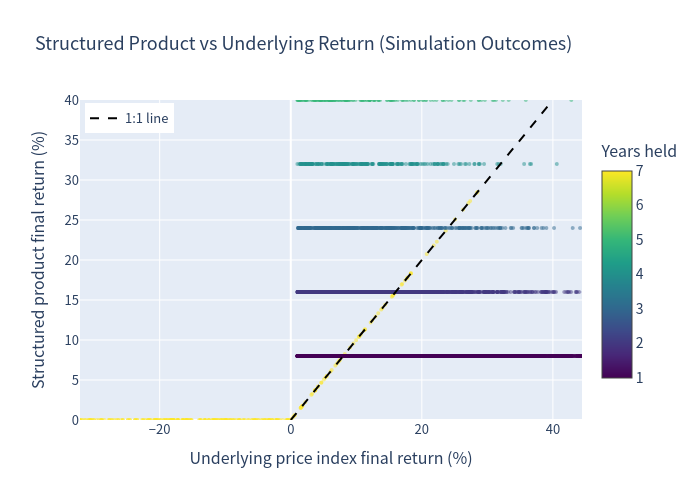
Scatter of realized holding-period outcomes for the product versus the underlying proxy.
Annualized Return Distributions
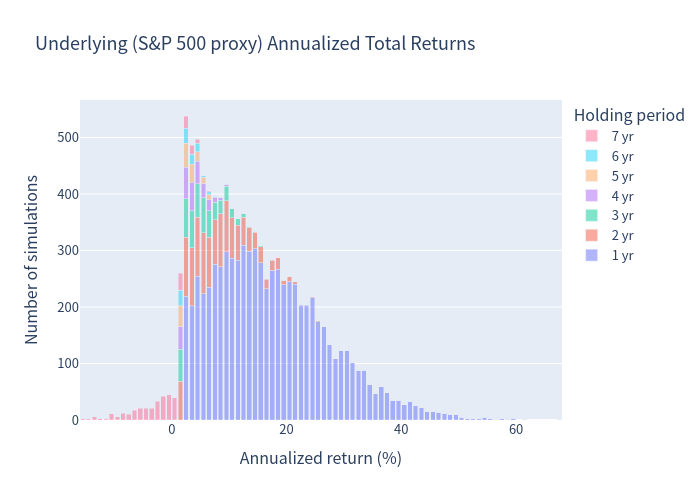
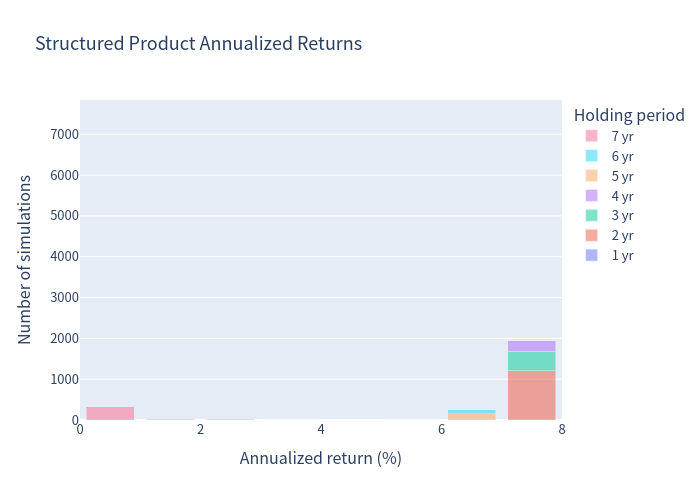
Distribution of annualized returns for the underlying proxy (top) and the structured product (bottom).
Scenario Probabilities
Estimated likelihood of each possible redemption or maturity scenario.
Risk / Return Profile
Annualized return versus volatility for the structured product and its underlying.
Annualized Return Comparison
Distribution comparison between the structured product and the underlying proxy.
Holding Period Distribution
Share of simulations ending in each year (call or maturity).
What the product does well
- Principal protection: the deposit amount is returned at maturity regardless of index performance (and is FDIC-insured up to $250,000), resulting in a 0.00% probability of loss from market moves.
- Frequent early redemption: roughly 3 out of 4 simulations are auto-called in Year 1, paying an 8% return for a single year.
- Uncapped upside at maturity: if the CD is never called and the index is up at maturity, investors receive 100% of the index gain with no cap.
- Attractive relative to cash: the product beat the risk-free rate (3.71%) in 96.33% of simulations.
Points to keep in mind
- No periodic income: the CD pays no coupons; all return is delivered via the redemption payment at call or maturity.
- Effective upside ceiling near 8% p.a. in most scenarios: the maturity payoff is contractually uncapped, but because the auto-call triggers in most scenarios, the realized annualized return is ~8% for the vast majority of outcomes; large equity rallies are typically surrendered after the Year-1 call.
- Foregone dividends: the payoff is linked to the price index, so the underlying's dividend yield (≈1.01%) is not captured by the product — a meaningful drag versus holding the index directly.
- Expected return trade-off: the expected annualized return (7.61%) is lower than the expected annualized return of a direct equity investment (14.34%), which is the price paid for the principal protection and early-call feature.
Reading the numbers carefully
Because most simulations end in Year 1 (74.48%), annualized figures for the underlying can look high (a large one-year gain annualizes to a large number), while the product's annualized return sits near 8%. It is most informative to interpret the expected total return (10.99%) together with the expected holding period (1.62 years).