
Evaluation Report — 10.60% p.a. Multi Barrier Reverse Convertible (Worst-of, Callable)
Headline Simulation Results
Based on 10,000 Monte-Carlo paths of the three Swiss underlyings over the ~15-month life:
| Metric | Structured Product |
|---|---|
| Expected annualized return | +4.49% |
| Median annualized return | +10.60% |
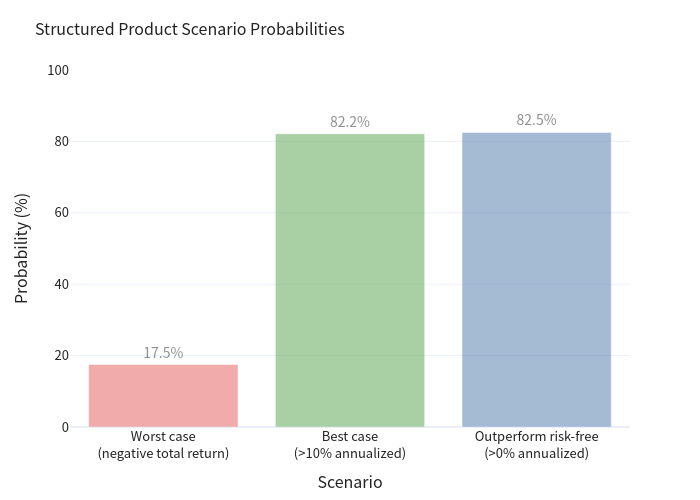
| Probability of a negative return | 17.50% |
| 99% VaR (1-year, 1st percentile) | −40.00% |
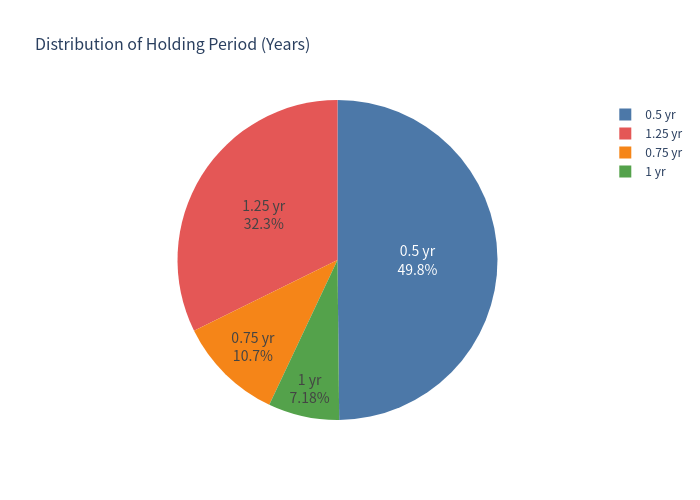
| Expected holding period | 9.7 months (67.7% called early) |
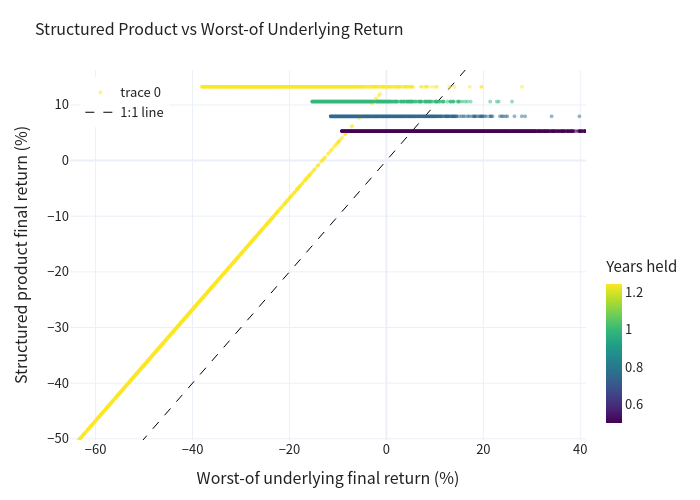
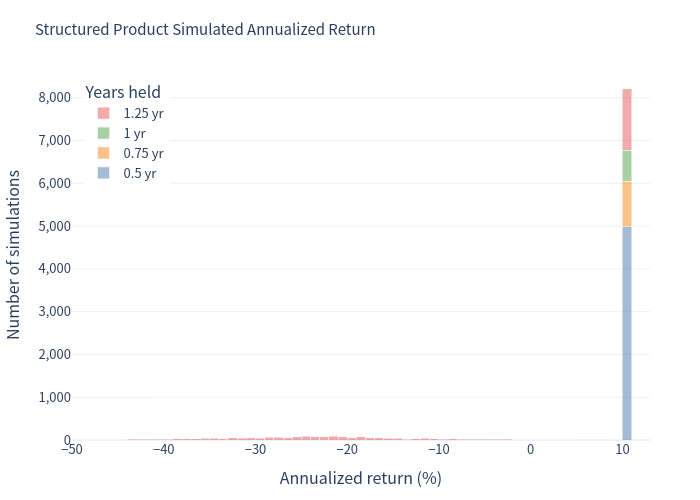
The product is strongly bimodal: in roughly 82% of scenarios it redeems without a losing barrier breach (called early, or reaching maturity with the barrier never touched — or breached but the worst stock recovering to at least its starting level) and delivers very close to the 10.60% coupon return. In the remaining ~17.5% of scenarios the 59% barrier is breached and the worst-performing stock finishes below its strike, causing an average −29% total loss. The coupon income is steady, but the downside is concentrated and severe when it occurs.
How It Works (Plain Language)
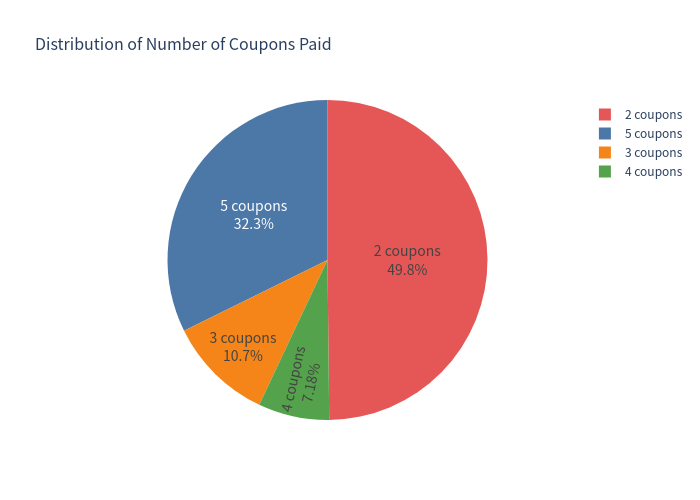
- You receive a fixed 10.60% annual coupon (2.65% paid each quarter for five quarters) regardless of how the stocks perform, provided the product is still alive.
- The product is “worst-of”: its fate is tied to whichever of Avolta, Richemont, or Swatch performs worst.
- Barrier protection: as long as no stock ever trades at or below 59% of its starting price (monitored continuously), you get your full CHF 1,000 back at maturity.
- If the 59% barrier is breached at any point, protection is lost permanently. At maturity you then receive the full par value only if the worst stock has recovered to at least its starting level; otherwise you take the downside of the worst stock (below-strike loss).
- Issuer call: the issuer may redeem early at par (plus that quarter’s coupon) on three observation dates. In practice the issuer calls when the stocks are performing well and the barrier looks safe — so your upside is capped and good outcomes tend to end early.
- Upside is capped at par + coupons; you never participate in stock gains beyond the coupon.
This is a typical yield-enhancement / reverse-convertible trade-off: a high headline coupon in exchange for capped upside and concentrated downside tail risk.
Key Statistics
| Metric | Structured Product | Benchmark (equal-weight basket, total return) |
|---|---|---|
| Expected total return (over realized holding period) | +1.11% | +4.44% (price only) |
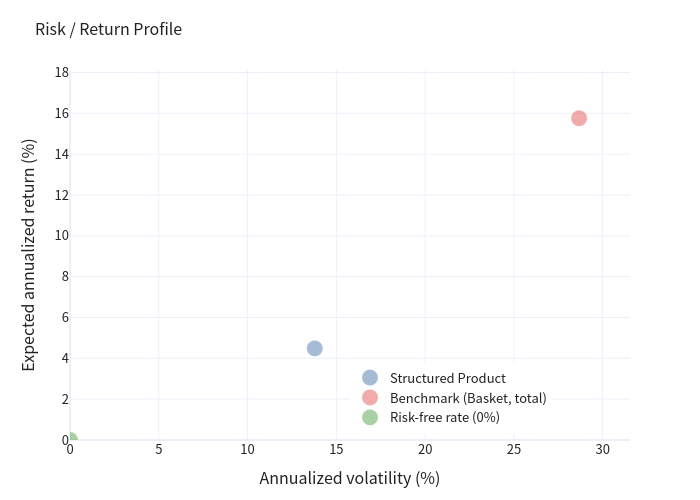
| Expected annualized return | +4.49% | +15.76%* |
| Expected annualized volatility | 13.78% | 28.67%* |
| Probability of loss | 17.50% | 33.77% |
| 99% VaR (1-year) | −40.00% | −37.15% |
| Risk-free rate (CHF) | 0.00% | 0.00% |
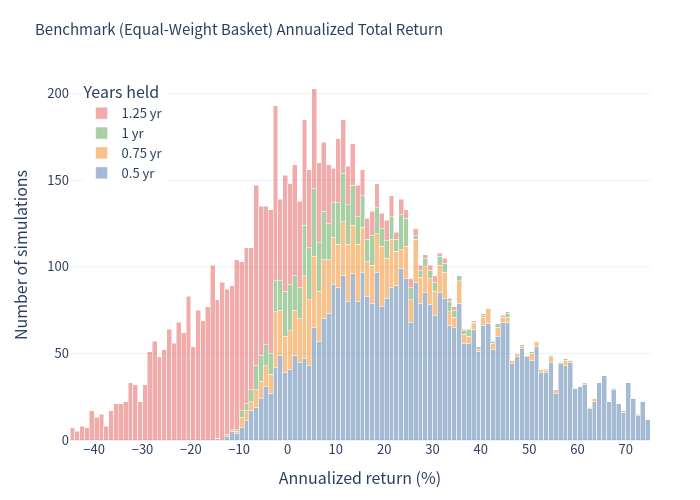
*The benchmark’s same-horizon annualized figures are inflated because many paths end early (the product is called when markets are strong), and those short-period gains are annualized up. For a clean long-run reference, a buy-and-hold of the equal-weight basket over the full 15 months returns +7.25% total (≈ +7.6% annualized including ~2.38% dividends). Investors should weigh total return and holding period together; annualized figures over short holding periods can look extreme.
Outcome distribution
Charts
Product vs. Worst-of Underlying (per simulation)
Each point is one simulation. The horizontal band at +5% to +13% shows capped good outcomes; the diagonal cluster shows barrier-breach losses where the product tracks the worst stock (plus the accumulated coupon).
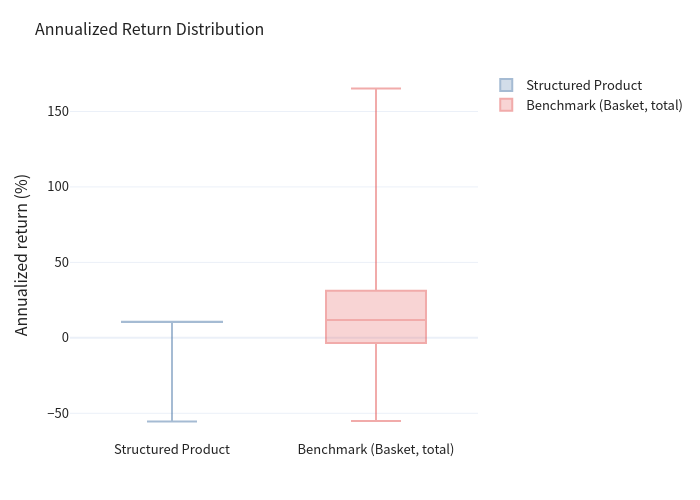
Structured Product — Annualized Return Distribution
A sharp spike at ~10.6% (the coupon) with a distinct left tail of losses — colored by holding period.
Benchmark (Equal-Weight Basket) — Annualized Total Return Distribution
The basket’s upside is far wider (barrier-free, uncapped) but it carries a comparable or larger loss frequency.
Scenario Probabilities
Risk / Return Profile
The product sits at lower volatility than the equity basket but with a lower expected return, reflecting capped upside.
Annualized Return — Box Plot Comparison
Holding Period Distribution
Number of Coupons Paid
Investment Commentary
Strengths
- High headline coupon (10.60% p.a.) in a near-zero CHF rate environment; even after accounting for the embedded risk, the expected return is positive (+4.5% annualized) and well above cash.
- Frequent income: a fixed 2.65% coupon is paid each quarter regardless of market moves while the product lives.
- Favourable typical outcome: in ~82% of scenarios you earn essentially the full coupon; the median outcome is +10.6% annualized.
- Conditional protection: if no stock ever trades at or below the 59% barrier, you receive full par at maturity regardless of where prices finish — a stock can even end well below its starting level and you still get par, as long as it never touched 59%.
Considerations / Risks
- Concentrated downside, “worst-of”: exposure is to the weakest of three stocks; with three volatile names, the chance that one breaches the barrier is meaningfully higher than for a single stock, and losses can be large (avg −29% in loss scenarios).
- Continuous barrier at 59%: tested every business day, so even a brief intraday dip permanently removes protection.
- Capped upside: gains are limited to the coupon; you do not share in a strong equity rally (the benchmark basket’s upside is much larger).
- Issuer call: good outcomes tend to be cut short, capping your total return while leaving you exposed in bad markets (the issuer keeps the product when stocks fall).
- Tail risk is the key risk: roughly 1-in-6 scenarios produce a double-digit percentage loss, and the 99% VaR (−40%) is worse than the plain equity basket.
Summary: a high-coupon, low-volatility-looking income product whose real risk is a ~17% chance of a large, concentrated loss — typical of worst-of barrier reverse convertibles. Expected return is positive but modest; it is a yield pickup, not an equity-upside play.