
Market-Linked Certificate of Deposit (MLCD)
Simulation Analysis Report
Morgan Stanley Bank, N.A. — Market-Linked CDs due August 30, 2029,
linked to the S&P 500® Futures Excess Return Index
Headline Results
| Metric | Structured Product | S&P 500 Benchmark (proxy, total return) |
|---|---|---|
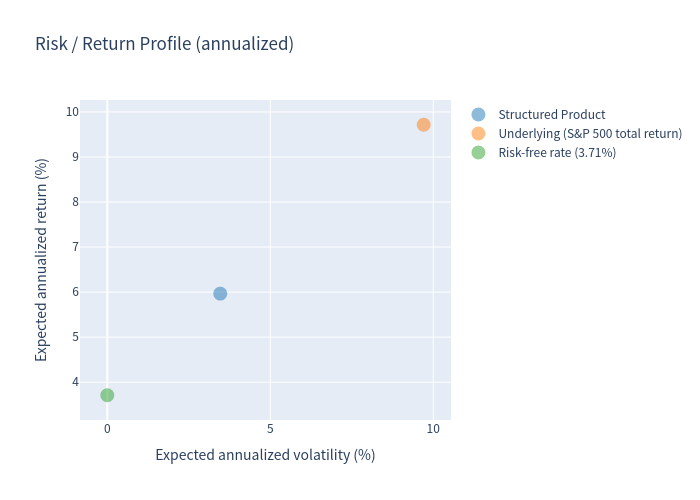
| Expected annualized return | 5.97% | 9.72% |
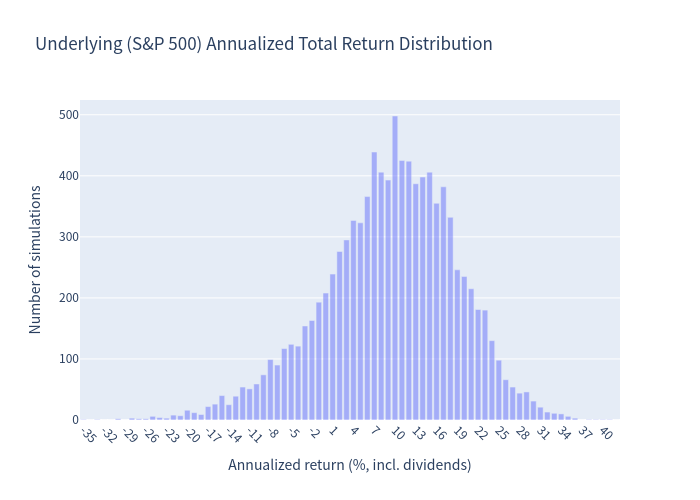
| Probability of negative return | 0.00% | 15.27% |
| 99% confidence VaR (1 year) | 0.00% | −15.81% |
| Expected annualized volatility | 3.47% | 9.71% |
| Expected total return over 3-year holding period | 19.37% | — |
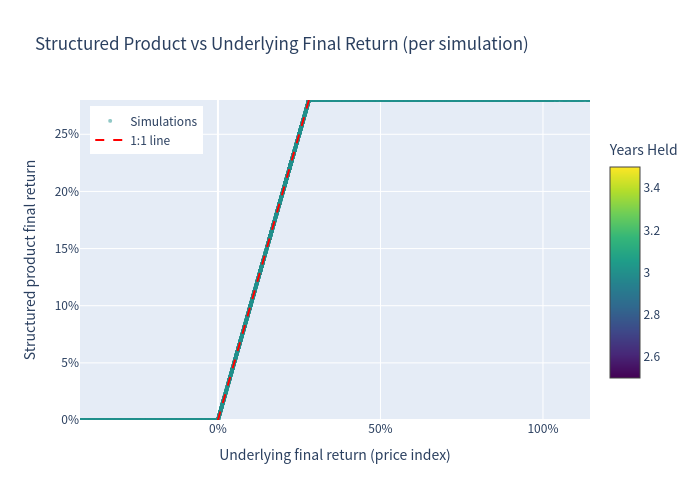
The product is principal-protected (FDIC-insured deposit amount) with upside participation capped at 128% of the deposit amount (≈ 8.58% annualized maximum). No simulation path produced a loss; the worst case is a flat 0.00% return if the underlier ends at or below its initial level.
Basic Product Information
How it works (layman's explanation)
- This is a 3-year market-linked certificate of deposit that pays no interest along the way. Instead, your return depends entirely on how the S&P 500 Futures Excess Return Index performs between the strike date (Aug 26, 2026) and the observation date (Aug 27, 2029).
- If the index rises over the term: you receive your $1,000 deposit plus 100% of the index gain, up to a maximum payment of $1,280 per CD (128% of the deposit amount, i.e., a maximum 28.0% gain over 3 years).
- If the index is flat or falls: you receive only your $1,000 deposit back — no loss of principal (subject to FDIC insurance limits and issuer creditworthiness for amounts above those limits).
- There are no coupons, no early-redemption/autocall features, and no barrier — the product is held to maturity (36 months).
Key terms at a glance
| Underlying | S&P 500® Futures Excess Return Index (single index) |
|---|---|
| Deposit amount / notional | $1,000 per CD (USD) |
| Participation rate | 100% |
| Maximum payment at maturity | $1,280–$1,320 per CD (128%–132% of deposit; analysis uses the 128% lower bound as an assumption) |
| Upside capped | Yes |
| Principal protection | Yes (FDIC-insured deposit amount) |
| Coupons / early redemption | None |
Key Statistics (10,000 simulated scenarios)
Structured Product
| Statistic | Value |
|---|---|
| Expected annualized return | 5.97% |
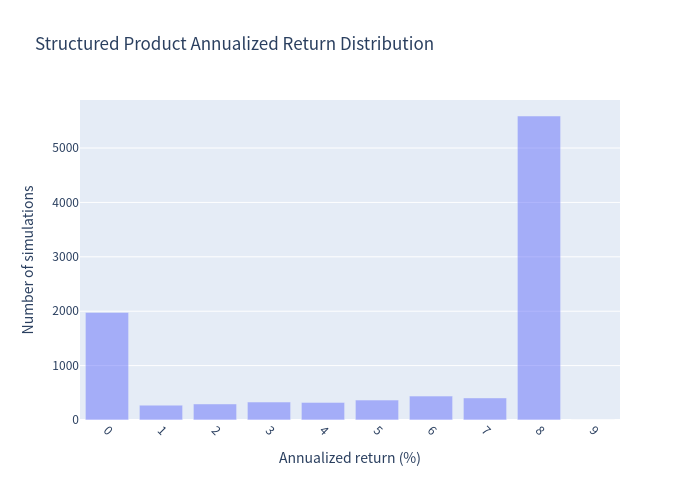
| Median annualized return | 8.58% |
| Expected annualized volatility | 3.47% |
| Probability of loss | 0.00% |
| 99% confidence VaR (1 year) | 0.00% |
| Expected total return over holding period | 19.37% |
| Expected holding period | 36.0 months |
| Probability of receiving upside (final > initial) | 82.64% |
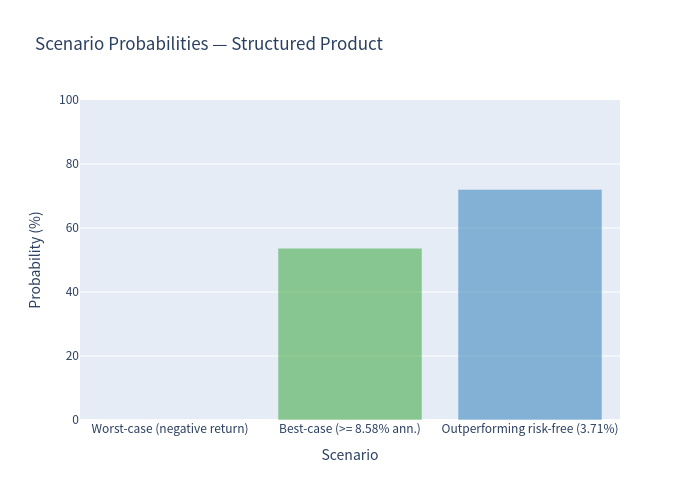
| Probability of hitting the 128% cap | 53.70% |
| Probability of par-only outcome (final ≤ initial) | 17.36% |
| Probability of outperforming the risk-free rate (3.71%) | 72.06% |
S&P 500 Benchmark (proxy, total return incl. estimated dividends)
| Statistic | Value |
|---|---|
| Expected annualized return | 9.72% |
| Expected annualized volatility | 9.71% |
| Probability of loss | 15.27% |
| 99% confidence VaR (1 year) | −15.81% |
Charts
Simulation Outcomes — Product vs Underlying Final Return
Each dot is one simulated scenario. The product return is floored at 0% (principal protection) and capped at 28% (128% cap). The 1:1 line shows where the product would sit if it fully passed through the underlier's return.
Annualized Return Distributions
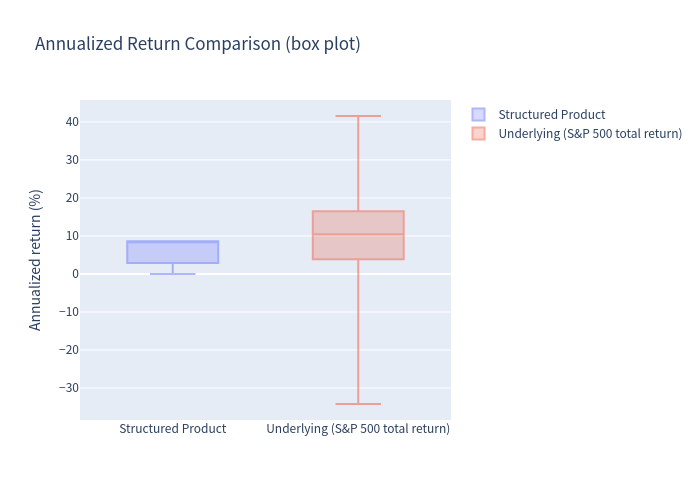
Distribution of simulated 3-year annualized returns for the underlying (left, total return) and the structured product (right). Note the product distribution is concentrated at 0.00% (par) and 8.58% (cap), with no negative outcomes.
Scenario Probabilities
Probability of par-only, upside (below cap), and capped outcomes across the simulated scenarios.
Risk / Return Profile
Expected annualized return vs volatility for the product, the underlying, and the risk-free rate.
Annualized Return Comparison (Box Plot)
Distribution comparison of simulated annualized returns for the underlying and the structured product.
Holding Period & Coupon Distribution
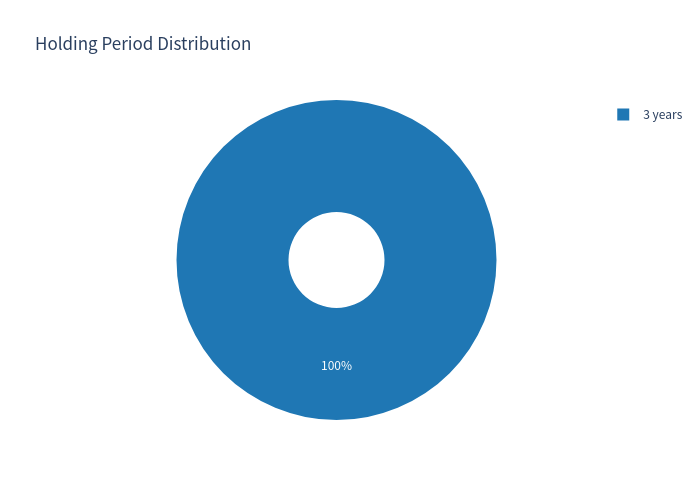
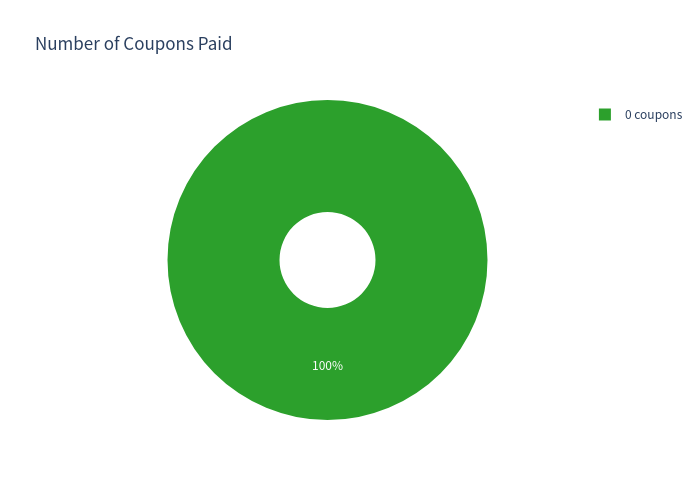
The product is always held to maturity (100% held 3 years) and pays no coupons (100% zero coupons).
Investment Commentary
Pros
- Full principal protection: the FDIC-insured deposit amount is returned at maturity regardless of underlier performance — no simulated scenario produced a negative return, and the 99% VaR is 0.00%.
- Meaningful upside capture: 100% participation up to a 28% total gain (8.58% annualized) over 3 years; over 50% of scenarios hit the maximum payment.
- High probability of a positive outcome: ~82.6% of scenarios receive some upside; ~72.1% outperform the risk-free rate.
- No downside participation: even a severe market decline leaves the investor with the full deposit amount.
Cons
- Capped upside: gains are limited to 128% of the deposit amount, so the expected annualized return (5.97%) is well below the underlying's expected return (9.72%) — the investor gives up upside in exchange for protection.
- No current income: the CD pays no interest, so the opportunity cost vs. a conventional CD or the risk-free rate is meaningful in flat/declining markets.
- Par-only risk: in 17.4% of scenarios the underlier finishes at or below its initial level and the investor earns 0.00% — a real-money loss versus inflation and versus a plain risk-free investment.
This analysis is for informational purposes only and does not constitute financial advice or a suitability assessment.