
Structured Product Evaluation
Headline Simulation Results
(mean of per-simulation CAGR)
(1-year, 1st percentile)
| Metric | Result |
|---|---|
| Expected annualized return (mean of per-simulation CAGR) | 6.05% |
| Probability of a negative return | 24.30% |
| 99% confidence VaR (1-year, 1st percentile) | −56.27% |
| Expected holding period | 9.91 months (≈ 0.83 yr) |
| Expected total return over the realised holding period | +2.70% (median +9.60%) |
| Probability of a “best case” outcome (max ~19.2% annualized, no loss) | 75.00% |
How It Works (plain language)
- Coupons are paid in any case: 19.20% p.a., i.e. CHF 48.00 per quarter (CHF 48.00 each on 18/02, 19/05, 18/08 and 17/11/2027 ≈ 4.80% per quarter), regardless of how the two shares move — for as long as the product is alive.
- Conditional capital protection: If neither stock ever trades at or below 49% of its starting level (a “Barrier Event”) at any time during the year, you get your CHF 1,000 back at maturity (plus the coupons due).
- The catch (worst-of downside): If either stock touches its 49% barrier and, at maturity, the worse-performing of the two finishes below its starting level (strike = 100%), you no longer get par — you effectively take the full downside of that worst stock (physical delivery, valued at its final performance level). If the worst stock has recovered back to ≥ 100% at maturity, you still get par.
- Issuer can call early: On two observation dates (≈ month 6 and month 9) the issuer may redeem the product at par plus the then-current coupon. Exercise is modelled as economically rational (called when both stocks are at/above their starting levels); coupons therefore accrue on a time-proportional basis.
In short: you are paid a rich coupon to sell downside protection on the weaker of Adecco and ams-OSRAM, with a wide (51%) cushion below current levels and no participation in any upside.
Key Statistics
Structured product vs benchmark (equal-weight basket of Adecco + ams-OSRAM, incl. dividends). Returns are annualized using each simulation's own holding period (standard practice for callable products).
| Metric | Structured Product | Underlying Basket (+div) |
|---|---|---|
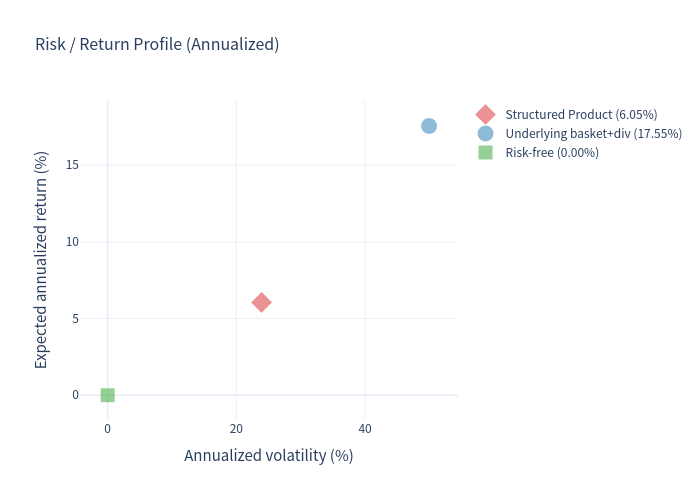
| Expected annualized return | 6.05% | 17.55% * |
| Expected annualized volatility | 23.92% | 49.95% |
| Probability of loss | 24.30% | 42.42% |
| 99% confidence VaR (1-year) | −56.27% | −57.00% |
* The benchmark's “mean annualized return” is inflated by annualizing short holding periods: in ~39% of paths the product is called early precisely because the shares rallied, and linear annualization of those short, high-return windows magnifies them. On a cleaner unconditional buy-and-hold 1-year basis the basket (+div) averages +8.17% with 42.44% volatility, a 49.01% probability of loss and −57.00% VaR. On that basis the product offers a similar-to-slightly-lower expected return but with roughly half the volatility, in exchange for capping all upside.
The product's own figures are not distorted: an early call simply locks in a time-proportional coupon (an ≈ 19.2% p.a. run-rate), so its ~6% expected CAGR reflects the large losses in the ~25% downside tails, not an annualization artifact.
Simulation Outcome Charts
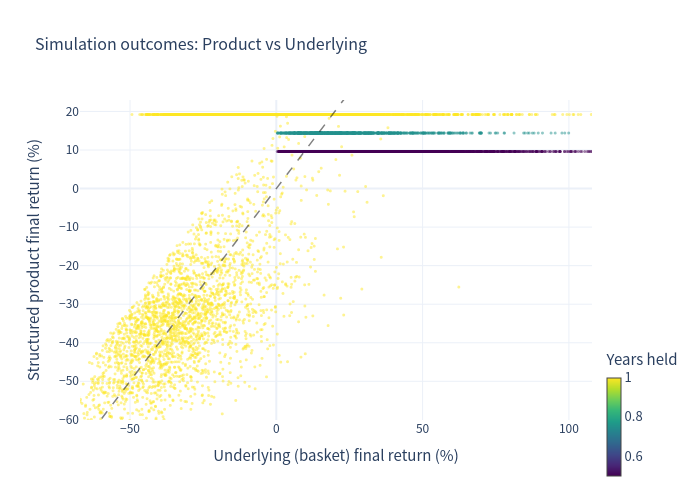
Final outcomes — product vs underlying
The product return is capped (flat top at +19.2%) and, when the underlying falls sharply, tracks the worst-of downside (points below the 1:1 line). The 1:1 line is shown for reference.
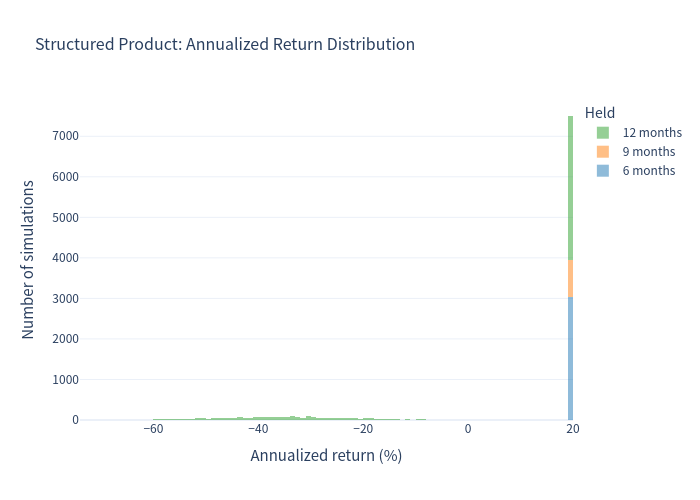
Annualized return distribution — structured product
Mass is concentrated at the +19.2% cap (no-loss outcomes) with a distinct negative tail (barrier-breach losses).
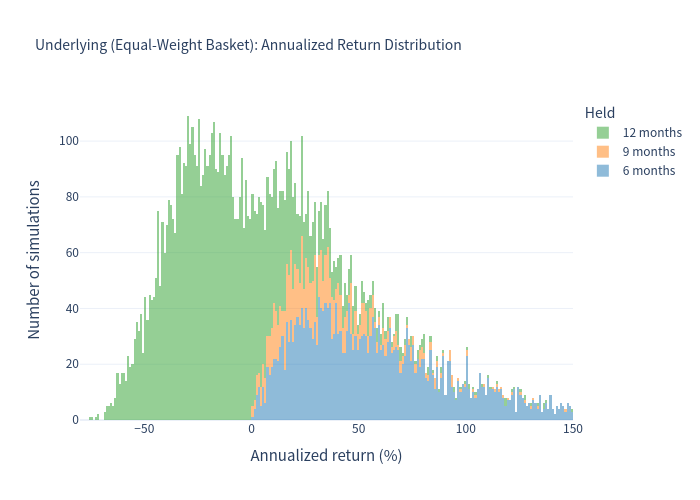
Annualized return distribution — underlying basket
A far wider, two-sided distribution (upside uncapped, high volatility).
Risk / return profile
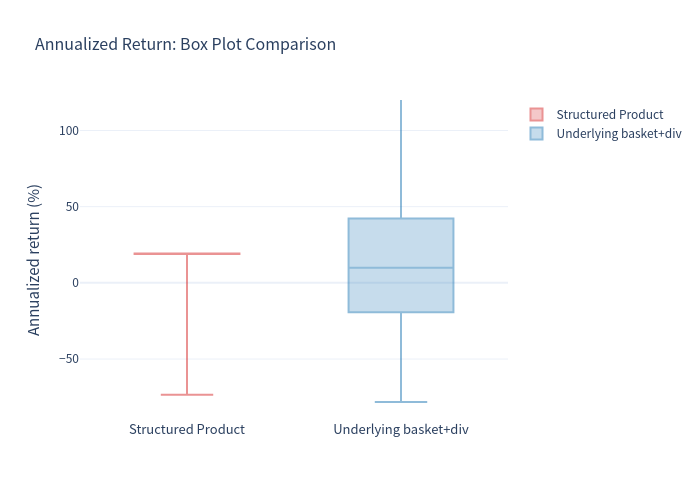
The product sits well below and to the left of the raw basket: materially lower volatility, lower expected return, and a similar deep-tail VaR.
Return comparison (box plot)
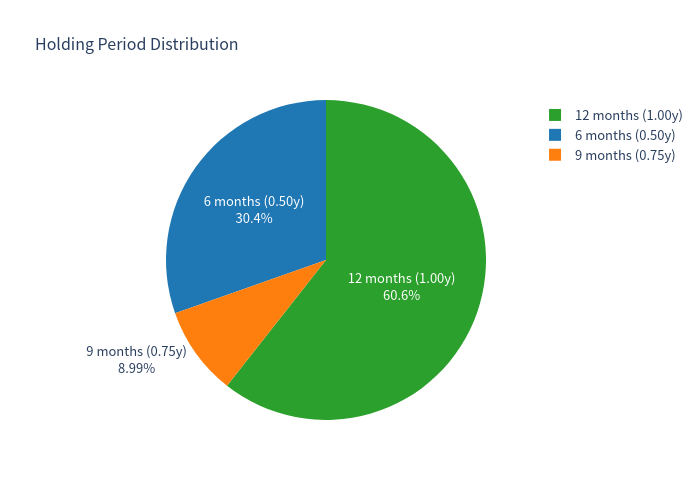
Holding-period distribution
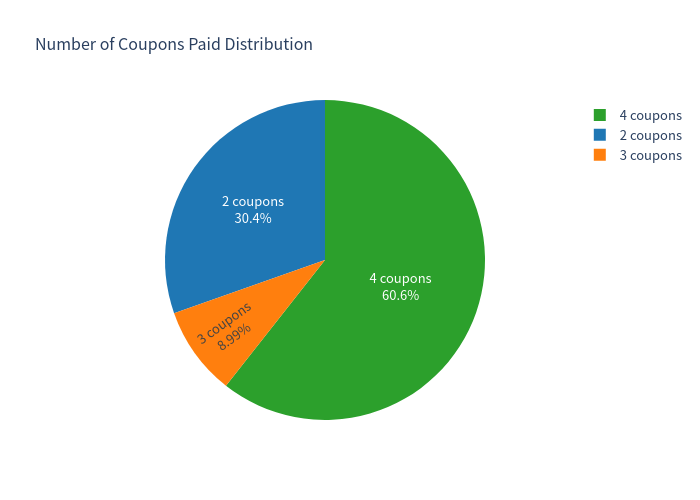
Because the product can be called early, holding periods vary (6, 9 or 12 months), and therefore so does the number of coupons paid (2, 3 or 4).
Coupon-count distribution
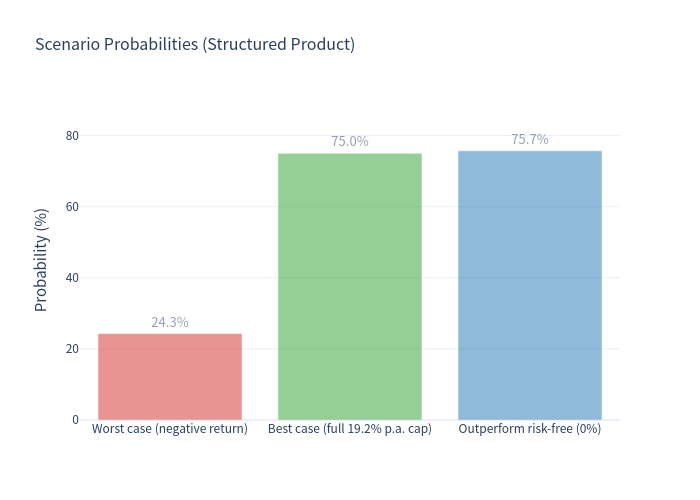
Scenario probabilities
| Scenario | Probability |
|---|---|
| Worst case — negative annualized return | 24.30% |
| Best case — maximum ~19.2% annualized (par returned, coupon paid, no loss) | 75.00% |
| Outperform risk-free (≈ 0%) | 75.70% |
Investment Commentary
Strengths
- Very attractive headline income: 19.20% p.a. paid quarterly in any case, substantially above CHF cash rates (≈ 0%).
- Wide 51% downside cushion: the 49% continuous barrier means a stock must fall more than half before capital is genuinely at risk — a meaningful buffer for ordinary volatility.
- Low realised volatility of the note (~24% vs ~42–50% for the raw basket); the income and barrier compress the return dispersion relative to owning the shares outright.
- Collateralised structure (TCM): mitigates issuer credit exposure.
- High probability of a good outcome: ~75% of simulated paths deliver par plus the running coupon with no capital loss.
- Short ~1-year horizon with clearly defined, observable trigger levels.
Drawbacks / Risks
- Worst-of exposure: a single blow-up in either Adecco or ams-OSRAM is enough to cause a loss, even if the other performs well.
- No upside participation: returns are strictly capped at the coupon; strong rallies in the shares are given away.
- Cliff-edge downside: once the barrier is breached and the worst stock finishes below its start, losses are near-linear in that stock (worst observed ≈ −73%). Capital is genuinely at risk.
- Concentrated, volatile underlyings: ams-OSRAM has historically been extremely volatile (recent realised vol well above 60–80%); barrier-touch risk is not trivial.
- Issuer callable: early redemption truncates the term and limits how many coupons are collected (coupons accrue proportionally).
- Single-name concentration and physical delivery of the worst-performing share upon a breach.
This analysis is a quantitative evaluation of the term-sheet economics and does not constitute investment advice, a recommendation, or a suitability assessment.