
Morgan Stanley Worst-of NDXT, RTY & SPX Callable Jump Notes due October 3, 2031
Headline simulation results
| Metric | Structured product | Benchmark (equal-weight NDXT/RTY/SPX basket, total return) |
|---|---|---|
| Expected annualized return | 8.21% | 15.11% |
| Probability of a negative return | 0.00% | 16.52% |
| 99% confidence VaR (1-year) | 0.00% | −14.03% |
| Expected annualized volatility | 6.13% | 14.63% |
| Median annualized return | 11.24% | 14.98% |
| Expected holding period | 38.6 months (≈3.2 yrs) | — |
- Principal protection works: the note never loses money in any of 10,000 simulations (the issuer's principal is returned in full even if the worst-of index falls as much as −100%). This is why both the probability of loss and the 1-year 99% VaR are 0.00%.
- Expected total return over the realized holding period is 18.13% (median 14.00%), earned over an average holding period of about 3.2 years.
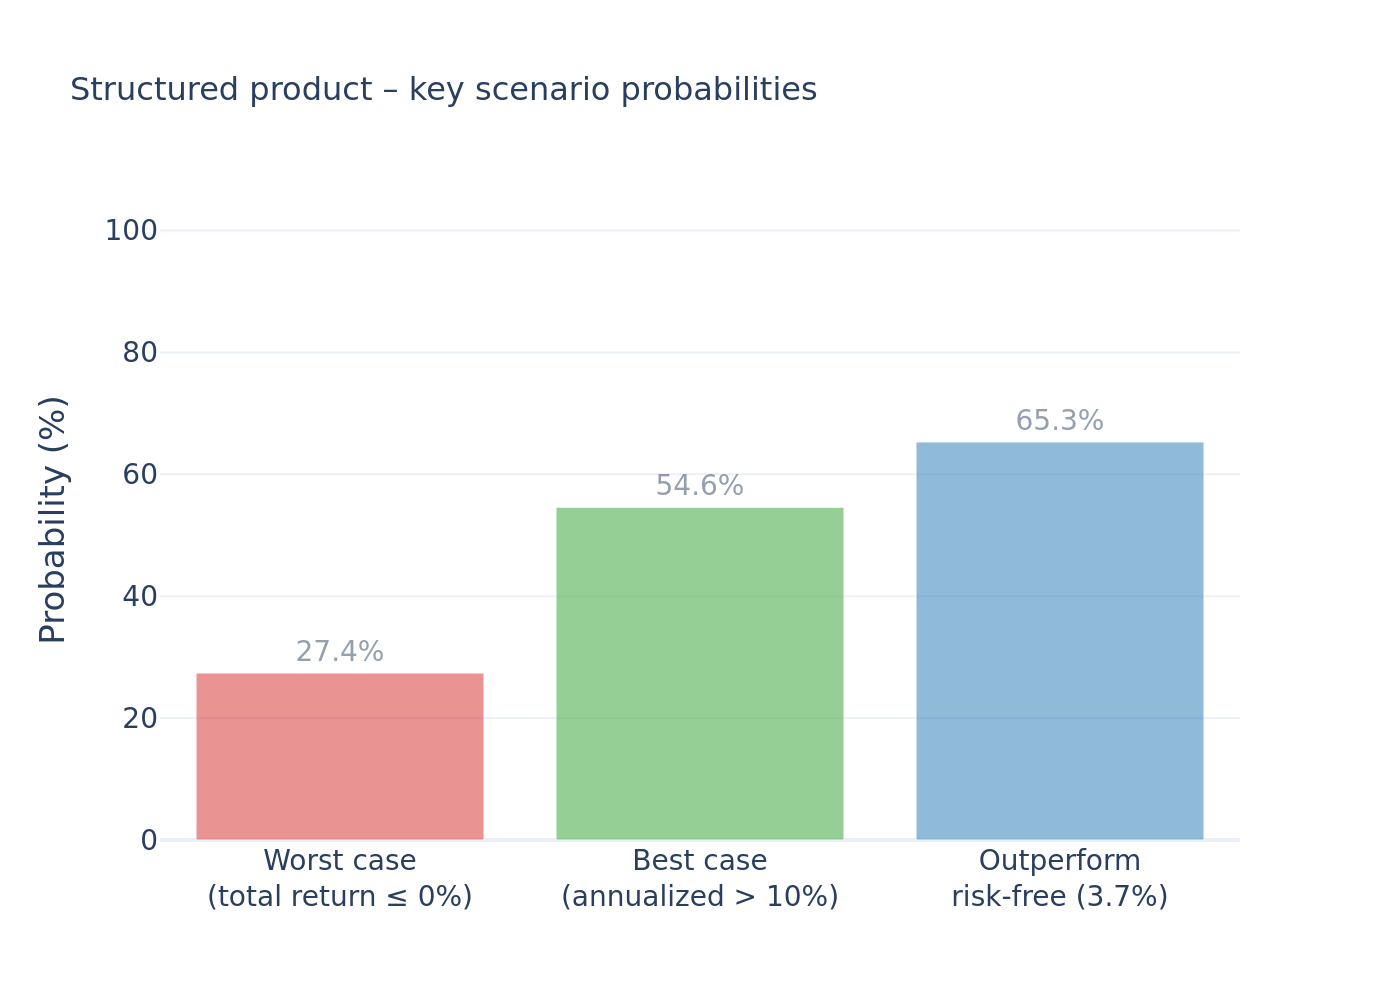
- The note beats cash 65.31% of the time and delivers a >10% annualized return 54.6% of the time; it returns 0% (flat) in the remaining ~27% of paths.
What the product is (in plain terms)
This is a 5-year, principal-protected note linked to the worst-performing of three indices: the Nasdaq-100 Technology Sector Index (NDXT), the Russell 2000 Index (RTY) and the S&P 500 Index (SPX).
- Upside (if held to maturity): the note pays back principal plus 125% of the rise in the worst of the three indices. Participation is not capped — if the worst-of climbs 60%, the note pays 175% of principal.
- Downside: there is none at maturity — principal is returned regardless of index performance.
- Issuer call ("Jump"): beginning after roughly 12 months, the issuer may (on any monthly date) redeem the note early at a step-up amount that accrues at 14% per year. Redemption is made only when the issuer's own risk-neutral model says redeeming is economically rational — i.e., when the equity upside it would otherwise owe exceeds this 14% accrual. When triggered, the note is cashed out at the accrued 14% return and ceases to exist.
- The trade-off: the issuer's rational call caps the investor at roughly a 14% annualized return whenever the worst-of index rallies strongly and early; through the maturity path the investor instead keeps the (uncapped, but floored-at-zero) 125% participation.
Because the payoff is only ever exposed to positive index performance, the note behaves like a "principal-protected worst-of call option" with an issuer cap attached.
How the simulations behaved
- Issuer call frequency: the note is redeemed early in 52.05% of paths — and when it is called it almost always happens at the first possible date (month 12). Otherwise the note runs to the 5-year maturity.
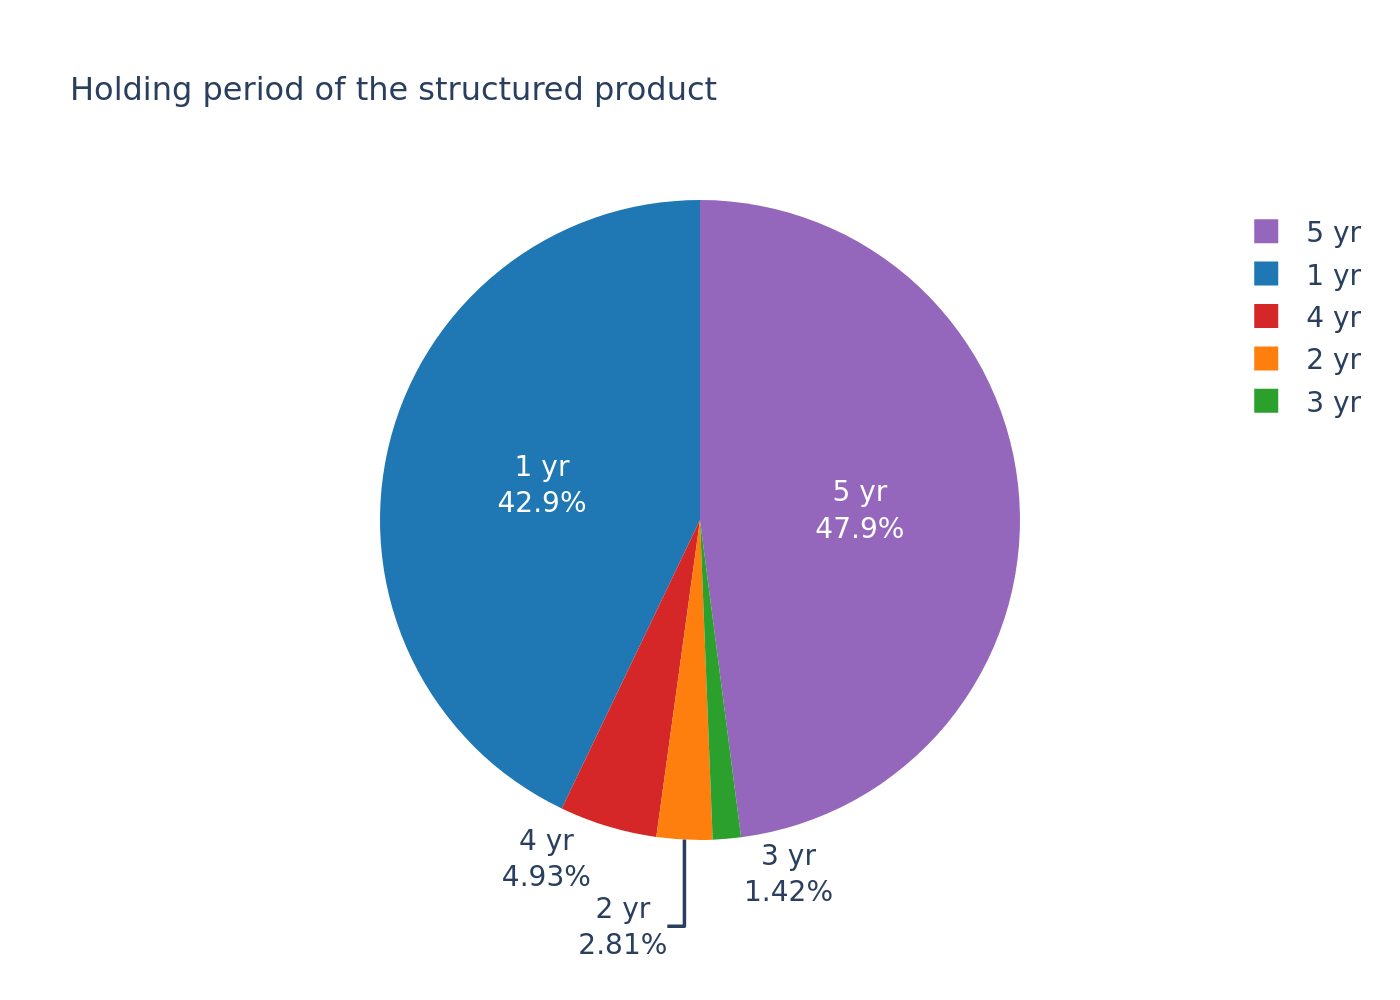
- Holding-period distribution (years held): 1 yr ≈ 42.9% · 2 yr ≈ 2.8% · 3 yr ≈ 1.4% · 4 yr ≈ 4.9% · 5 yr ≈ 48.0%. Outcome is effectively bimodal — either "called quickly" or "held to maturity".
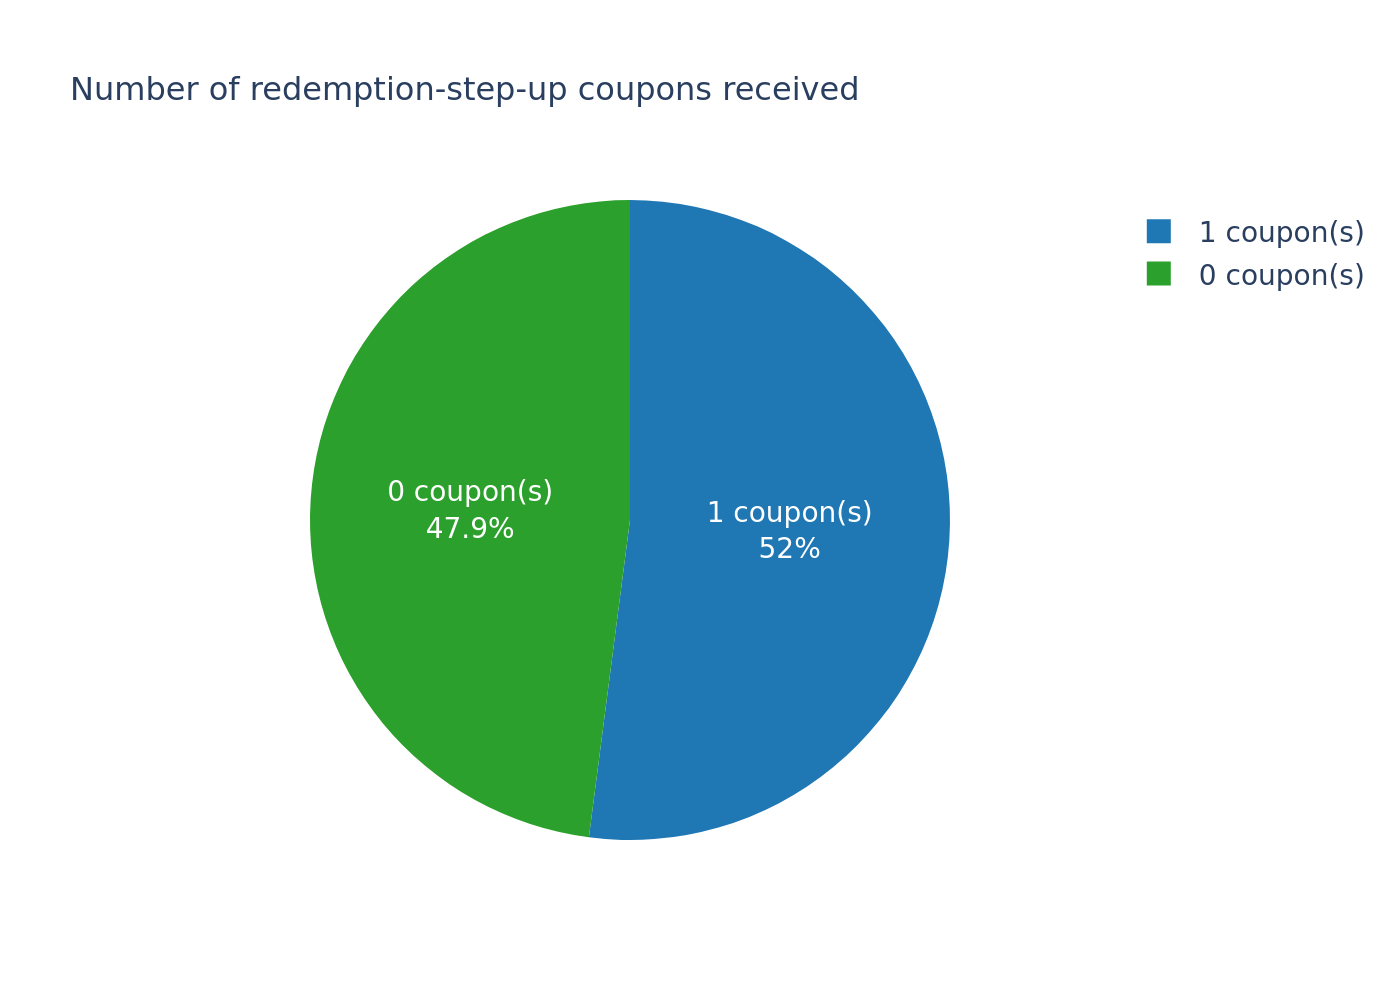
- Coupons: 52.0% of paths receive the single 14%-accrual step-up redemption payment; 48.0% receive no step-up coupon and instead settle on the maturity participation amount.
Key statistics
| (annualized, per simulation) | Structured product | Benchmark basket (total return) | Worst-of underlying (price only) |
|---|---|---|---|
| Expected return | 8.21% | 15.11% | 8.76% |
| Expected volatility | 6.13% | 14.63% | 13.03% |
| Probability of loss | 0.00% | 16.52% | 27.40% |
| 99% VaR (1 year) | 0.00% | −14.03% | −20.34% |
Charts
Simulation outcomes — product vs worst-of underlying
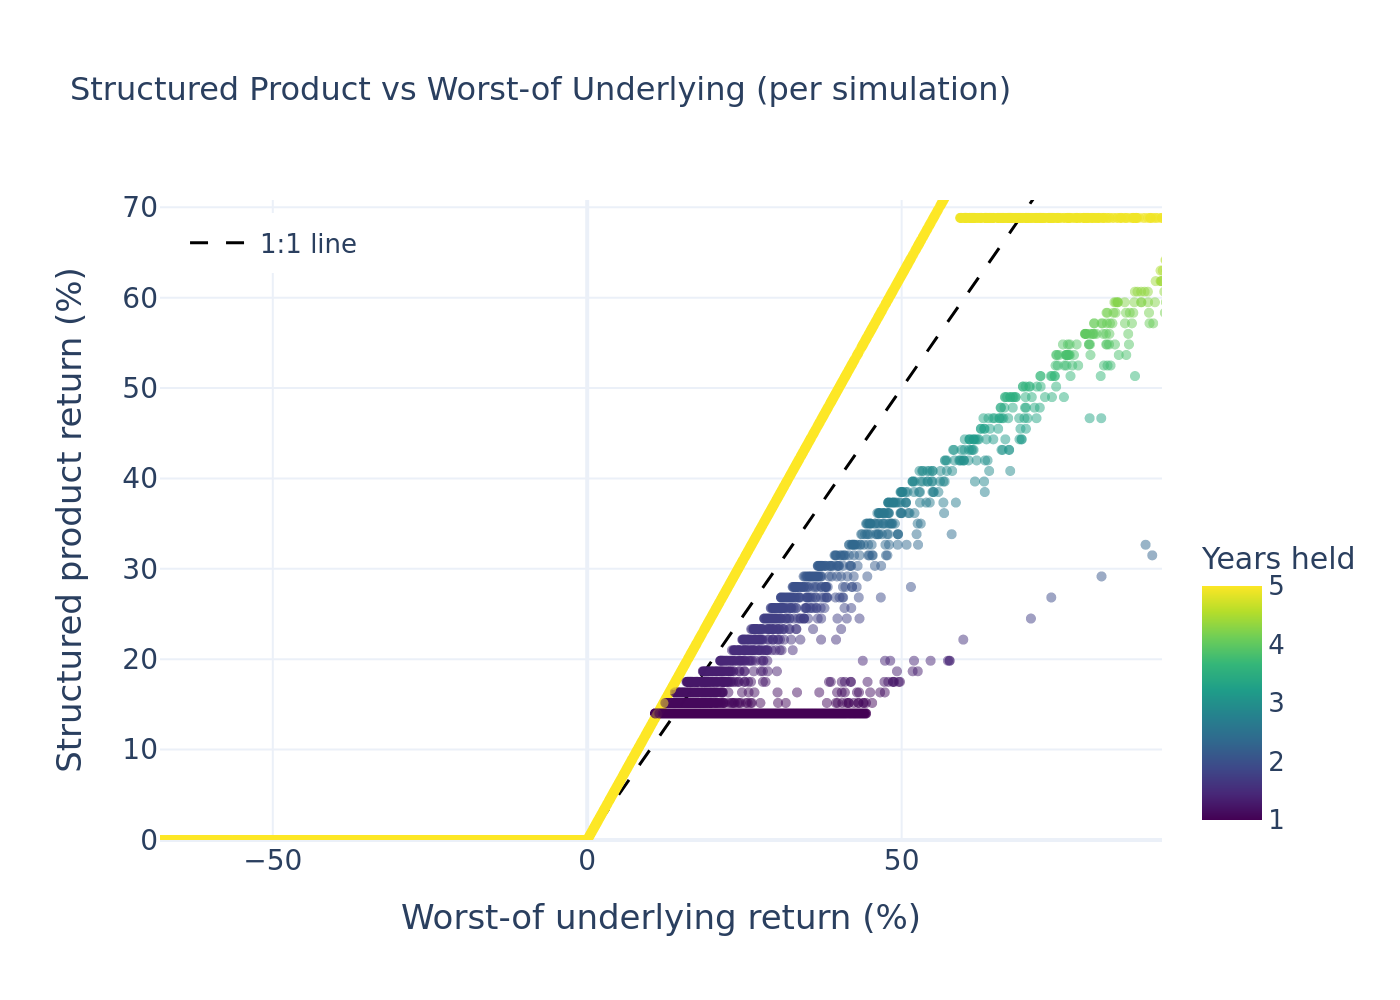
Each point is one simulation; the dashed line is 1:1. The product return is floored at 0% (principal protection). Uncalled paths that run to maturity plot above the 1:1 line because of the 125% participation; paths that the issuer calls are capped at the ~14% accrual and plot below the 1:1 line. The result is a clearly bimodal cloud.
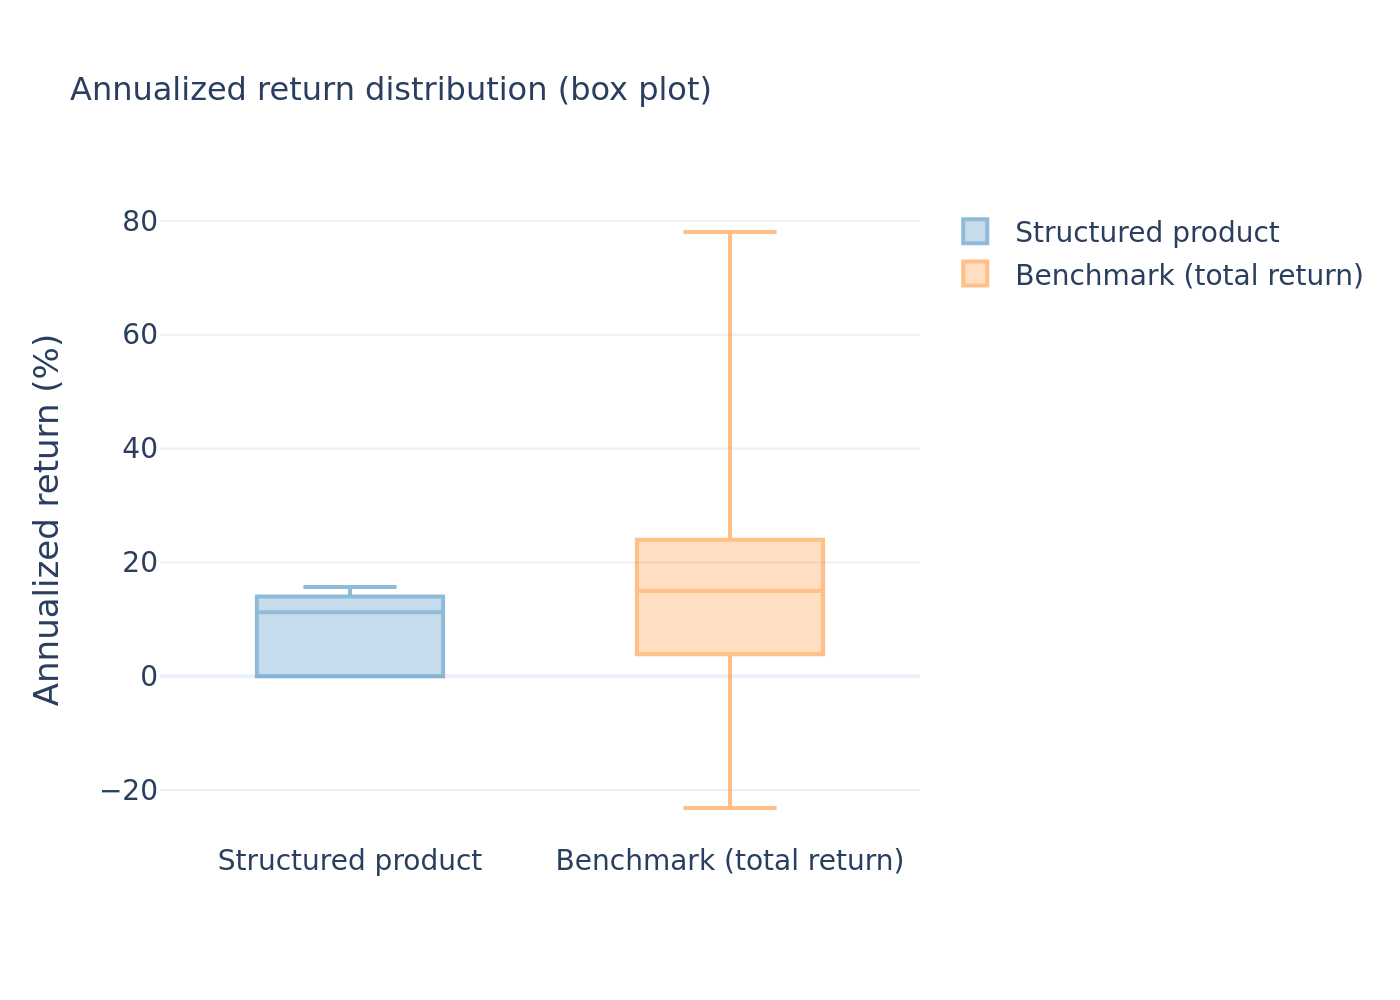
Annualized return distributions
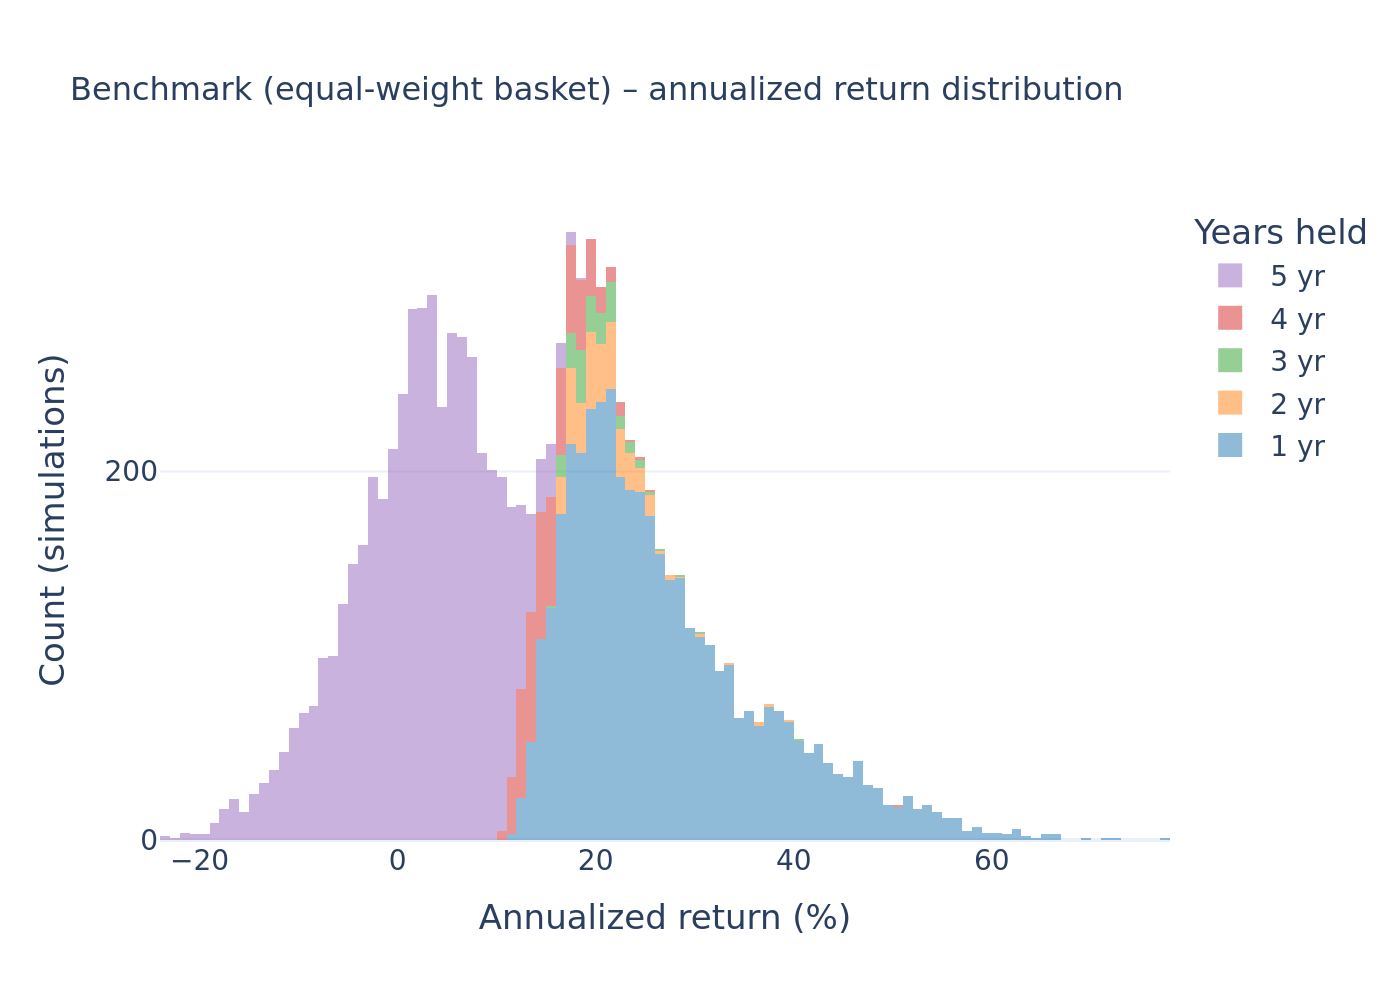
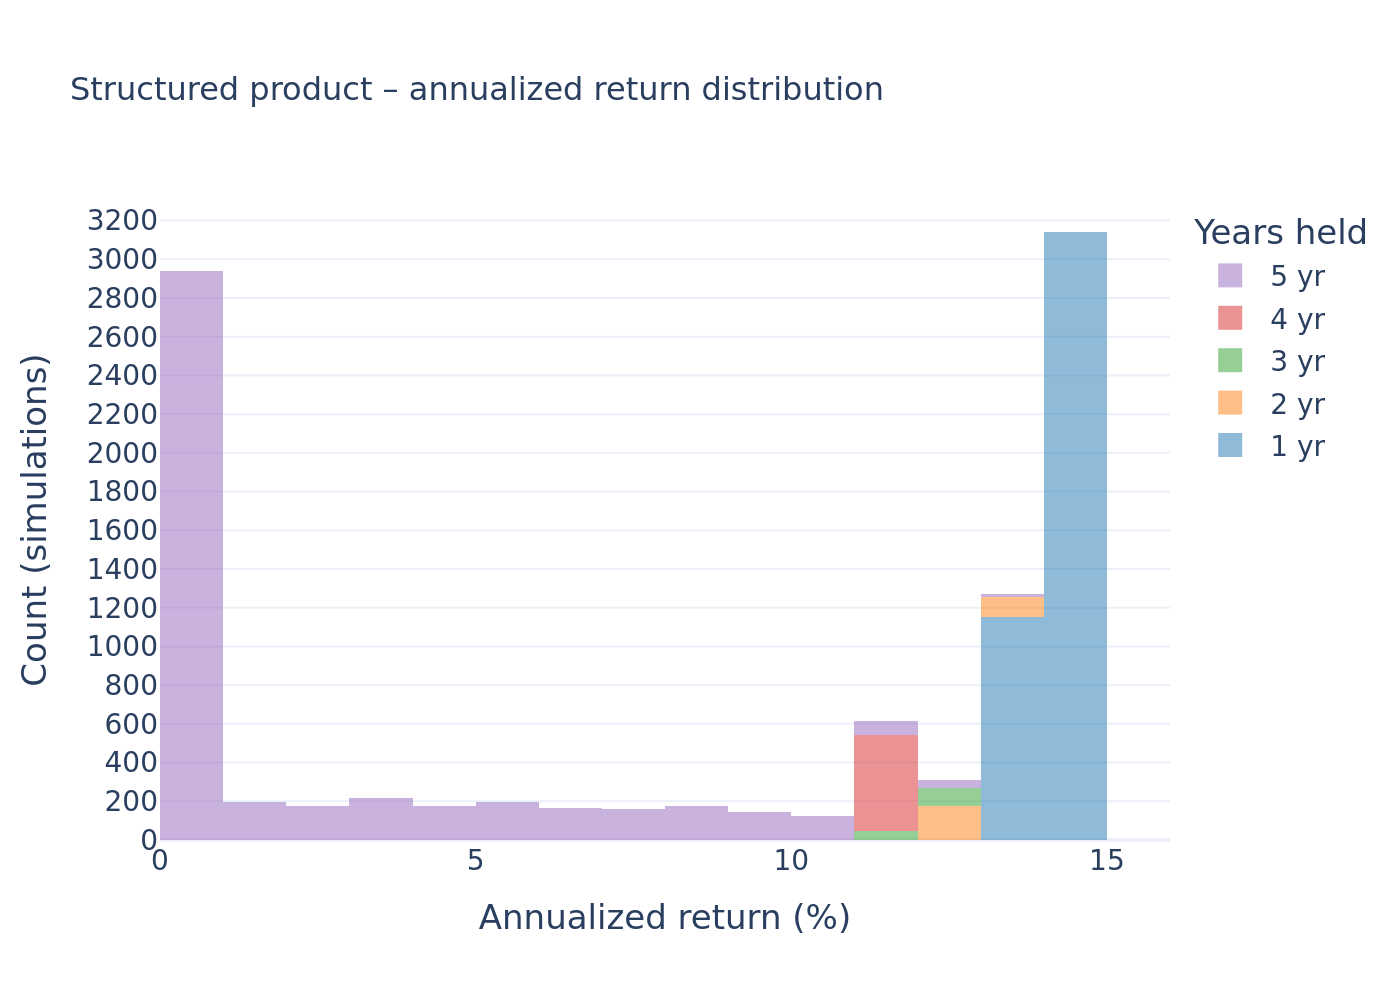
The basket has a wide, roughly symmetric distribution reaching far into negative territory. The structured product is truncated at 0% and is bimodal: a large mass at 0% (paths that mature flat) plus a cluster around 10–14% (called paths, the ~14% accrual cap) and a right tail from the uncapped maturity participation.
Key scenario probabilities
Risk / return
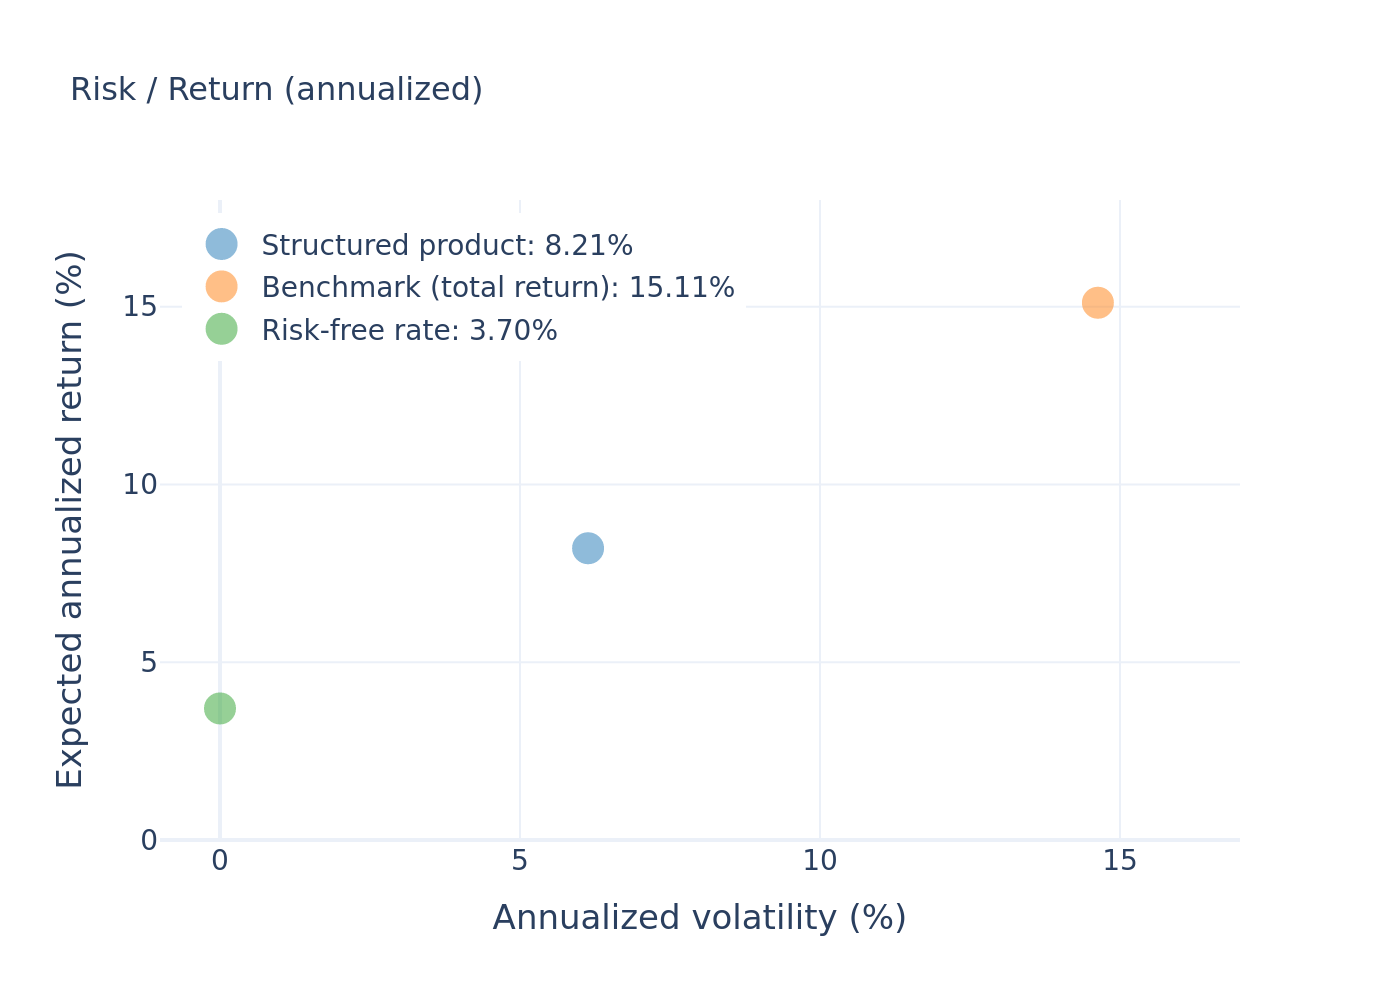
The product sits markedly to the left of the benchmark: lower expected return, but roughly two-fifths (≈42%) of the volatility and a hard floor at 0%.
Return dispersion
Holding period and coupon outcomes
Investment commentary
Strengths
- Full principal protection — the note cannot lose money at maturity, delivering a 0% floor that is rare in equity-linked structures.
- Uncapped upside if held — the 125% participation in the worst-of is not capped, so a broad multi-year rally in all three indices can produce returns well above the 14% call accrual (99th-percentile total return is far into double digits).
- Low realized volatility (≈6.13%) and a positive expected return (~8.21% annualized) that historically clears cash in about two-thirds of paths.
- Favourable asymmetry vs. the worst-of directly: the note smooths the downside of the single weakest index (worst-of price return has 27% loss frequency and −20% VaR; the note has neither).
Considerations
- The issuer's call caps the investor. Because redemption is triggered only when it benefits the issuer, strong early rallies are monetised at the 14% accrual rather than the full index gain — the product gave up ~6–7 percentage points of annualized return versus the equal-weight basket over the same horizons.
- The ~4% issuance/structuring cost (issuance price $1,000 vs. an estimated value near $959 at inception) is an immediate drag that must be overcome before the note breaks even economically.
- No coupons while waiting. If the note is never called, the investor earns nothing until maturity — 0% is returned in ~27% of paths.
- Issuer credit exposure. All payments depend on Morgan Stanley's ability to pay.
This document is a quantitative simulation study for information purposes only and is not investment advice, a recommendation, or a suitability assessment.