
SPXFP Callable Jump Notes due September 30, 2031 — Simulation Analysis
Morgan Stanley Finance LLC (guaranteed by Morgan Stanley) | CUSIP 61781DU48 | Pricing date Sep 25, 2026 | Maturity Sep 30, 2031 (5 years)
| Metric | Value |
|---|---|
| Expected annualized return | 9.97% |
| Probability of a negative return | 0.00% (principal is protected) |
| 99% confidence VaR (1 year) | 0.00% (worst simulated outcome is par) |
| Expected total return over the realized holding period | 38.12% |
| Expected holding period | ~3.80 years (45.6 months) |
| Probability of early redemption (issuer call) | 52.32% |
| Probability of being held to maturity | 47.68% |
Numbers shown are simulated scenario statistics under the analysis' economic assumptions and are not a guarantee of future results.
| Item | Detail |
|---|---|
| Product type | Principal-protected, issuer-callable "Jump" participation note |
| Underlier | S&P 500 Futures Excess Return Index (SPXFP) — a single index |
| Currency / Notional | USD; $1,000 per note |
| Coupon | None (the notes do not pay interest) |
| Upside at maturity | 140% participation on any positive SPXFP return (uncapped) |
| Downside | Principal protected — minimum payment at maturity = $1,000 (par) |
| Issuer call | Monthly from Sep 30, 2027 to Aug 28, 2031 at fixed redemption prices of $1,155 to $1,762 per note |
| Key dates | Pricing Sep 25, 2026; final observation Sep 25, 2031; maturity Sep 30, 2031 |
How it works (layman's explanation)
- The note does not pay periodic coupons. Instead, it offers two ways to earn:
- If the issuer calls the note early (its option, exercised when economically rational), the investor receives a fixed, pre-set redemption price that accrues at roughly 15.5% per year — e.g., $1,155 after one year, $1,310 after two years, rising monthly to $1,762 by August 2031.
- If the note runs to maturity, the investor receives $1,000 plus 140% of any rise in the SPXFP index since pricing — with no cap on the upside. If the index is flat or down at maturity, the investor still receives the full $1,000.
The catch is that a strong rally can prompt the issuer to redeem early, converting the investor's open-ended upside into the (still generous) fixed redemption payment. The downside is fully cushioned: in every simulated scenario the note ends at or above par.
The comparison benchmark is the broad S&P 500 equity market (price performance plus dividends, matching the same holding period as the note in each scenario).
| Metric (annualized) | Structured Product | S&P 500 Benchmark |
|---|---|---|
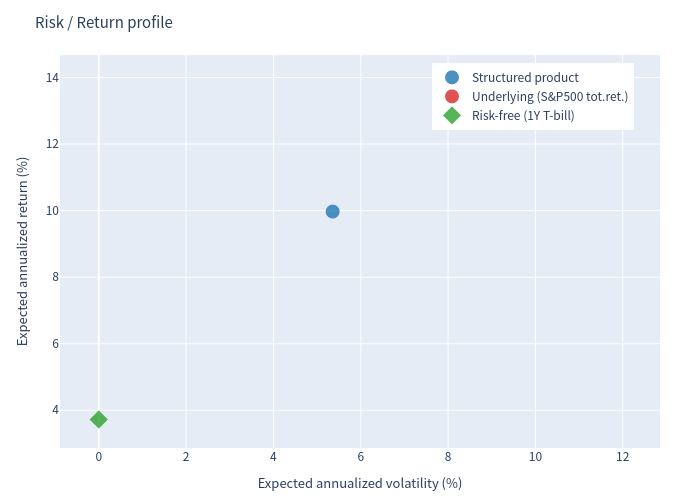
| Expected annualized return | 9.97% | 13.82% |
| Expected annualized volatility | 5.36% | 11.97% |
| Probability of loss | 0.00% | 10.27% |
| 99% confidence VaR (1 year) | 0.00% | −9.77% |
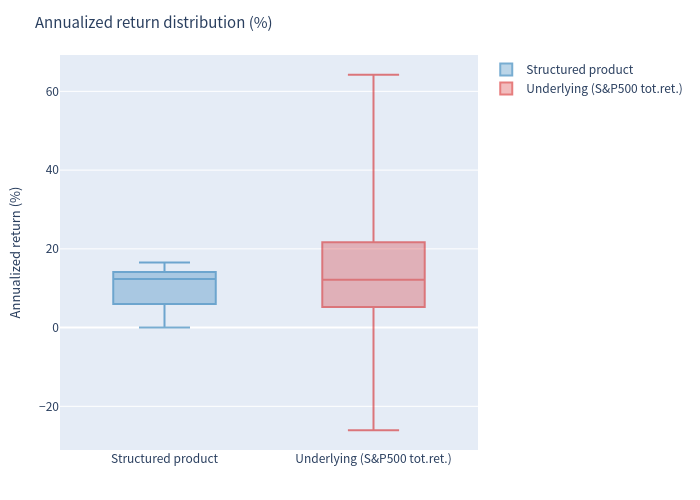
Reading the table: the note gives up roughly 3.85% of expected annualized return relative to direct equity exposure, in exchange for removing all downside — the S&P 500 loses money in about 1-in-10 simulated 5-year horizons (worst ~ −26% annualized), while the note never finishes below par.
Return distribution characteristics
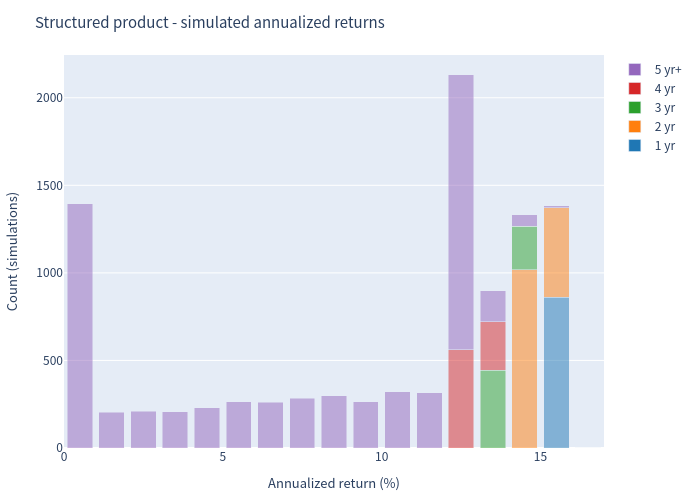
- Structured product total returns (over its actual holding period) span 0.00% to 114.83%, median 36.03%; annualized returns span 0.00% to 16.52%, median 12.37%.
- Early-redemption scenarios (52.32%) paid on average 141.9 index points (+41.9%) after an average 2.7 years.
- Maturity scenarios (47.68%) returned on average 134.0 index points (par + 140% of average positive index performance).
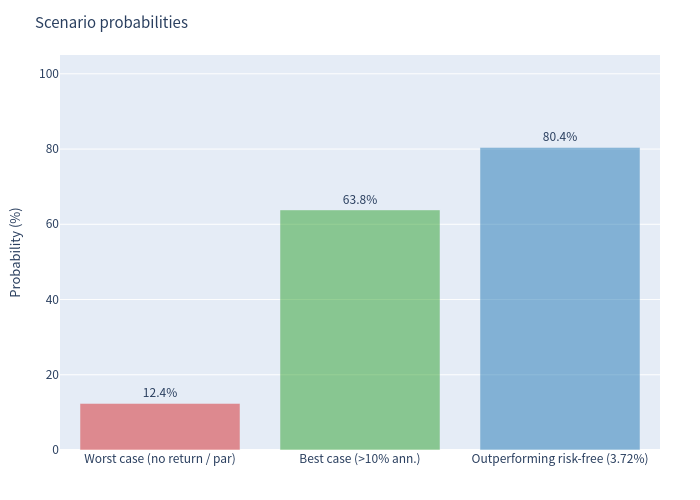
- About 12.38% of scenarios finish at exactly par (0% total return) — the "worst case" is forgone upside, not a capital loss.
- Probability of exceeding a 10% annualized return: 63.82%; probability of beating the risk-free rate (3.72%): 80.43%.
Note on holding periods: because the issuer can redeem the note anywhere between year 1 and year 5, annualized figures and total returns should be read together. A scenario redeemed after 12 months at $1,155 shows a ~15.5% annualized return on a 15.5% total return, while a scenario held 5 years at par shows 0% on both. The median scenario is held ~4.8 years.
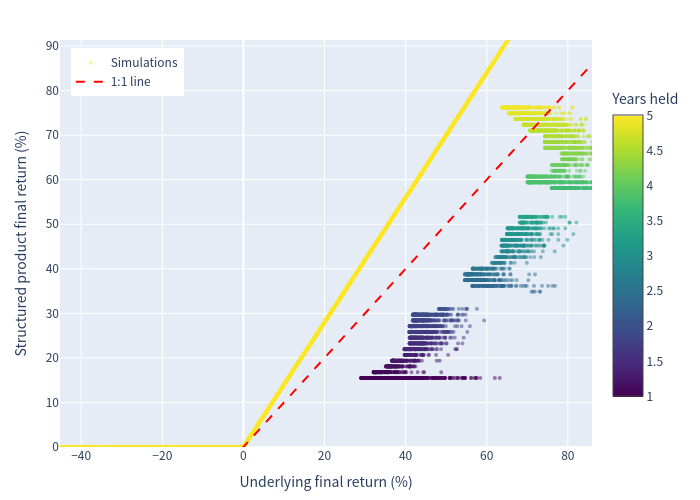
3.1 Simulation outcomes — note return vs. underlying return (colored by years held)
Each dot is one simulated scenario. Dots on the horizontal floor at 0% illustrate the principal protection; dots along the diagonal show scenarios where the note earned roughly the same as the market; dots above the line in early years reflect the fixed redemption "jump" payments.
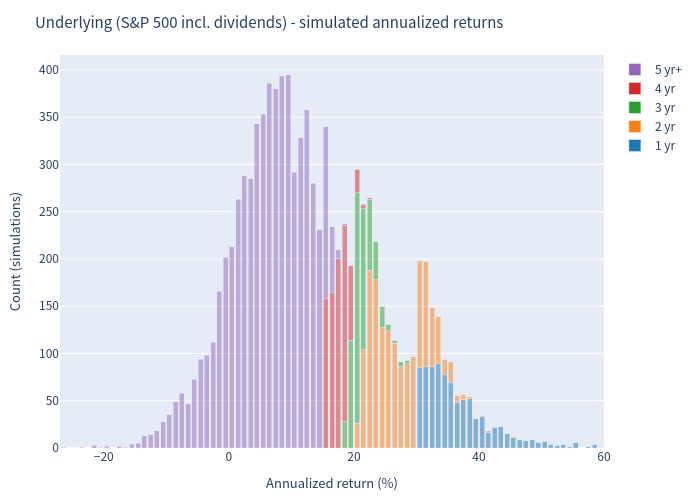
3.2 Annualized return histograms
The note's returns are clustered tightly between 0% and ~16% (no negative tail), whereas the underlying market return distribution is wide and includes negative outcomes.
3.3 Scenario probabilities
3.4 Risk / return profile
The note delivers a materially lower volatility and a zero downside tail relative to the equity benchmark, at the cost of lower expected return.
3.5 Distribution comparison (box plot)
3.6 Holding-period distribution
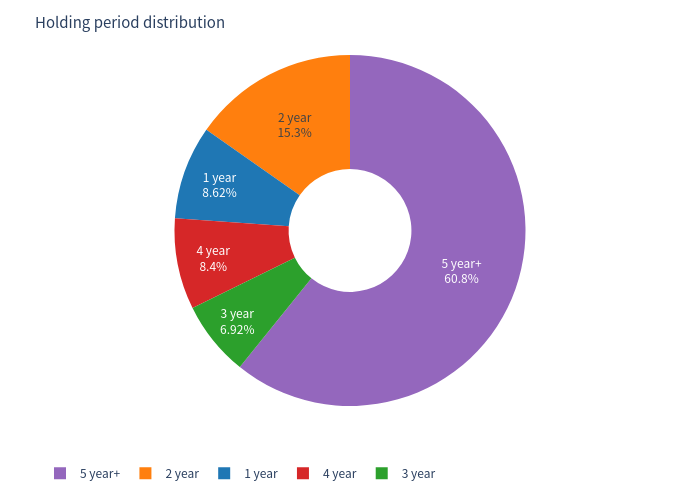
The note is redeemed early in about 52% of scenarios (most frequently in the 2nd and 5th years), with roughly 48% held to the September 2031 maturity.
Good points
- Full downside protection at maturity — simulated probability of any capital loss is 0%; the note always redeems at or above par.
- Uncapped 140% upside participation if held to maturity in rising markets.
- Generous fixed redemption schedule (~15.5% p.a. simple accrual) when the issuer exercises its call — historically this occurs in strong up-markets, converting volatility into a fixed gain.
- Low volatility of outcomes (≈5.4% annualized) relative to the equity market (≈12.0%), giving a favourable risk-adjusted profile.
- No coupons to reinvest — the return is delivered as a single redemption payment, with the early-redemption "jump" compensating for the absence of income.
Product characteristics to be aware of (not advice)
- No periodic interest; if the index is flat or down at maturity and the note is not called, the payoff is par — i.e., a 0% return over up to five years (~12% of simulated scenarios).
- The issuer's call feature can truncate open-ended upside in strong rallies; the investor receives the fixed redemption price instead.
- The underlier is a futures excess-return index (S&P 500 futures performance above cash); it does not include ordinary dividends or a cash return, so it can lag a spot S&P 500 total-return investment.
- Returns are subject to the credit risk of Morgan Stanley Finance LLC / Morgan Stanley.
This analysis is a quantitative evaluation of the term-sheet mechanics only. It is not investment advice and does not address suitability.