
12.60% p.a. Multi Barrier Reverse Convertible (Callable)
Headline Simulation Results
10,000 Monte-Carlo scenarios over the 18-month maximum term (worst-of barrier structure, 55% continuous barrier, issuer-callable).
| Headline Metric | Result |
|---|---|
| Expected annualized return | 7.93% |
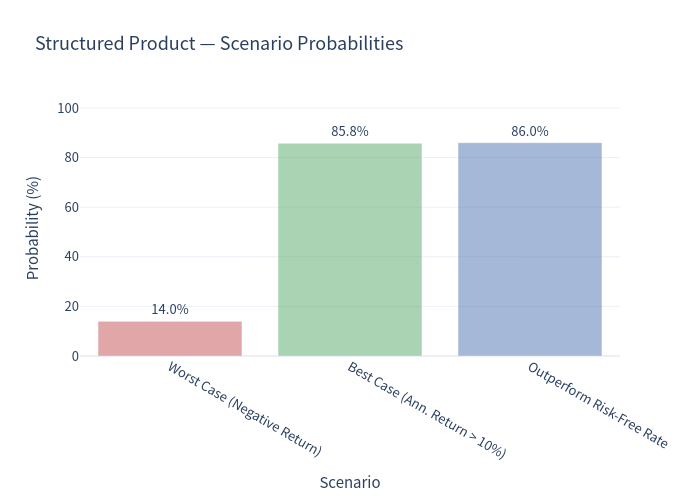
| Probability of a negative return | 13.98% |
| 99% confidence VaR (1-year) | -30.81% |
| Expected holding period | 13.82 months |
| Expected total return over the holding period | 7.99% |
| Median total return | 12.60% |
Product at a Glance
- Type: Yield-enhancement Multi Barrier Reverse Convertible (SSPA 1230), issuer-callable, worst-of.
- Underlyings: ABB Ltd (ABBN.SW), Adecco Group (ADEN.SW), Barry Callebaut (BARN.SW) — all SIX-listed, CHF.
- Coupon: 12.60% p.a., paid quarterly (3.15 coupon points per quarter).
- Barrier: 55% of the initial fixing level, continuously observed for the whole life.
- Strike: 100% of the initial level. Upside is capped at par.
- Callable: the issuer may redeem quarterly from month 6; Maturity 18 months (Final Fixing 07/04/2028).
How It Works (in plain English)
The investor lends CHF 5,000 of par to the issuer and, in exchange, receives an above-market 12.60% annual coupon, paid unconditionally at each quarterly date. To pay for that high coupon the investor sells the issuer downside protection on the worst-performing of the three Swiss shares:
- If the barrier is never breached, the investor simply gets par (100) back at maturity plus all coupons — a full 12.60% p.a.
- If any of the three shares trades at or below 55% of its start level at any time, protection is lost. At maturity the investor then receives the worst share (or its cash value): par is returned only if that worst share has recovered to at least its starting level, otherwise the investor absorbs its fall from 100.
- The issuer can call the product early (quarterly from month 6) and pay par plus the running coupon. It is assumed the issuer exercises this once the worst share is back at or above its starting level, which caps the investor's participation in further upside.
Because both the barrier and the maturity redemption are driven by the worst of ABB, Adecco and Barry Callebaut, the structure is more fragile than any single share on its own — even though the coupon itself is fixed.
Key Risk / Return Statistics
| Metric (annualized) | Structured Product | Underlying (Equal-Weight Basket, Total Return) |
|---|---|---|
| Expected annualized return | 7.93% | 14.07% |
| Expected annualized volatility | 11.41% | 21.80% |
| Probability of loss | 13.98% | 33.38% |
| 99% confidence VaR (1-year) | -30.81% | -25.57% |
(Benchmark = equal-weight basket of the three shares; a ~2.72% dividend yield is added for the total-return comparison.)
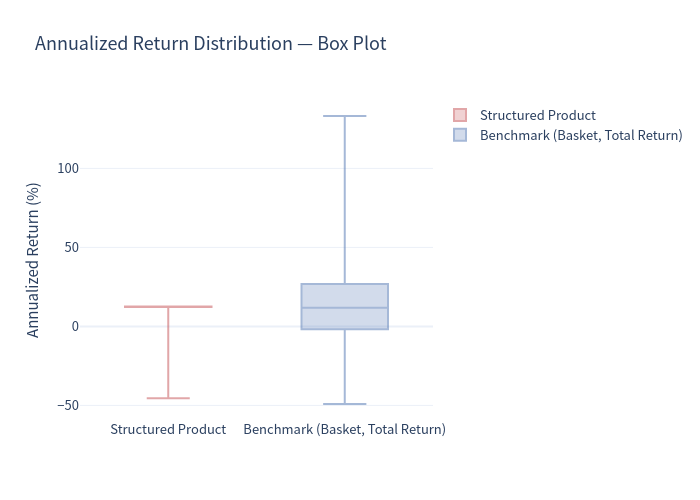
Reading these numbers: the product delivers a much steadier ride than owning the basket — roughly half the volatility (11.4% vs 21.8%) and a loss probability under 15% vs. over 33%. In exchange, upside is capped (max ~12.6% p.a.) and, because the payoff is tied to the worst share, the deepest tail loss (-30.8% annualized at the 1st percentile) is worse than the basket's (-25.6%). On an annualized basis the product's expected return (7.93%) is clearly below the basket's (14.07%); however, on an un-annualized basis the two are much closer — the product's expected total return (7.99%) is actually slightly above the basket's expected total return over the same variable horizons (6.21%), because the fixed coupon cushions the many flat-to-down scenarios. The large gap in the annualized figures is driven largely by the fact that the product is often called early in strong rallies — precisely the paths in which the basket's annualized return is mechanically exaggerated (see note below).
Early-redemption / barrier behaviour
| Outcome | Probability |
|---|---|
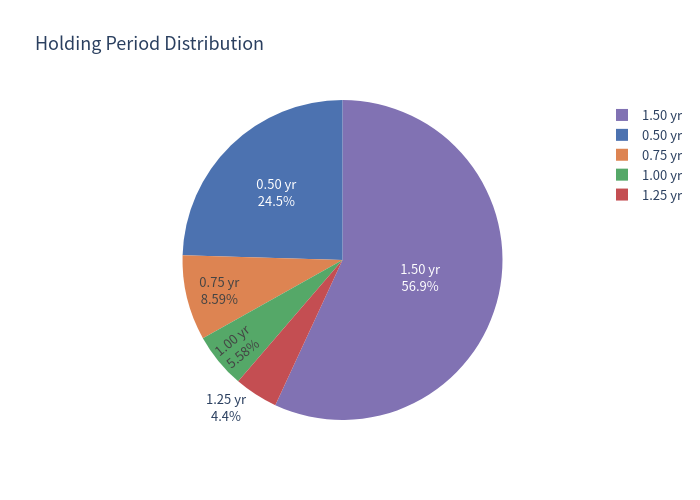
| Called early by the issuer | 43.10% |
| Barrier (55%) breached at least once | 15.08% |
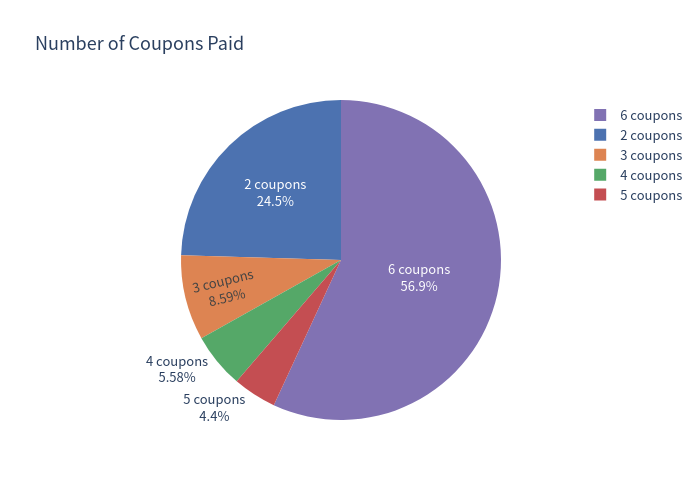
| Held the full 18 months to maturity | 56.90% |
| Received all 6 coupons | 56.90% |
Charts
Simulation Outcomes — Product vs Benchmark
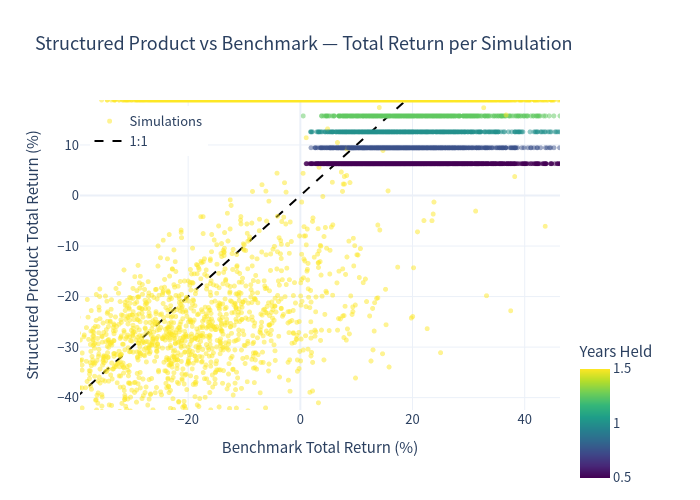
Each point is one scenario: the structured product's total return (y) versus the equal-weight basket's total return (x), coloured by holding period. Points above the dashed 1:1 line are scenarios where the product beat buying the basket.
Risk / Return Positioning
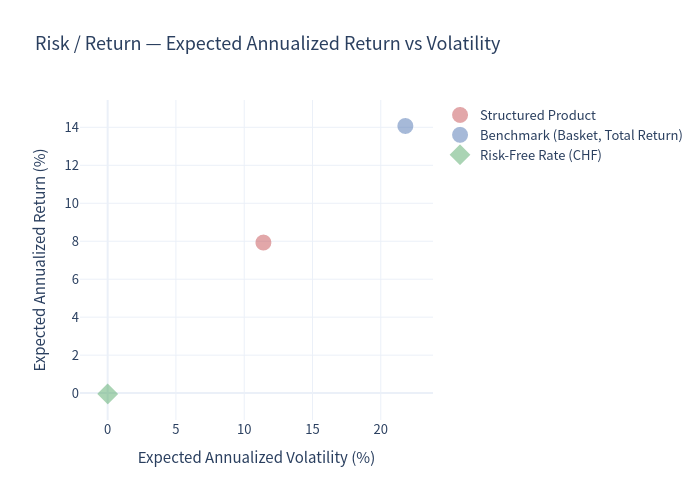
The product sits meaningfully to the left of the basket — about half the volatility — while carrying a lower annualized expected return, and it stands well above the (near-zero) risk-free rate.
Scenario Probabilities
Distribution of Annualized Returns
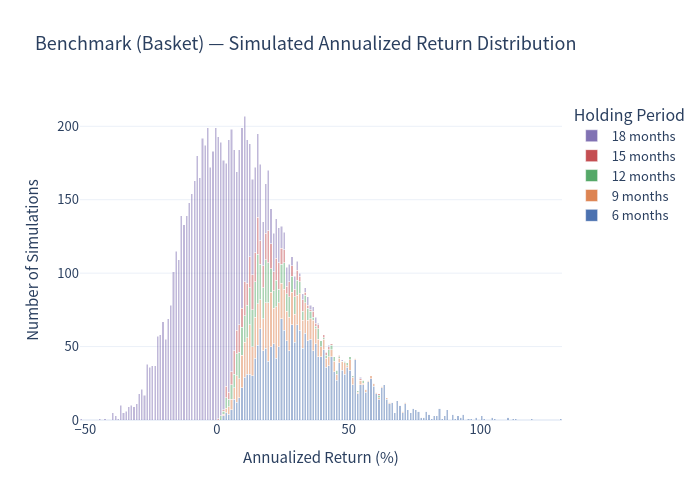
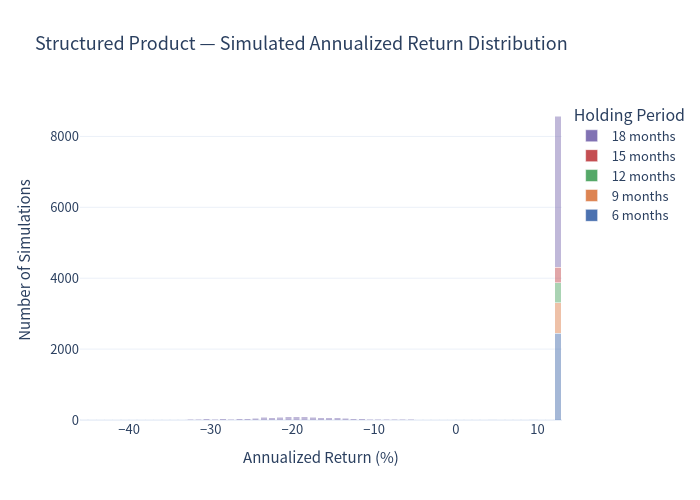
The product's distribution is tightly capped at +12.6% with a modest negative tail; the basket's has a much wider two-sided spread.
Box Plot Comparison
Holding Period and Coupon Counts
Investment Commentary
Potential strengths
- High, unconditional income: the 12.60% p.a. coupon is paid in every path; the median outcome is a full 12.60% return.
- A real capital cushion: the 55% barrier (plus the coupons already received) absorbs a sizeable fall in the worst share before the investor is exposed to loss.
- Lower volatility than direct ownership: expected annualized volatility (11.4%) is roughly half that of the equal-weight basket (21.8%), and the probability of any loss is far lower (14% vs 33%).
Points to weigh
- Worst-of fragility: the barrier and the redemption depend on the weakest of three shares, so one poor performer drives the outcome.
- Capped upside, deep downside: the investor never shares in a rally beyond the coupon, yet absorbs the full fall of the worst share once the barrier is breached — which is why the 1-year 99% VaR (-30.8%) is deeper than the basket's.
- Call risk / lower annualized expected return: with a 43% chance of early redemption (often in the strongest markets) the investor faces re-investment risk exactly when the market is rising, and the 7.93% annualized expected return sits well below the basket's on an annualized basis.
Assumptions
- Issuer call: the term sheet gives the issuer the right but not the obligation to redeem quarterly from month 6. We model a rational issuer calling at the first observation date on which the worst share is at or above its starting level (100%). A sensitivity assuming no early call (all scenarios held to maturity) gives a product expected annualized return of 7.53% (vol 11.60%, loss probability 14.78%) versus 7.78% for the basket — i.e., the broad conclusions are robust to the call assumption.
- The 55% barrier is continuously observed; the monthly simulation paths are refined with an intra-month (Brownian-bridge) breach test so this is respected.