
9.40% p.a. Callable Multi Barrier Reverse Convertible
Headline simulation results
How the product works (plain language)
The note pays a high fixed coupon of 9.40% a year (CHF 23.50 per CHF 1,000, quarterly) regardless of how the three Swiss stocks perform. In exchange, the investor accepts downside risk on a worst-of basis:
- If no barrier event occurs — i.e. none of Geberit, Holcim or VAT Group ever trades at or below 49% of its starting level at any time in the ~18-month life — the investor receives 100% of capital back at maturity plus all coupons.
- If the 49% barrier is touched at any point and, at maturity, the worst-performing of the three stocks finishes below its starting level, the investor instead receives that worst stock (or its cash equivalent) worth less than par — the full downside of the weakest name is borne.
- Upside is capped: the investor never earns more than capital + coupons, however high the stocks rise.
- Issuer call: the issuer may redeem early (at par + the current coupon) on any of four quarterly observation dates, which truncates future coupon income when the trade is comfortably "in the money."
Key statistics — Structured Product vs Underlying
Benchmark: equal-weight basket of the three underlyings (Geberit, Holcim, VAT Group); benchmark "total return" adds their dividends (≈2.03% p.a. equal-weighted) to the simulated price return.
| Metric (annualized) | Structured Product | Underlying basket (total return) |
|---|---|---|
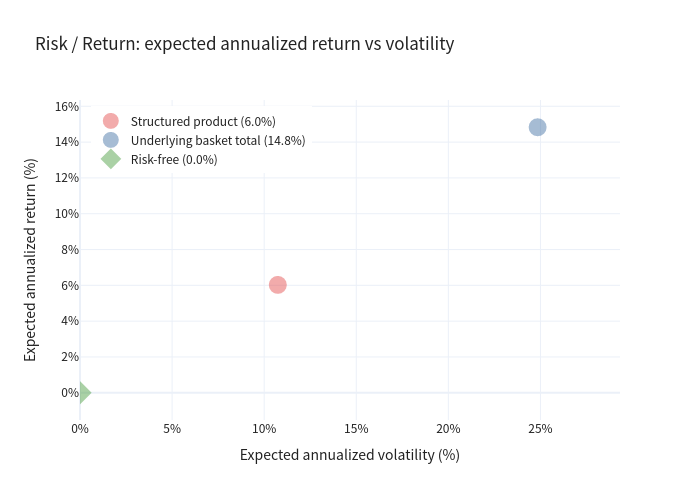
| Expected annualized return | 6.02% | 14.83% |
| Expected annualized volatility | 10.74% | 24.85% |
| Probability of loss (annualized < 0) | 8.77% | 30.80% |
| 99% confidence VaR (1-year) | −36.17% | −26.88% |
Benchmark price-only annualized return is 12.78%; dividends add ≈2 percentage points for the total-return figure above.
Key underlying characteristics (historical, 20-yr daily)
| Underlying | Ann. volatility | Dividend yield |
|---|---|---|
| Geberit AG | 24.76% | 2.31% |
| Holcim Ltd | 31.76% | 2.62% |
| VAT Group AG | 35.50% | 1.17% |
Simulation results & charts
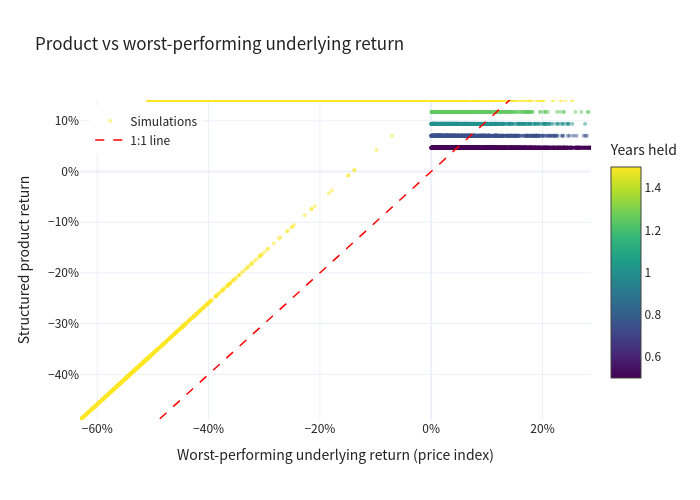
Product vs worst-performing underlying (each dot = one scenario)
The product return sits in a tight band around the coupon carry and only falls sharply when a 49% barrier breach coincides with the worst-of finishing below par — the signature capped-upside / leveraged-downside profile of a reverse convertible. (A negative final return without a barrier breach still redeems at par.)
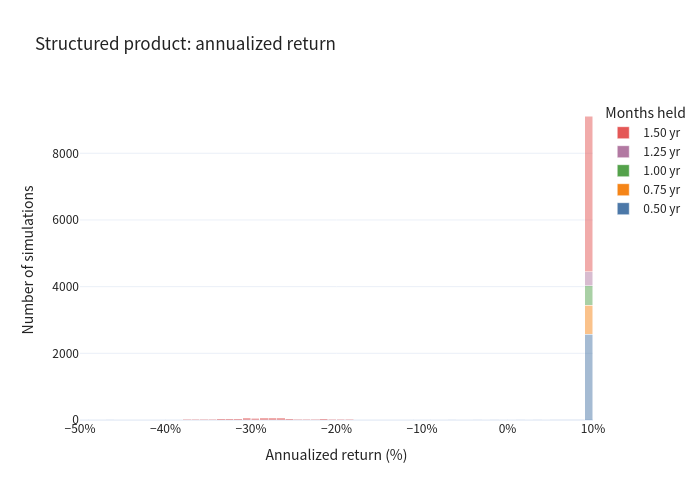
Annualized return distributions (stacked by holding period)
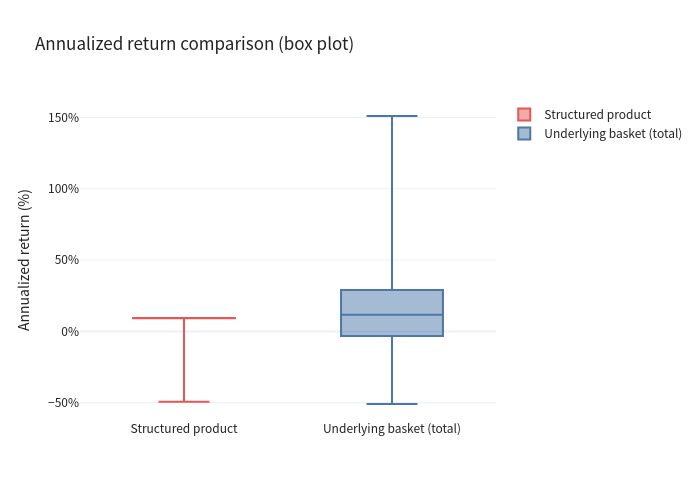
Structured product — outcomes cluster near the ~9.4% coupon carry, with a small loss tail.
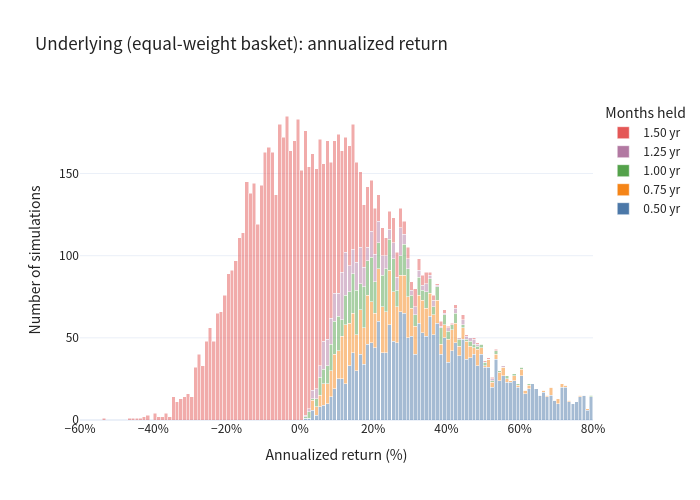
Underlying basket distribution
Underlying basket — a wide, roughly symmetric market-return distribution.
Risk / Return positioning
The note sits far to the left of the basket: roughly half the volatility, but also a lower expected return.
Return comparison (box plot)
Scenario probabilities
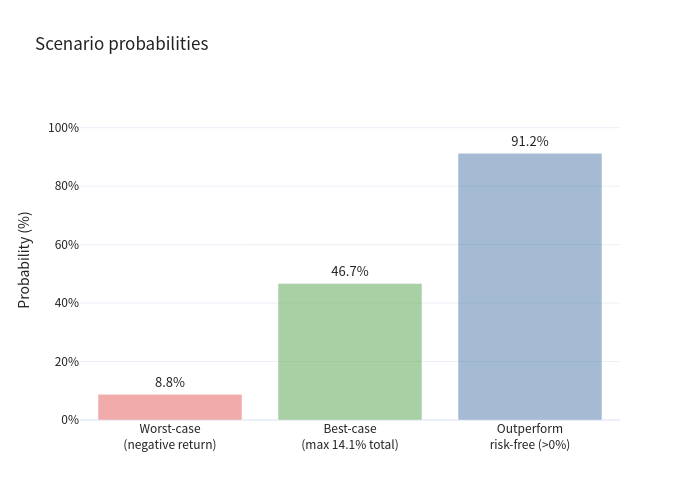
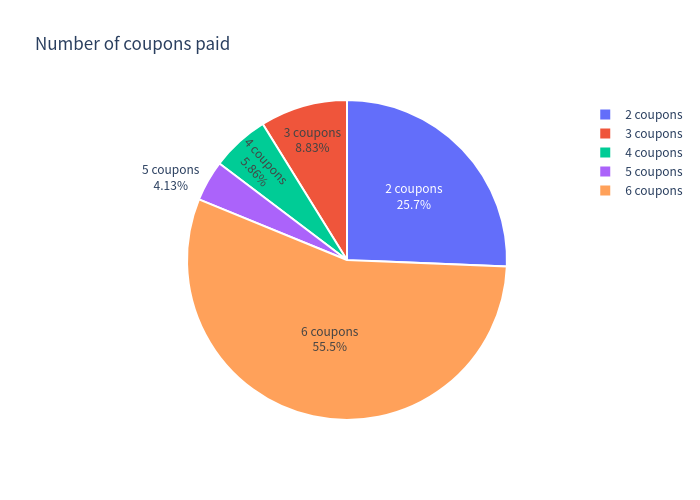
Only ≈9% of paths lose money, and roughly 47% achieve the maximum total return of 14.1% (all six coupons + par back).
Holding period distribution
Number of coupons paid
Holding period and the interpretation of annualized figures
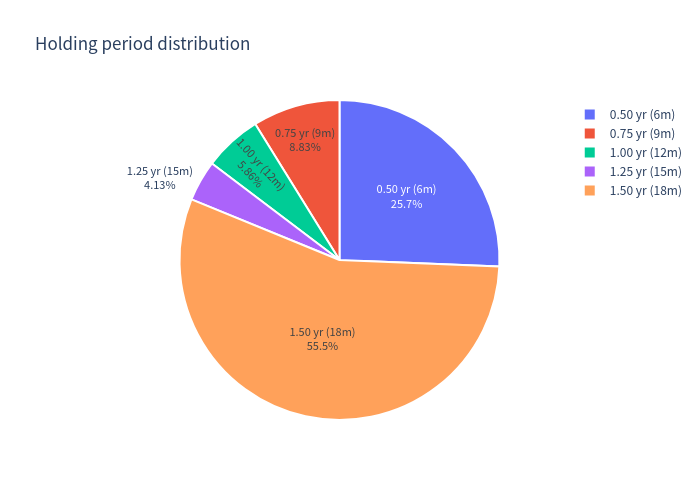
Because the note terminates on early calls, holding periods are short and variable (6, 9, 12, 15 or 18 months). Short holding periods make annualized figures look more extreme:
- Expected total return over the realized holding period: 6.07% (median 11.75%), earned over an average ≈1.14-year holding period.
- Roughly 26% of scenarios are called after just 6 months, locking in ≈4.7% (≈9.4% annualized). These quick, favorable calls lift the average annualized figure while giving up any further market upside.
- The benchmark's higher annualized return (14.83%) is flattered by the same effect working in the opposite direction: in rally-driven early terminations the uncapped basket may have risen 20–40% over a few months, which annualizes to a very large number — precisely the upside the capped note forgoes. On a realized total-return basis over the same horizon, the product (6.07%) and the basket (≈6.6% price, ≈8.9% with dividends) are much closer than the annualized averages suggest.
Investment commentary
Good points worth noting
- High, frequent income: a 9.40% p.a. coupon paid quarterly, in cash, regardless of market direction — attractive in a low-rate (CHF ≈0%) environment.
- Low loss frequency: in ≈91% of scenarios the investor does not lose money; the probability of a loss (8.77%) is far below the underlying basket's (30.80%).
- Volatility dampening: realized return volatility (≈10.7%) is roughly half that of the underlying basket (≈24.9%). The wide 49% barrier is breached in only ≈9.1% of paths, and the great majority of those end in a loss (loss probability ≈8.8%).
- Defined, capped payoff: maximum outcome is fully known (coupons + par), which suits income-oriented, downside-aware investors comfortable with a worst-of equity exposure.
Trade-offs to keep in mind
- Capped upside: the investor participates in none of the stocks' gains beyond the coupon.
- Concentrated, negatively-skewed downside: the payoff is "frequent small gains, occasional large losses." In the ≈9% of paths where the barrier is touched and the weakest of the three stocks finishes below its starting level, the loss follows that weakest name — so the 1-year 99% VaR (−36.17%) is actually worse than the basket's (−26.88%), despite the lower volatility and lower loss frequency.
- Early call truncation: in rising markets the issuer is likely to call, capping the number of coupons collected and re-investment risk.
- Issuer & worst-of concentration: exposed to BKB credit risk and to the single weakest of three stocks (Geberit, Holcim, VAT Group), all Swiss industrials/cyclicals.