
Structured Product Evaluation Report: Bonus Outperformance Certificate on Swiss Fallen Angels Basket
Executive Summary
This report presents a Monte Carlo simulation analysis of a Bonus Outperformance Certificate issued by Leonteq Securities AG on a basket of five Swiss blue-chip stocks. The product offers leveraged upside participation (175%) but removes principal protection if any underlying stock falls below 55% of its initial level.
Headline Simulation Results (10,000 simulations, 2-year horizon)
| Metric | Structured Product | Underlying Basket (Total Return) |
|---|---|---|
| Expected Annualized Return | 7.13% | 7.64% |
| Annualized Volatility | 24.76% | 13.37% |
| Probability of Negative Return | 23.35% | 29.22% |
| 99% VaR (1-year) | -42.78% | -20.62% |
| Barrier Trigger Probability | 23.43% | N/A |
Key Insights:
- The structured product offers slightly lower expected return than the underlying basket (7.13% vs 7.64% annualized).
- However, it exhibits significantly higher volatility (24.76% vs 13.37%).
- The product has a 23.35% probability of loss, slightly lower than the basket's 29.22%, but losses can be substantially larger (99% VaR of -42.78% vs -20.62%).
- The continuous barrier at 55% is triggered in approximately 23.4% of simulations, converting the payoff to the worst-performing stock.
Product Overview
Basic Mechanics
- Product Type: Bonus Outperformance Certificate with Continuous Multi Barrier
- Underlying Assets: Equal-weighted basket of 5 Swiss stocks (Alcon, Givaudan, Partners Group, Sika, Sonova)
- Maturity: 2 years (January 2026 to January 2028)
- Principal Protection: Full principal protection if no barrier event occurs (regardless of basket performance)
- Upside Participation: 175% participation on basket performance above 100% (uncapped)
- Barrier: Continuous monitoring at 55% of each stock's initial level. If any stock breaches this level, the product payoff switches to the worst-performing stock's return.
Payoff Scenarios
- No Barrier Event:
- If final basket ≤ 100%: Return of principal (0% return)
- If final basket > 100%: Principal + 175% × (basket return above 100%)
- Important: Principal is fully protected (return of principal, 0% return) regardless of basket performance when no barrier event occurs.
- Barrier Event Triggered:
- Payoff = 100% × worst-performing stock's return (potential full loss of principal)
Performance Analysis
Return Distribution
The charts below compare the structured product's performance with the underlying basket's total return (including dividends).
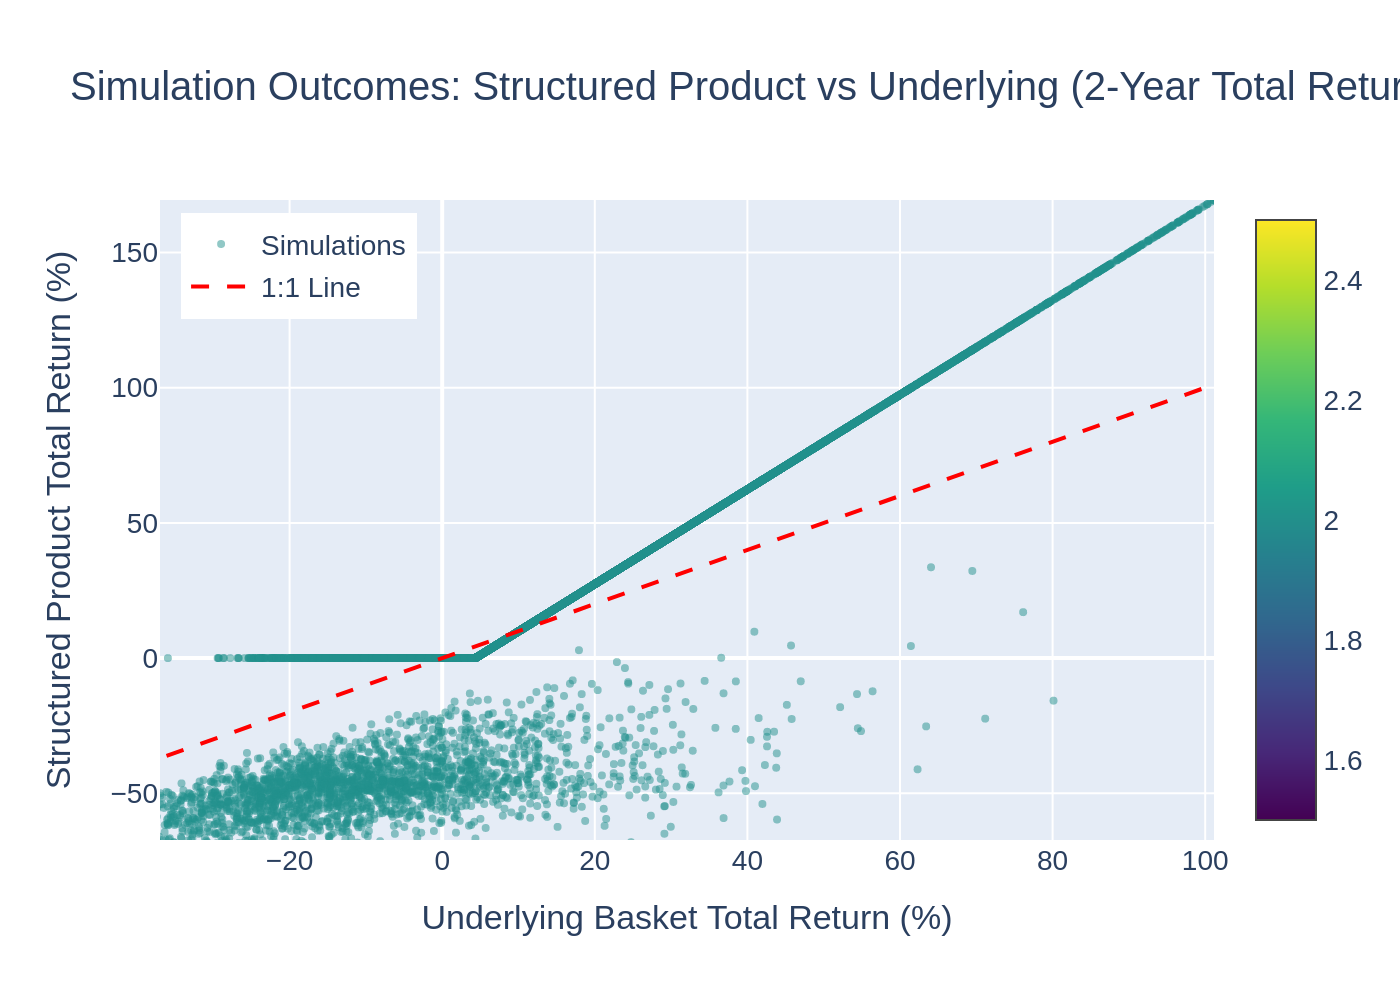
Scatter plot of structured product vs underlying basket total returns (2-year horizon). The 1:1 line indicates where product and underlying returns are equal.
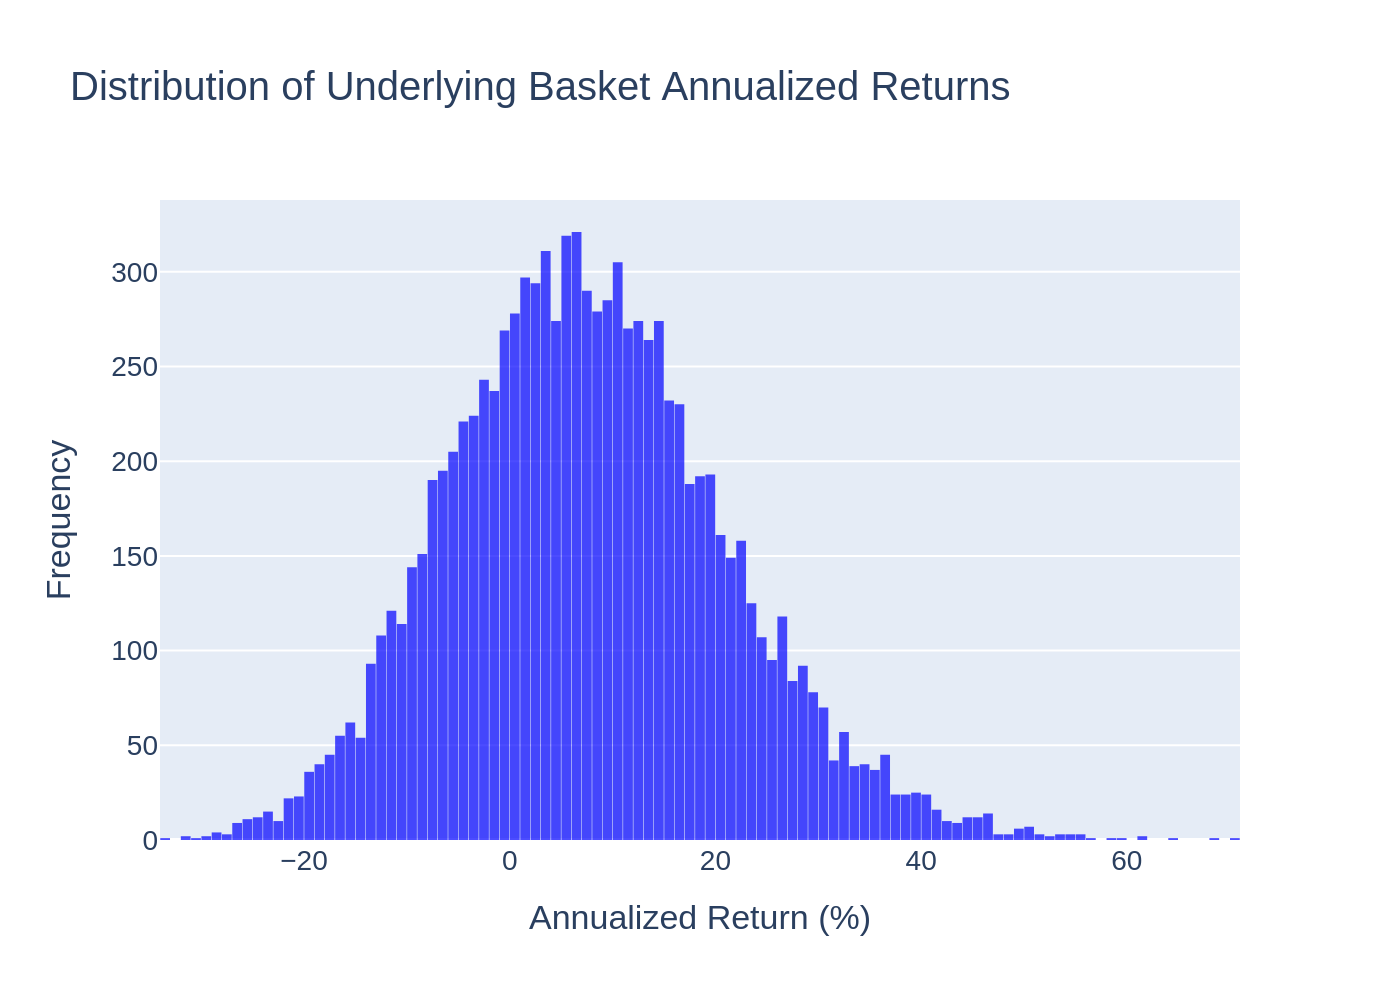
Distribution of underlying basket annualized returns. Mean: 7.64%, volatility: 13.37%.
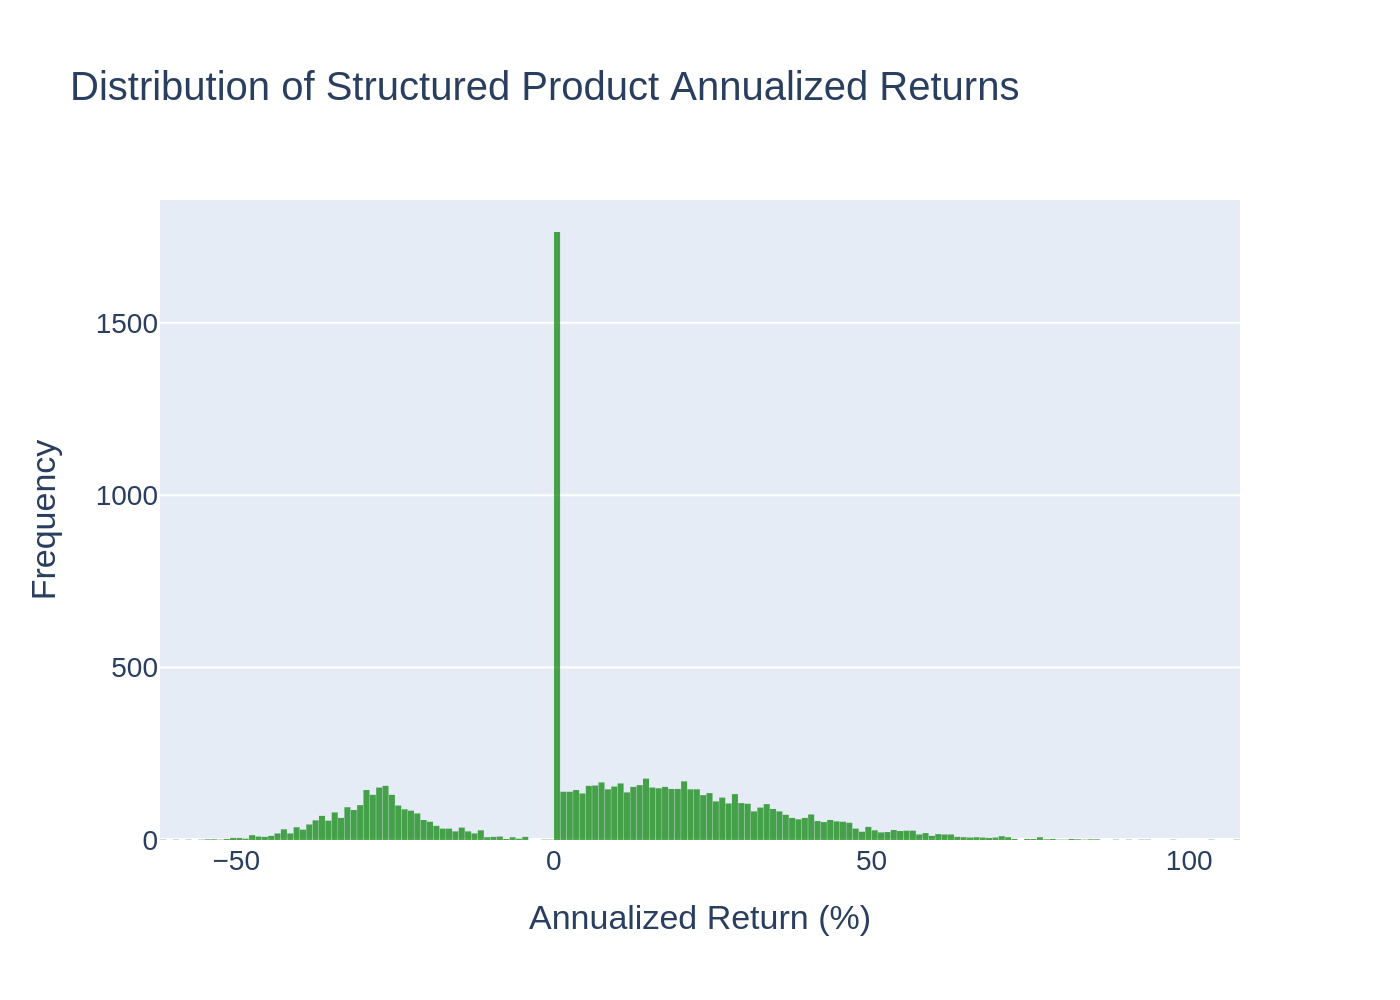
Distribution of structured product annualized returns. Note the fatter left tail compared to the underlying.
Risk-Return Profile
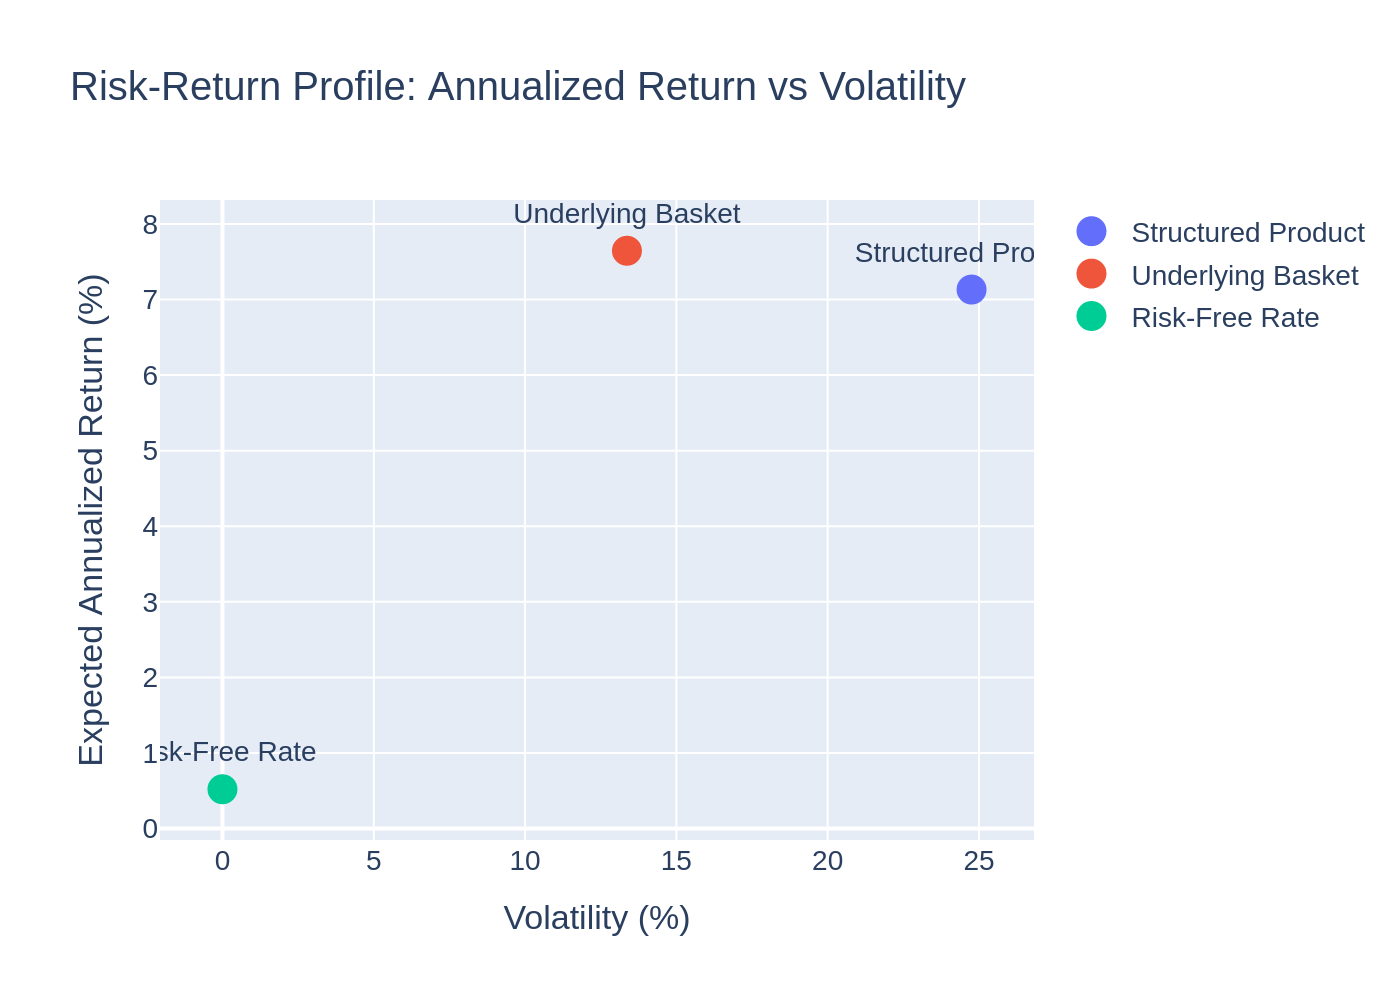
Expected annualized return vs volatility for the structured product, underlying basket, and risk-free rate.
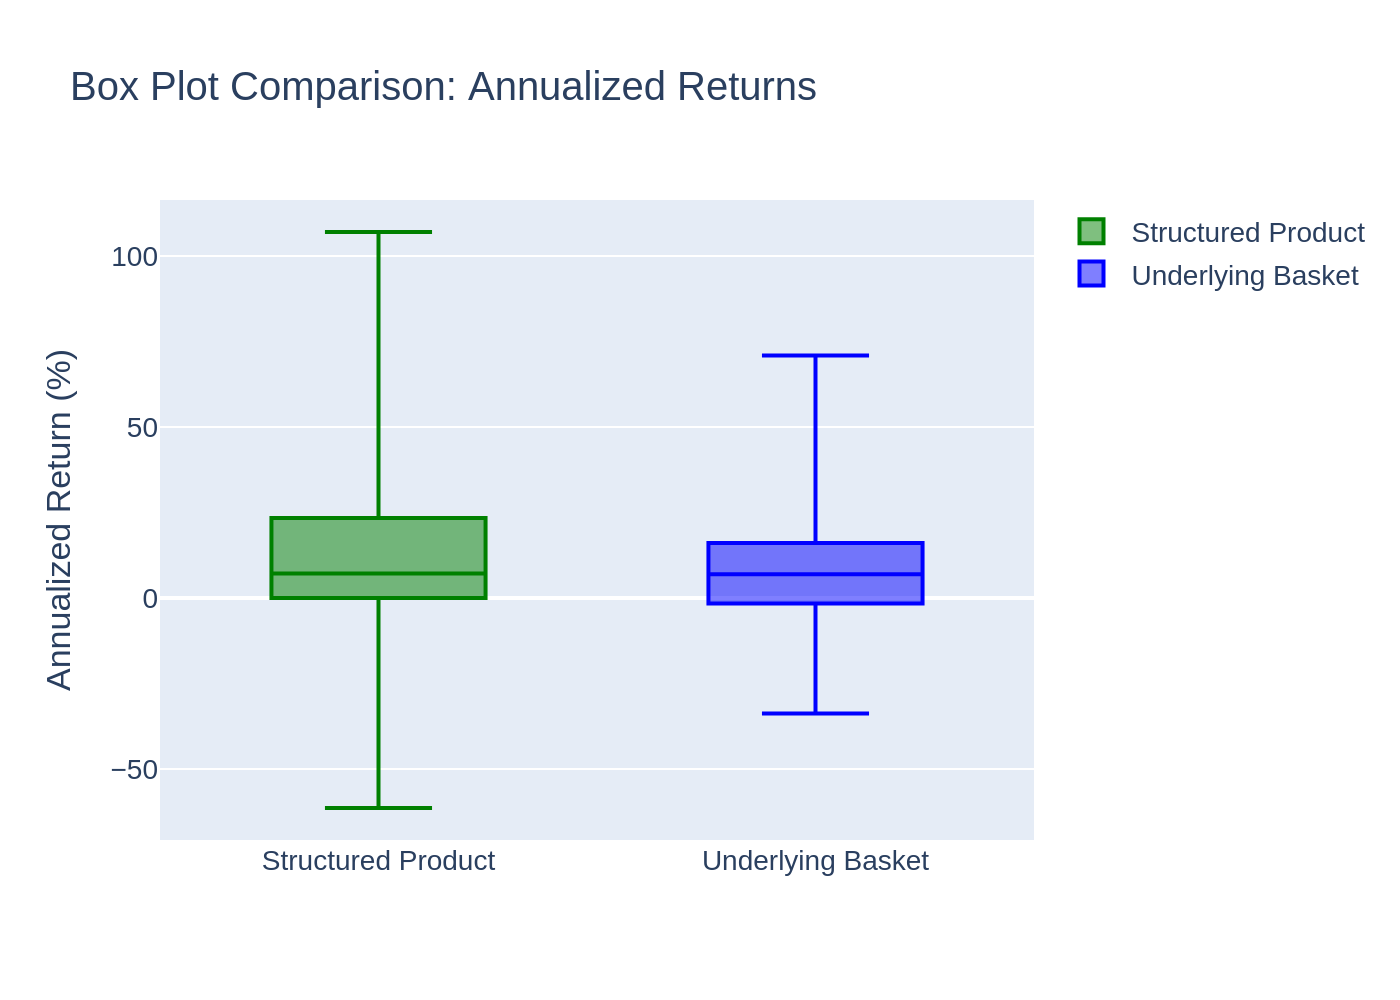
Box plot comparison of annualized returns. The structured product shows wider dispersion and more extreme outliers.
Scenario Analysis
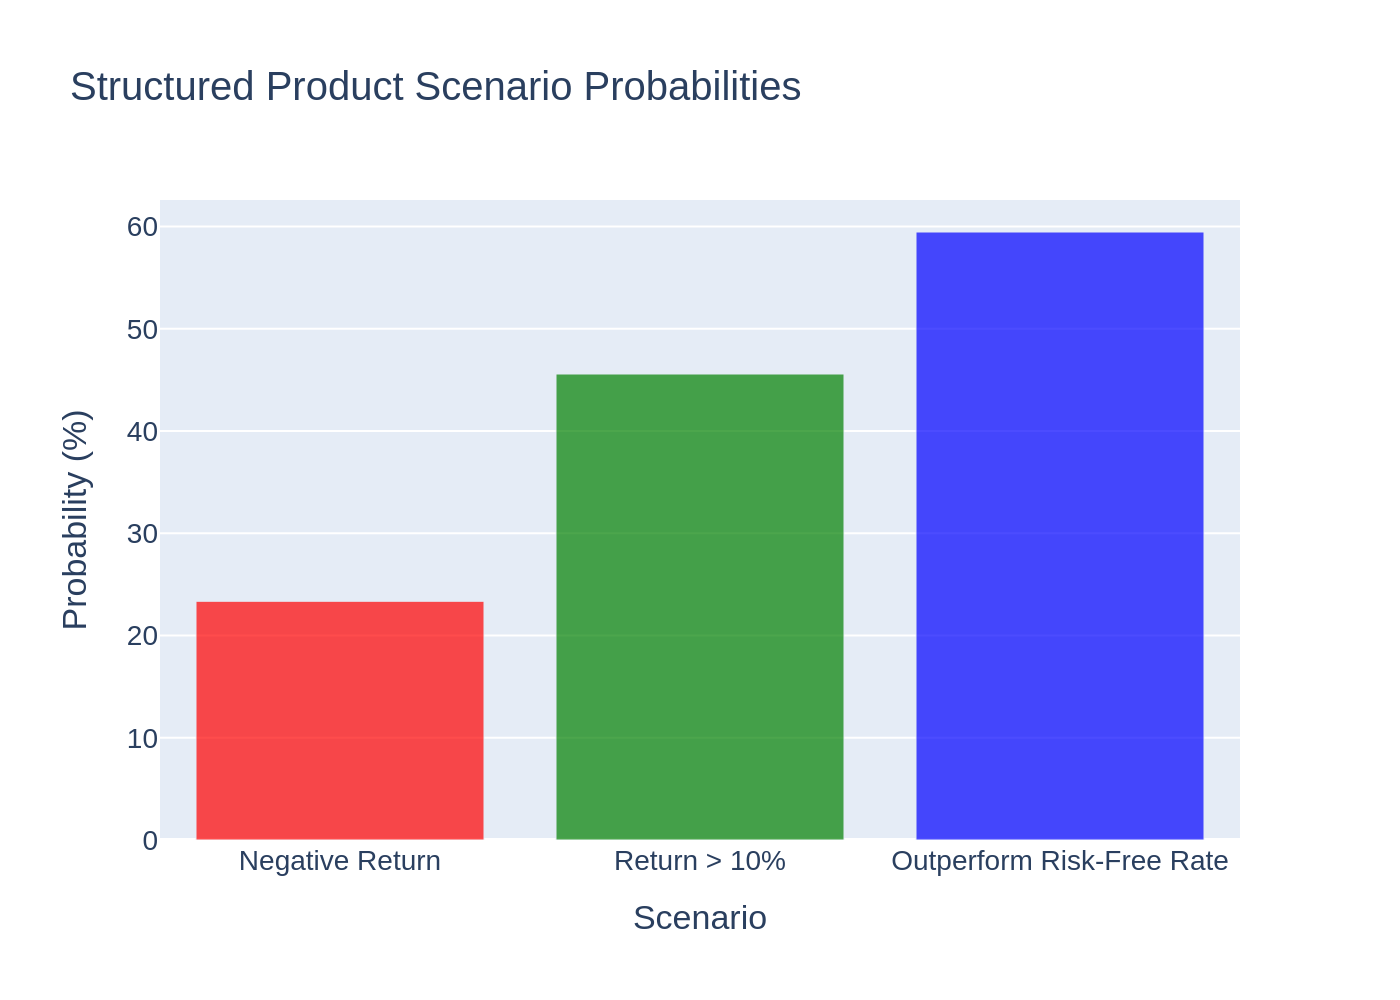
Probability of key scenarios: negative return, return > 10%, and outperforming the risk-free rate (0.52%).
Statistical Comparison
| Statistic | Structured Product | Underlying Basket | Difference |
|---|---|---|---|
| Mean Return (annual) | 7.13% | 7.64% | -0.51% |
| Volatility (annual) | 24.76% | 13.37% | +11.39% |
| Sharpe Ratio* | 0.267 | 0.533 | -0.266 |
| Skewness | -0.013 | 0.319 | -0.332 |
| Excess Kurtosis | -0.241 | 0.240 | -0.481 |
*Sharpe ratio uses Swiss long-term government bond yield (0.52%) as risk-free rate.
Key Observations:
- The structured product has lower Sharpe ratio than the underlying basket (0.267 vs 0.533), indicating inferior risk-adjusted returns.
- The product exhibits negative skewness (-0.013) compared to the basket's positive skewness (0.319), suggesting a higher likelihood of large negative returns.
- Negative excess kurtosis (-0.241) indicates thinner tails compared to a normal distribution, meaning extreme returns are less frequent than in a normal distribution with the same volatility.
Investment Commentary
Potential Benefits
- Leveraged Upside: 175% participation above the 100% bonus level provides amplified returns in strong market environments.
- Principal Protection: Full principal protection is guaranteed if no barrier event occurs, regardless of basket performance.
- Diversification: Exposure to five different Swiss blue-chip stocks reduces single-stock risk (except for the worst-of feature after barrier trigger).
Key Risks
- Barrier Risk: The 55% continuous barrier is relatively close to the initial level, with a 23.4% probability of being triggered. Once triggered, investors lose all principal protection and are exposed to the worst-performing stock's full downside.
- Asymmetric Payoff: While upside participation is uncapped, downside exposure can be severe (up to -100% if a stock goes to zero).
- Complexity: The product's payoff depends on multiple conditions (barrier monitoring, basket performance, worst-of calculation), making it difficult for investors to fully understand the risk profile.
- Higher Volatility: The structured product's returns are significantly more volatile than the underlying basket, increasing uncertainty.
Market Conditions Suitability
- Bullish on Swiss equities but with low volatility expectations: The product benefits from stable or rising markets without significant drawdowns.
- Low interest rate environment: The minimal bondfloor (0.04% annual yield) makes the product relatively unattractive as a fixed income alternative.
- Investors with high risk tolerance: Suitable for investors willing to accept the possibility of substantial losses in exchange for leveraged upside potential.
Limitations and Assumptions
- Simulation Methodology: Monte Carlo simulations based on historical volatility and correlation patterns may not capture future market regimes.
- Dividend Treatment: Underlying basket total returns include estimated dividend yields (ranging from 0.44% to 3.83% annually) added linearly over 2 years.
- Barrier Monitoring: Continuous barrier monitoring approximated using monthly price observations, which may underestimate the true probability of barrier breach.
- Market Data: Analysis based on 20 years of historical data for the underlying stocks and 5 years for Swiss government bond yields.
- No Fees or Taxes: The analysis excludes any issuance fees, management fees, or tax implications.
Conclusion
The Bonus Outperformance Certificate offers a complex risk-return profile that may appeal to investors seeking leveraged exposure to Swiss equities with conditional principal protection. However, the product's higher volatility, significant downside risk upon barrier trigger, and lower risk-adjusted returns compared to the underlying basket suggest that investors should carefully evaluate whether the potential upside justifies the additional complexity and risk.
This report is for informational purposes only and does not constitute financial advice. Investors should consult with a financial advisor before making any investment decisions.