
12.00% p.a. Multi Barrier Reverse Convertible (Callable, Quanto USD) on Nestlé, Novartis, Roche
1. Headline Simulation Results
Based on 10,000 Monte-Carlo simulations over the product's life (up to 24 months):
| Headline metric | Value |
|---|---|
| Expected annualized return | 10.45% |
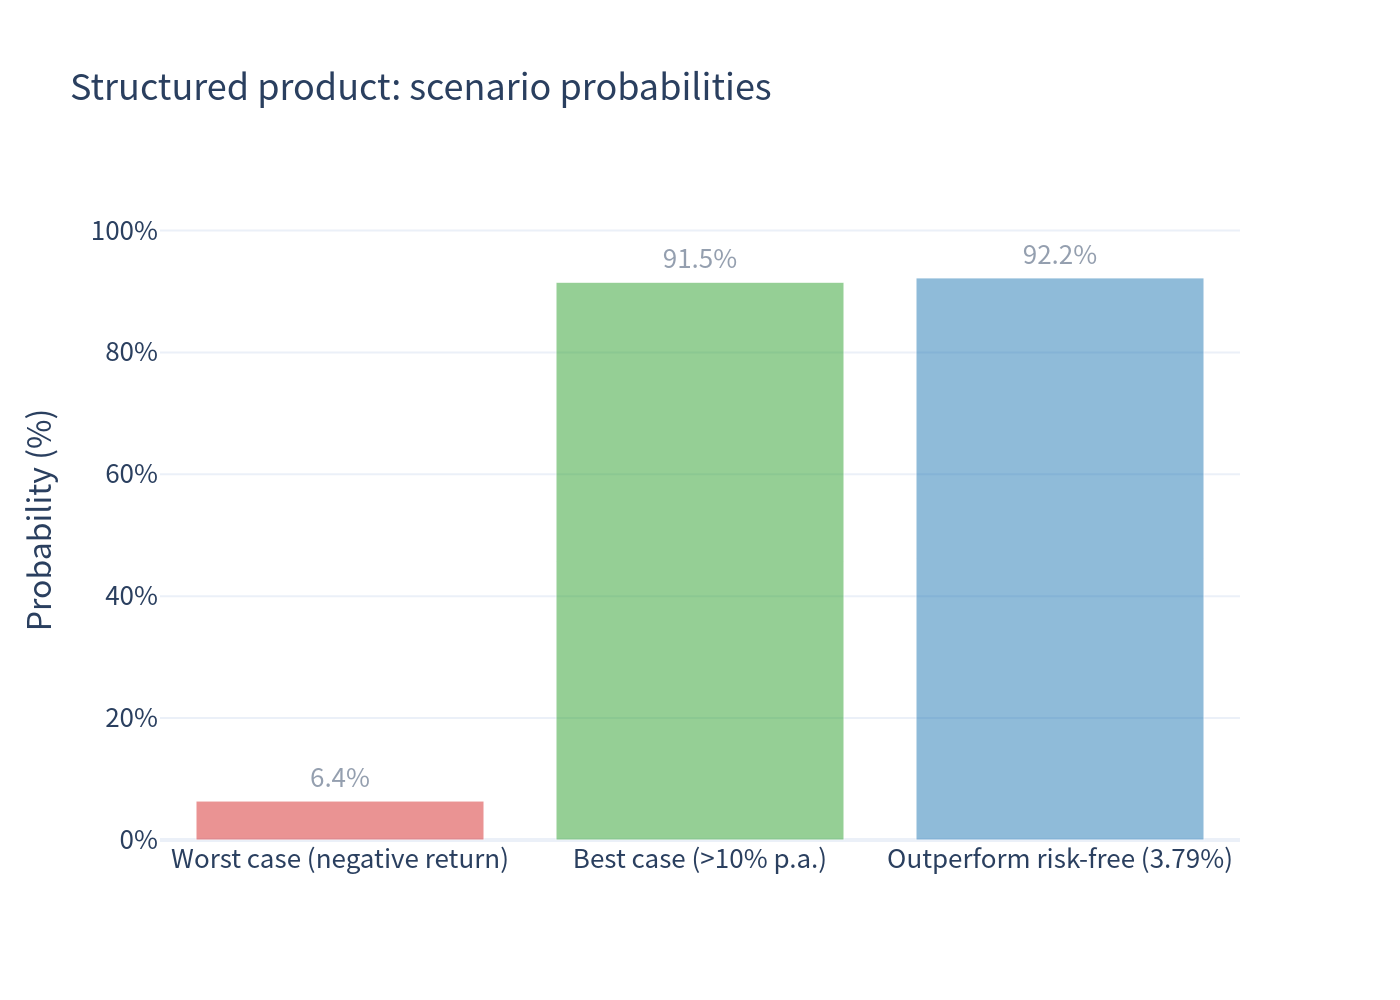
| Probability of a negative return | 6.39% |
| 99% confidence VaR (1 year) | –9.12% |
| Expected holding period | 17.2 months (≈ 1.43 years) |
| Expected total return over the realised holding period | +14.54% |
| Coupon | 12.00% p.a. — fixed & unconditional, paid quarterly |
| Issuer early-redemption probability (cumulative) | 65.7% |
| Barrier-Event probability (over the life) | 8.6% |
The product converts a fixed, unconditional 12.00% p.a. coupon stream into a defensive risk/return profile: a modest expected return (10.45% p.a.) delivered with roughly one-third of the volatility of the underlying shares (4.55% vs 12.76%), in exchange for giving up essentially all upside participation.
2. How the Product Works (Plain-Language)
- Three underlyings, worst-of: Nestlé, Novartis and Roche. Everything is driven by the worst-performing of the three.
- Coupon is unconditional: the investor receives 12.00% p.a. (USD 30 per USD 1,000 denomination, quarterly) regardless of how the shares move, for as long as the product is alive.
- Conditional capital protection (barrier at 69%): as long as none of the three shares ever trades at or below 69% of its starting level during the ~2-year life, the investor gets the full denomination (100%) back at maturity.
- If the barrier is breached and the worst share finishes below its start: the investor receives the worst-performing share (or its cash equivalent) — i.e. it bears the downside. If the worst share recovers back to/above its start, par is returned.
- Issuer callable: the issuer may redeem early on four quarterly observation dates (months 12, 15, 18, 21). On a call the investor receives par plus the then-current coupon and the product ends. (Because no explicit trigger is published, the call is modelled as being exercised when the worst-of stands at or above its starting level — an ASSUMPTION.)
- Quanto USD: FX exposure to the Swiss franc is neutralised; returns are expressed in USD terms.
Net result: this is a yield-enhancement / reverse-convertible payoff — a bond-like coupon plus a sold down-and-in “put” on the worst-of basket. Upside is capped; the coupon is the entire return.
3. Key Statistics (annualized)
| Metric | Structured product | Underlying basket (total return, incl. dividends) |
|---|---|---|
| Expected annualized return | 10.45% | 15.66% |
| Expected annualized volatility | 4.55% | 12.76% |
| Probability of loss | 6.39% | 9.93% |
| 99% confidence VaR (1 year) | –9.12% | –10.55% |
4. Charts
4.1 Simulation outcomes — product vs underlying
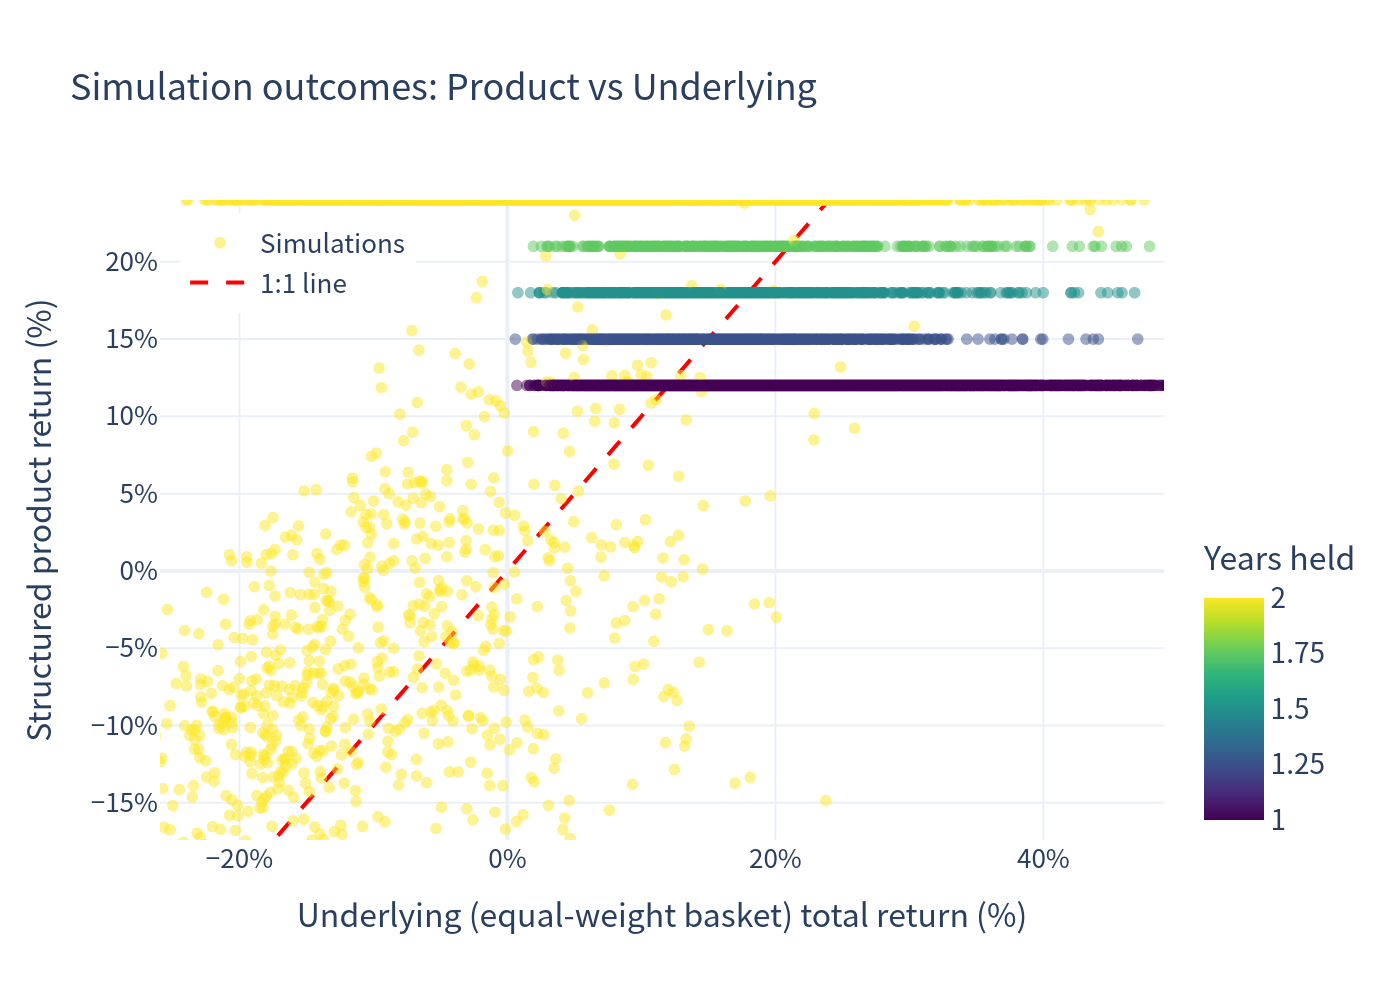
Each dot is one simulation; the dashed line is 1:1. Outcomes sit above the diagonal at low returns (protection/fixed coupon) and grind along a flat ceiling near +24% at high underlying returns (upside is capped). Colour = years held.
4.2 Annualized total-return histograms
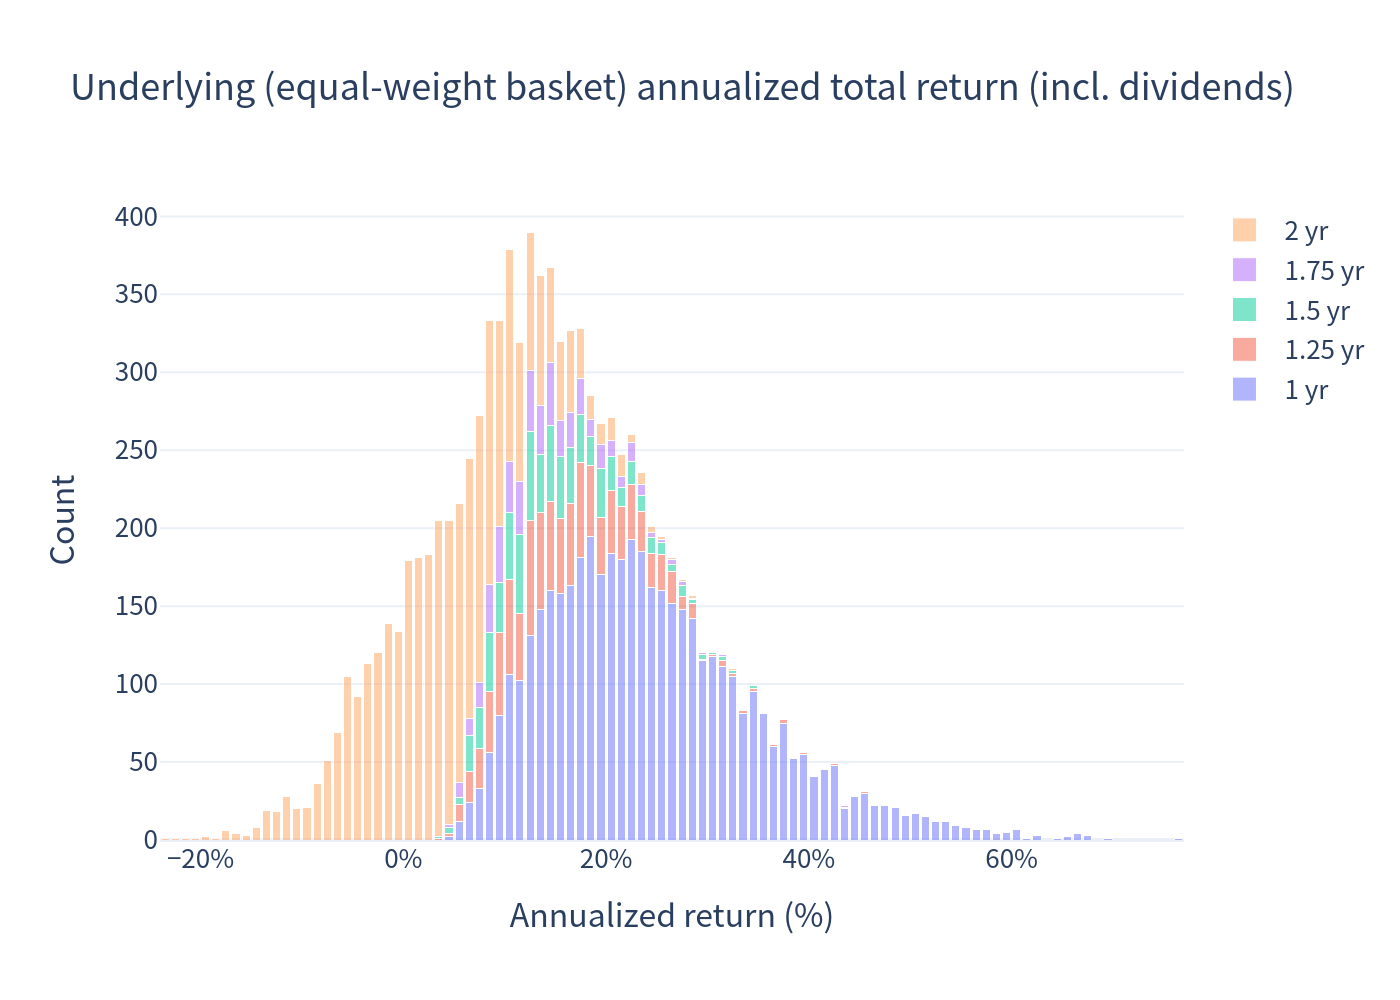
Underlying basket (equal-weighted, total return incl. dividends):
Structured product
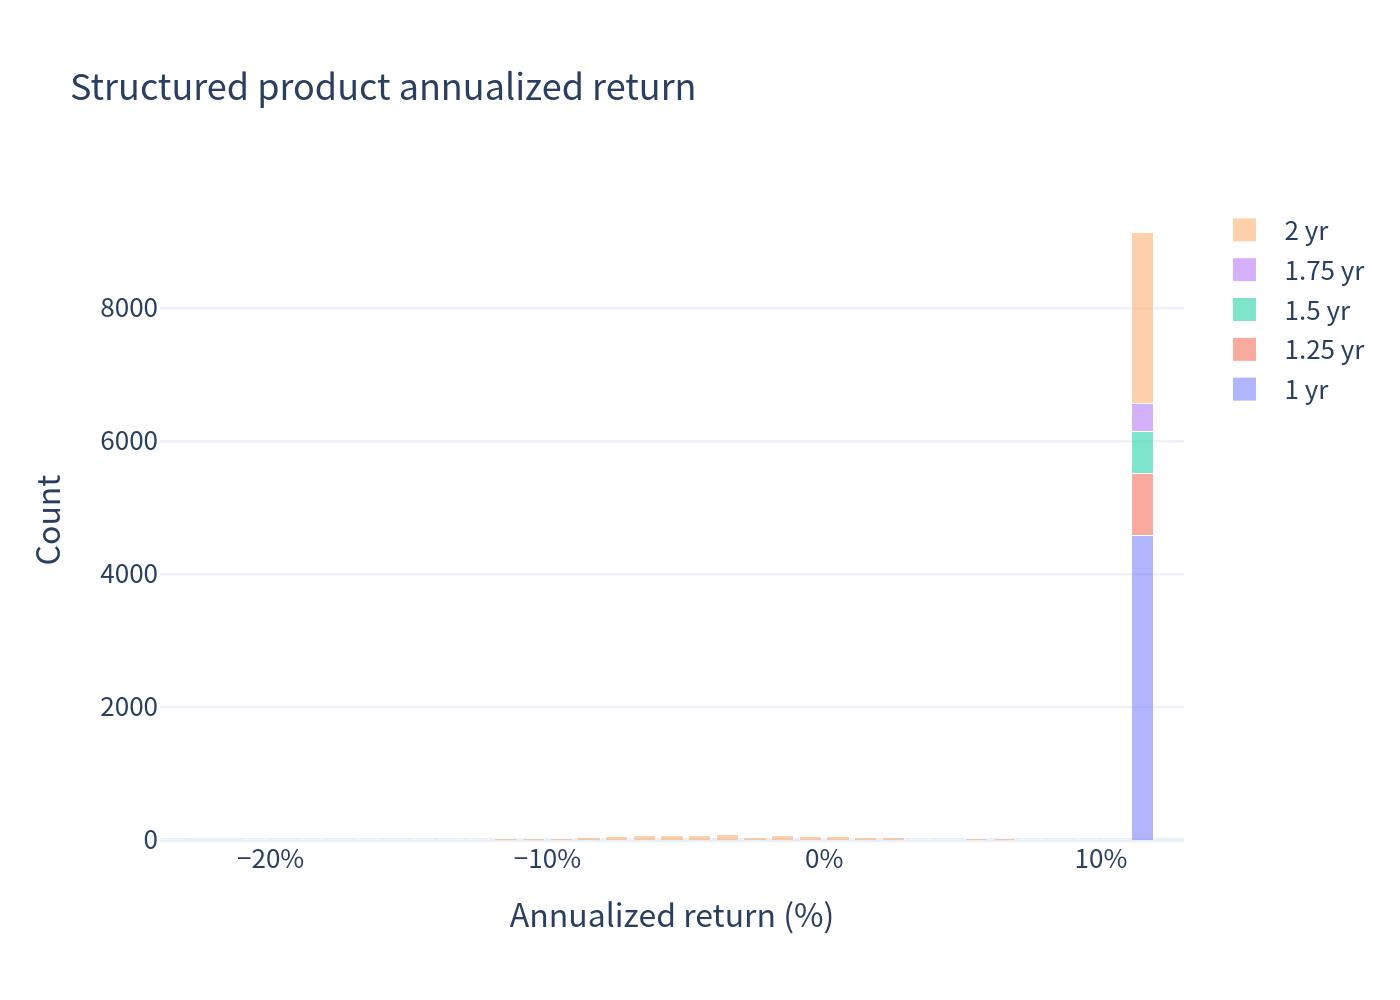
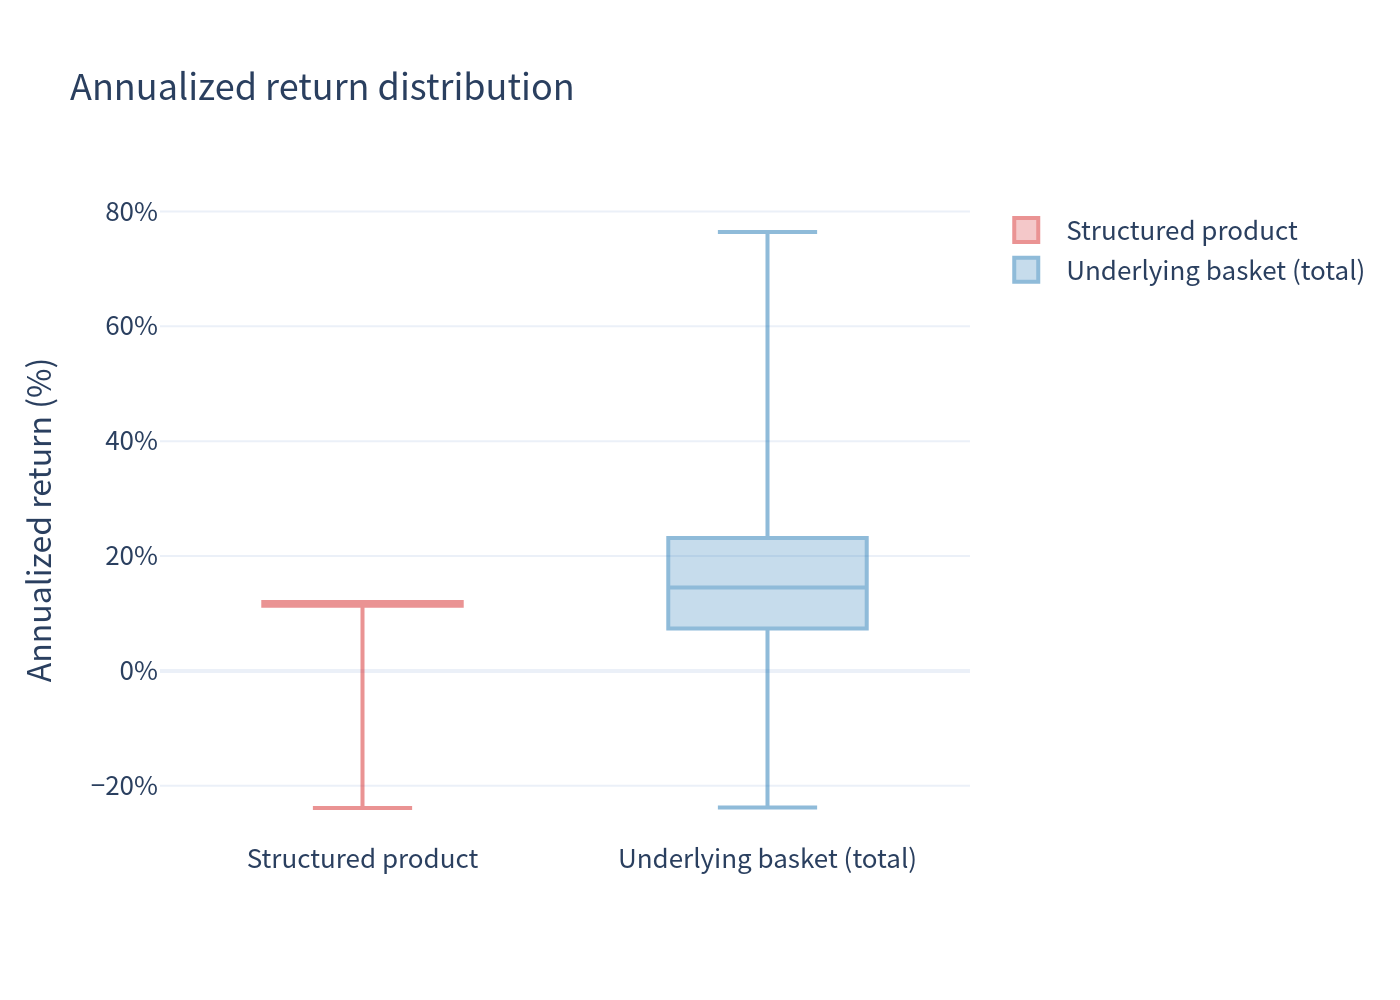
The underlying distribution is wide and roughly symmetric around its mean; the product distribution is sharply concentrated near its coupon ceiling, with a small left tail representing barrier-event losses.
4.3 Scenario probabilities (structured product)
4.4 Risk vs return
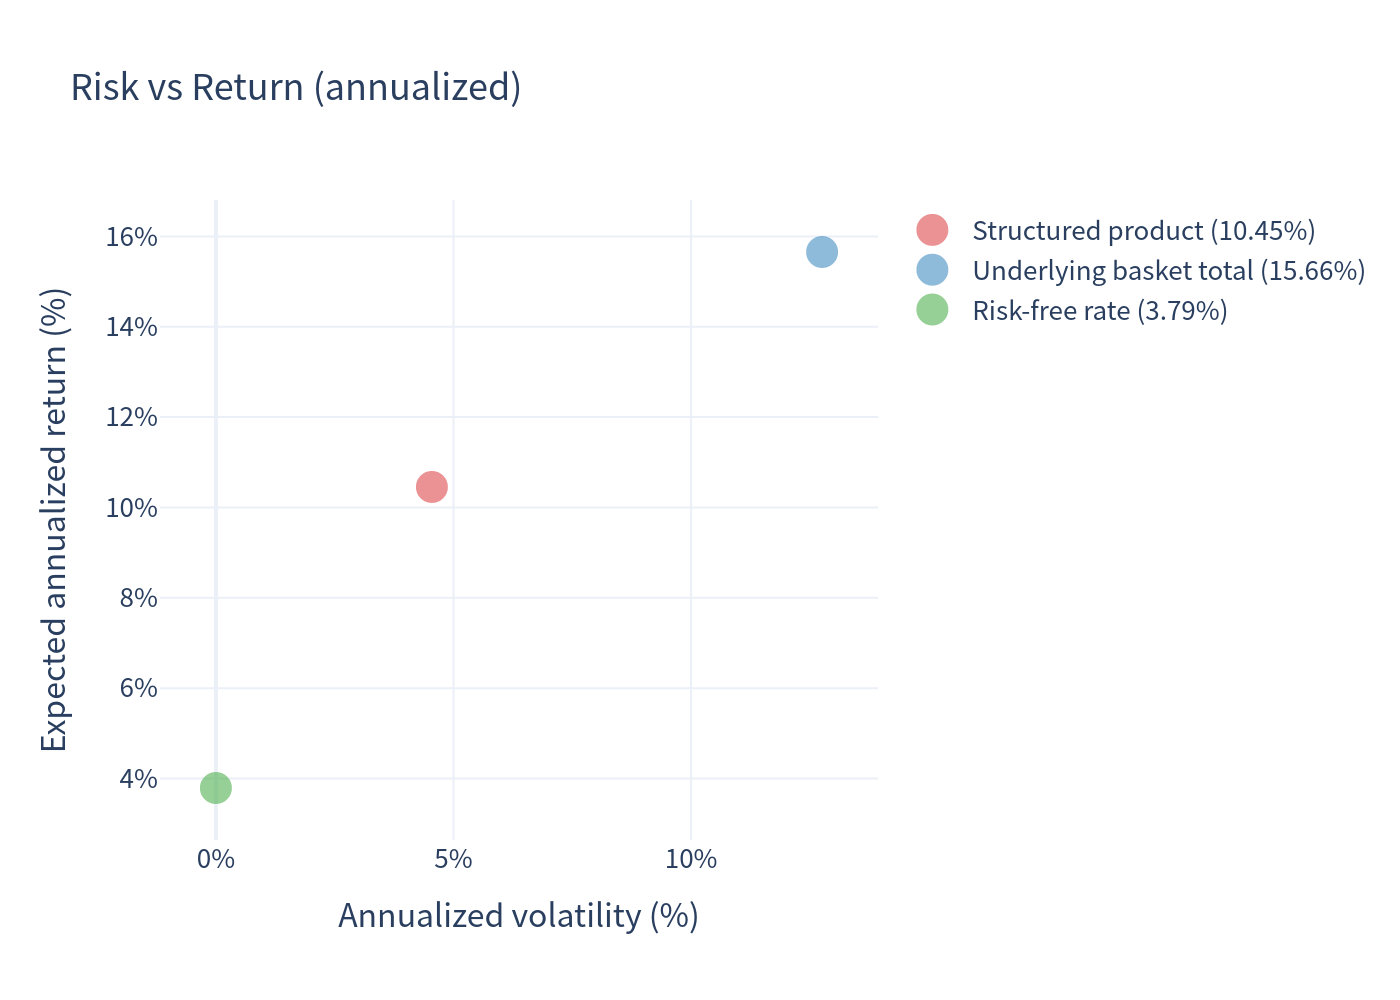
Consistent with the histogram evidence, the product delivers a materially lower volatility for a somewhat lower expected return than the underlying.
4.5 Annualized-return box plot
4.6 Holding-period and coupon distributions
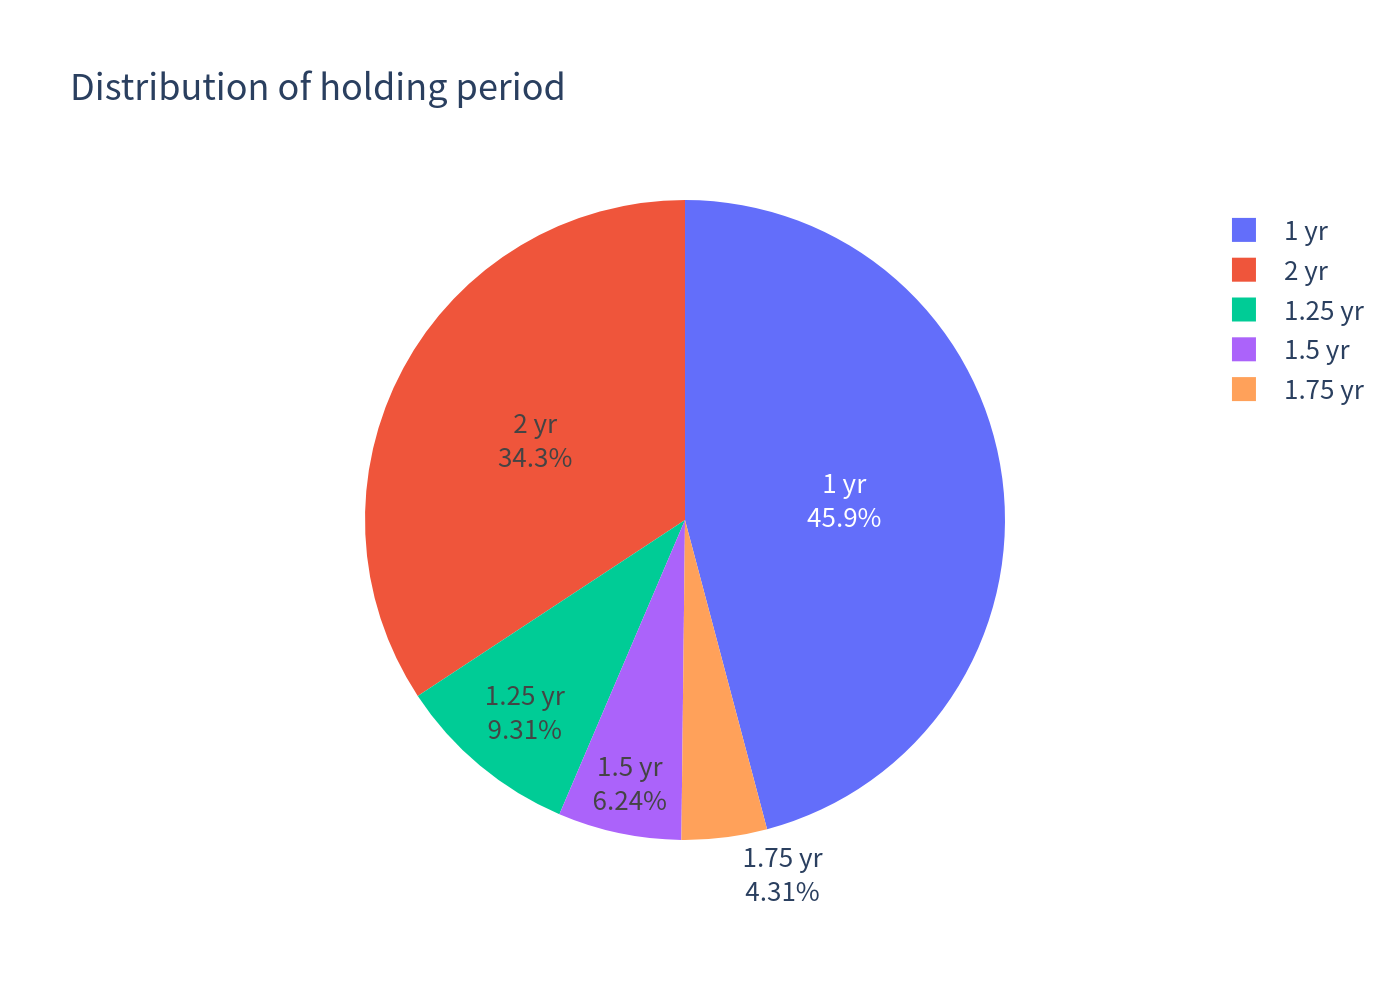
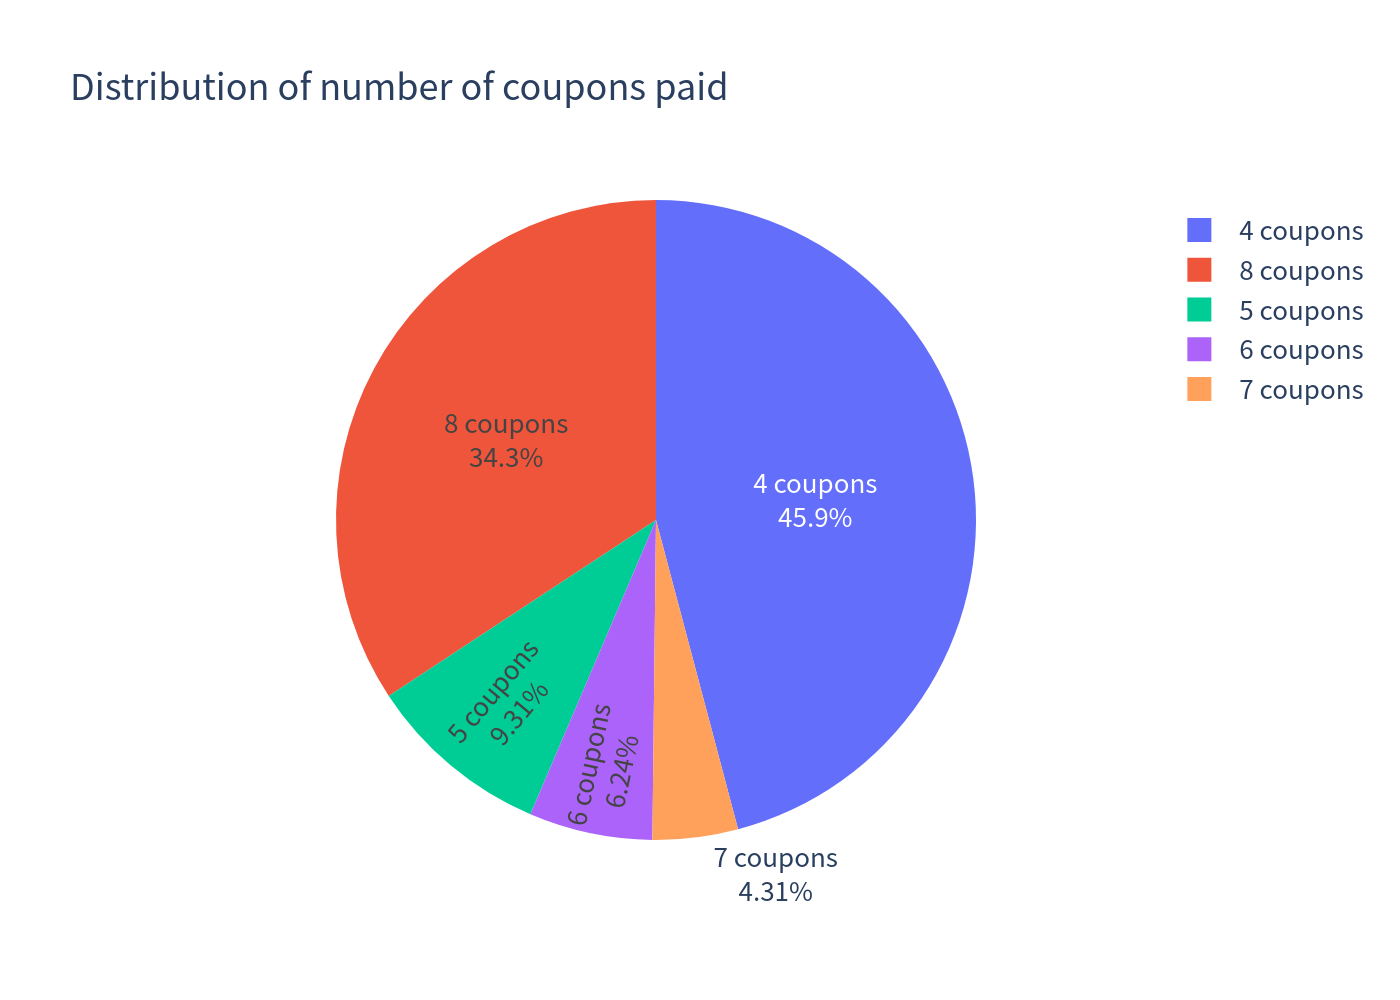
Because the product is issuer-callable, it is frequently redeemed before maturity (~66% of paths), so the realised holding period and coupon count vary:
Coupons paid
5. Investment Commentary
Observations from the simulation
- High, unconditional coupon. A flat 12.00% p.a. is paid in every scenario until redemption — the coupon does not depend on the shares and is not contingent on the barrier. This is the dominant driver of the ~10.5% p.a. expected return.
- Downside is tail-driven but capped in scope. The barrier sits at 69%, i.e. ~31% below the start. A Barrier Event occurred in only ~8.6% of paths, and losses beyond that are mild in the average case (99% VaR of –9.12% for the product vs –10.55% for the underlying). The worst simulated outcomes still show meaningful capital loss, as the worst share is delivered below par.
- Strongly lower volatility. Product volatility (4.55%) is about a third of the underlying basket's (12.76%), reflecting the short-put structure: most of the time the product simply returns par plus coupon.
- Early redemption caps the compounding. The average holding period is only ~17.2 months because the issuer calls roughly two-thirds of the paths at or above par. Investors therefore re-invest principal sooner and the realised total return (+14.54%) is lower than a “held-to-maturity” 24% would suggest.
- Upside is fully surrendered. On paths where the basket rallies strongly (up to ~+49% for the underlying within the 1–99% band), the product's annualized return is pinned near its ~12% coupon — the opportunity cost of the capped payoff is clearest precisely when equities do best.
Good points worth mentioning
- Attractive, unconditional yield (12.00% p.a.) relative to the ~3.79% risk-free rate and to the Swiss shares' ~3.4% dividend yield.
- Conditional protection: capital is preserved in the large majority of paths (≈93.6% of simulations are non-negative; barrier breached in only ~8.6%).
- Diversification across three defensive, large-cap Swiss healthcare/consumer names, on a worst-of basis.
- Quanto USD removes CHF currency risk for a USD investor.
- Markedly lower return volatility than holding the shares directly.
Points to weigh
- Upside is capped at the coupon — no participation in a strong basket rally.
- A worst-of structure: the outcome is governed by the single weakest share, and losses (if the barrier is breached) are calculated on that weakest share.
- Issuer callability truncates the coupon stream in the majority of scenarios (~66%).
- Returns (and the barrier) are sensitive to the modelling drift/risk-premium assumption; the fair-value of the embedded short put is a key swing factor.
- Investors retain the issuer/guarantor credit risk.