
27.40% p.a. Callable Multi Barrier Reverse Convertible — Simulation Analysis
Headline simulation results
| Metric | Value |
|---|---|
| Expected annualized return | +23.41% |
| Expected total return over the realized holding period (mean) | +20.09% |
| Expected holding period | 10.6 months |
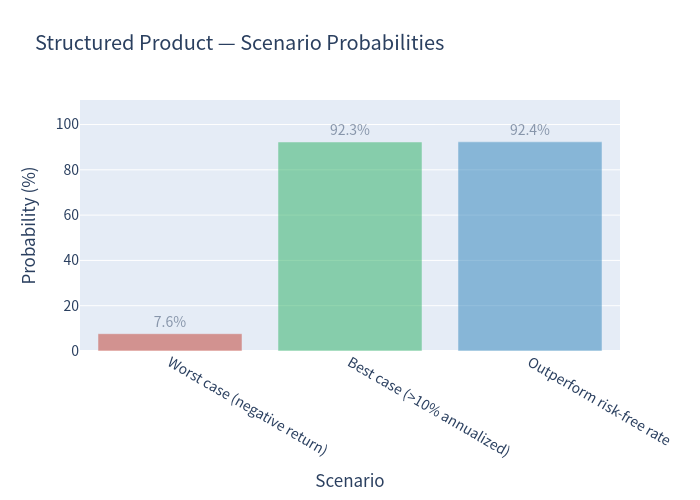
| Probability of a negative return | 7.64% |
| 99% confidence VaR (1-year) | -32.31% |
| Probability of outperforming the risk-free rate | 92.36% |
| Probability of earning more than 10% annualized | 92.28% |
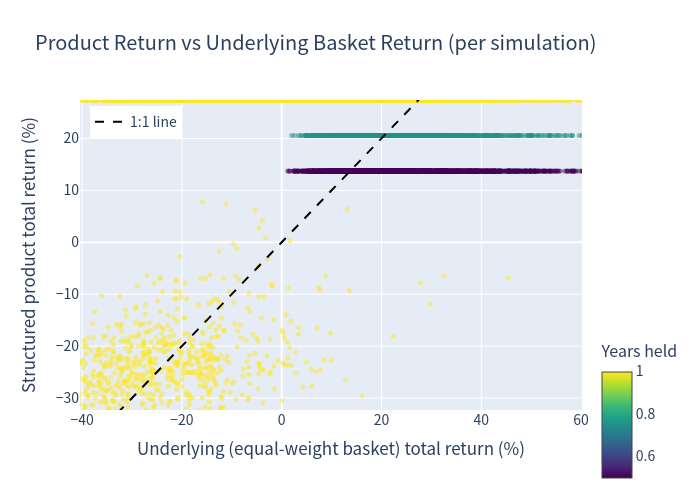
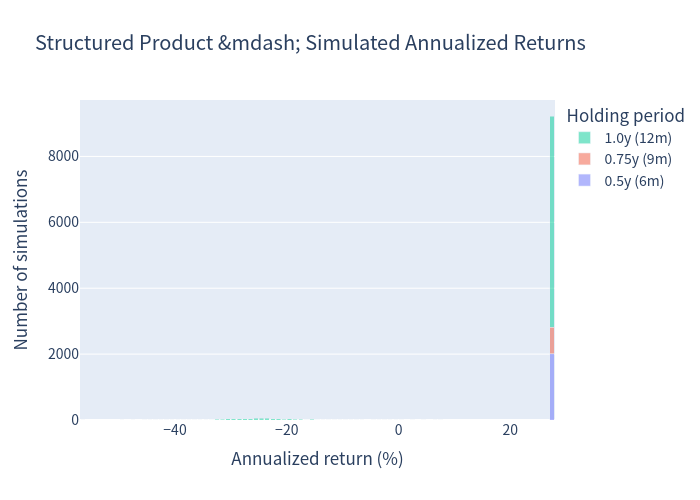
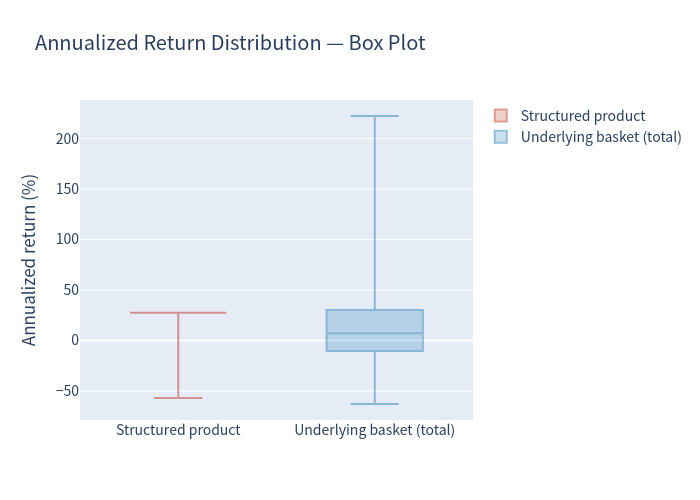
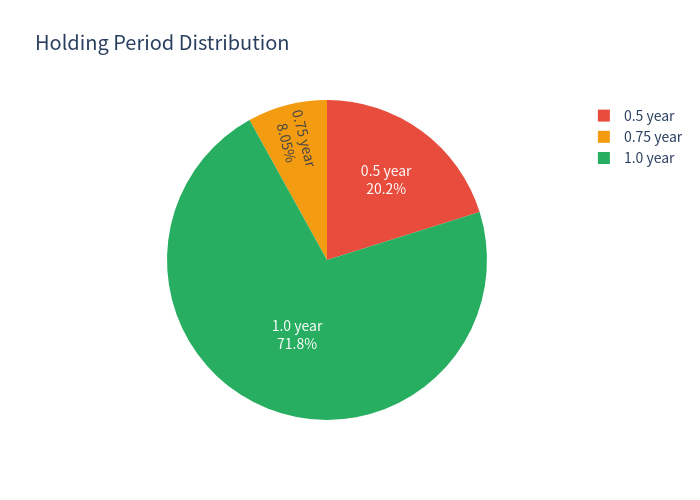
The product pays a fixed 27.40% p.a. coupon and only loses money in the tail scenario where a deep barrier is breached. In the simulation most paths (≈92%) return a full or partial coupon stream with no capital loss, while the remaining ≈8% of paths suffer an average loss of roughly -25% (and up to -57% in the worst cases). Because roughly 28% of paths are called early (short holding period), annualized figures for those paths look large — total return and holding period should be read together.
Basic product information
- Issuer: Leonteq Securities AG, Guernsey Branch (rating Fitch BBB-, stable).
- Issue price / Denomination: 100% / CHF 1,000; settlement currency CHF.
- Underlyings (worst-of, all SIX Swiss): Accelleron Industries Ltd, ams-OSRAM AG, Idorsia Ltd.
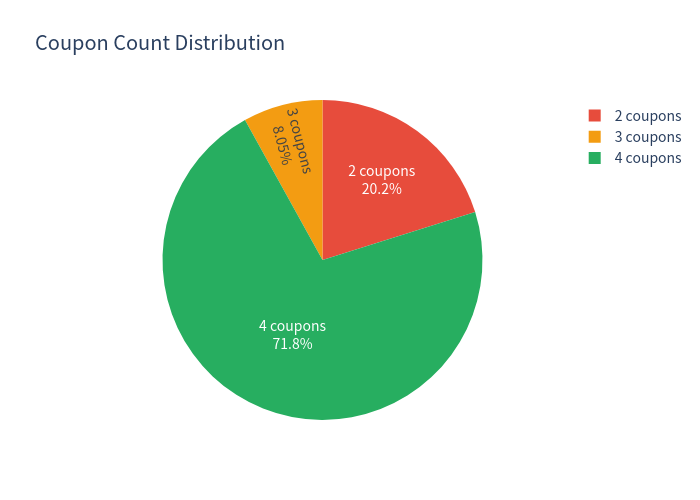
- Coupon: 27.40% p.a., paid quarterly — CHF 68.50 per CHF 1,000 (6.85 index points) on 24/12/2026, 24/03/2027, 24/06/2027 and 23/09/2027, paid in any case until the product ends.
- Barrier: 49.00% of each starting level, continuously observed (18/09/2026 – 17/09/2027).
- Strike: 100.00%. Upside is capped — redemption is at par in every non-loss scenario.
- Issuer call (callable): the Issuer may redeem early on the observation dates 17/03/2027 and 17/06/2027 (payment 24/03/2027 and 24/06/2027); if called you receive par plus that quarter's coupon and nothing further.
- Tenor: ≈ 12 months (Final Fixing 17/09/2027, Redemption 23/09/2027).
How it works (plain language)
You collect a very high fixed coupon in exchange for agreeing to "take the downside" of the worst-performing of three shares:
- No barrier event (none of the three shares ever trades at or below 49% of its start): you get your CHF 1,000 back at maturity plus all four coupons. This is the base case.
- Barrier event AND the worst share finishes below its start: you are effectively repaid with the worst share's performance — i.e. you suffer that share's decline (a capital loss).
- Barrier event BUT the worst share finishes at or above its start: you still get par.
- Coupons are paid regardless of performance, right up to the date the product ends.
- Early call: the Issuer can end the product early on either quarterly call date — you then receive par plus the current coupon and no more.
Key statistics (simulated)
| Expected annualized return | Expected annualized volatility | Probability of loss | 99% VaR (1 yr) | |
|---|---|---|---|---|
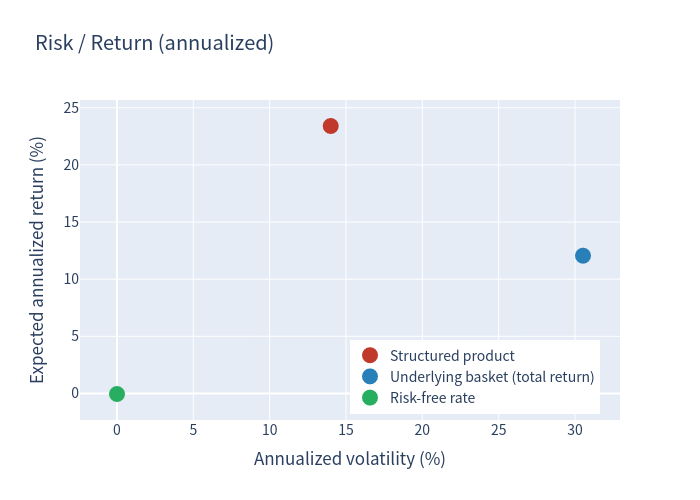
| Structured product | 23.41% | 14.00% | 7.64% | -32.31% |
| Underlying (equal-weight basket, total return) | 12.05% | 30.52% | 41.20% | -39.72% |
| Risk-free rate (CHF short-term) | ≈ 0.00% | — | — | — |
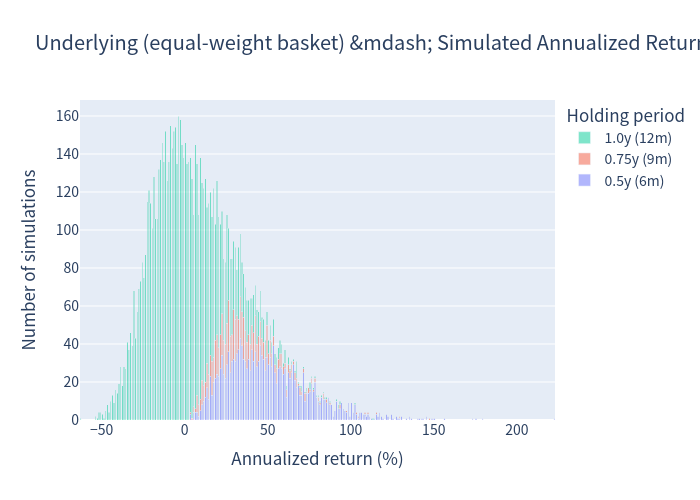
Note: the underlying's expected annualized return is lifted by the annualization of the shorter (early-called) holding periods; measured over the actual holding period the basket's mean total return is about +5.66%, versus +20.09% for the product.
Charts
Simulation outcomes — product vs underlying
Product return vs underlying basket return
Simulated annualized returns — underlying basket (stacked by holding period)
Underlying annualized return histogram
Simulated annualized returns — structured product (stacked by holding period)
Product annualized return histogram
Scenario probabilities
Scenario probabilities
Risk / return
Risk return scatter
Annualized return distribution
Box plot
Holding-period and coupon-count distribution
Holding period pie
Coupon count pie
Investment commentary
Strengths
- High headline yield: a 27.40% p.a. coupon is attractive versus CHF deposit rates (≈0%).
- Deep barrier (49%): the protection level is very far from the starting levels, so the barrier is only breached in a minority of simulated paths (~8%).
- Coupons are paid regardless of performance (until the product ends), so income is not conditional on the shares rising.
- Conditional protection: even if the barrier is breached, losses only crystallise if the worst share also finishes below its starting level; a rebound back to/above the strike returns par.
- Short tenor (~1 year) limits the time over which the barrier can be breached.
Risks / drawbacks
- Capped upside: you never participate in the shares' gains — the maximum return is the coupon stream.
- Worst-of exposure: the payoff is driven by the single worst of three high-volatility shares (recent realized volatilities are elevated), so diversification is limited.
- Rare but severe losses: losses are infrequent but large — the average loss-making path loses ≈25% and the 99% VaR is about -32% (worst observed ≈-57%). The deep barrier makes the outcome distribution "barbell-shaped".
- Issuer early call: in strong markets the product is likely to be called, capping your return at par + accrued coupon and forcing reinvestment risk.
- Continuous barrier observation: the 49% level is monitored at any time, not just at quarter-ends.
- Issuer credit risk: repayment depends on Leonteq Securities AG.
This analysis is a quantitative simulation of the product's contractual payoff and is not investment advice or a suitability assessment.