
Buffered Jump Securities with Auto-Callable Feature — Simulation & Risk Analysis
How it works (layman's explanation)
- You invest $1,000 and receive no regular interest.
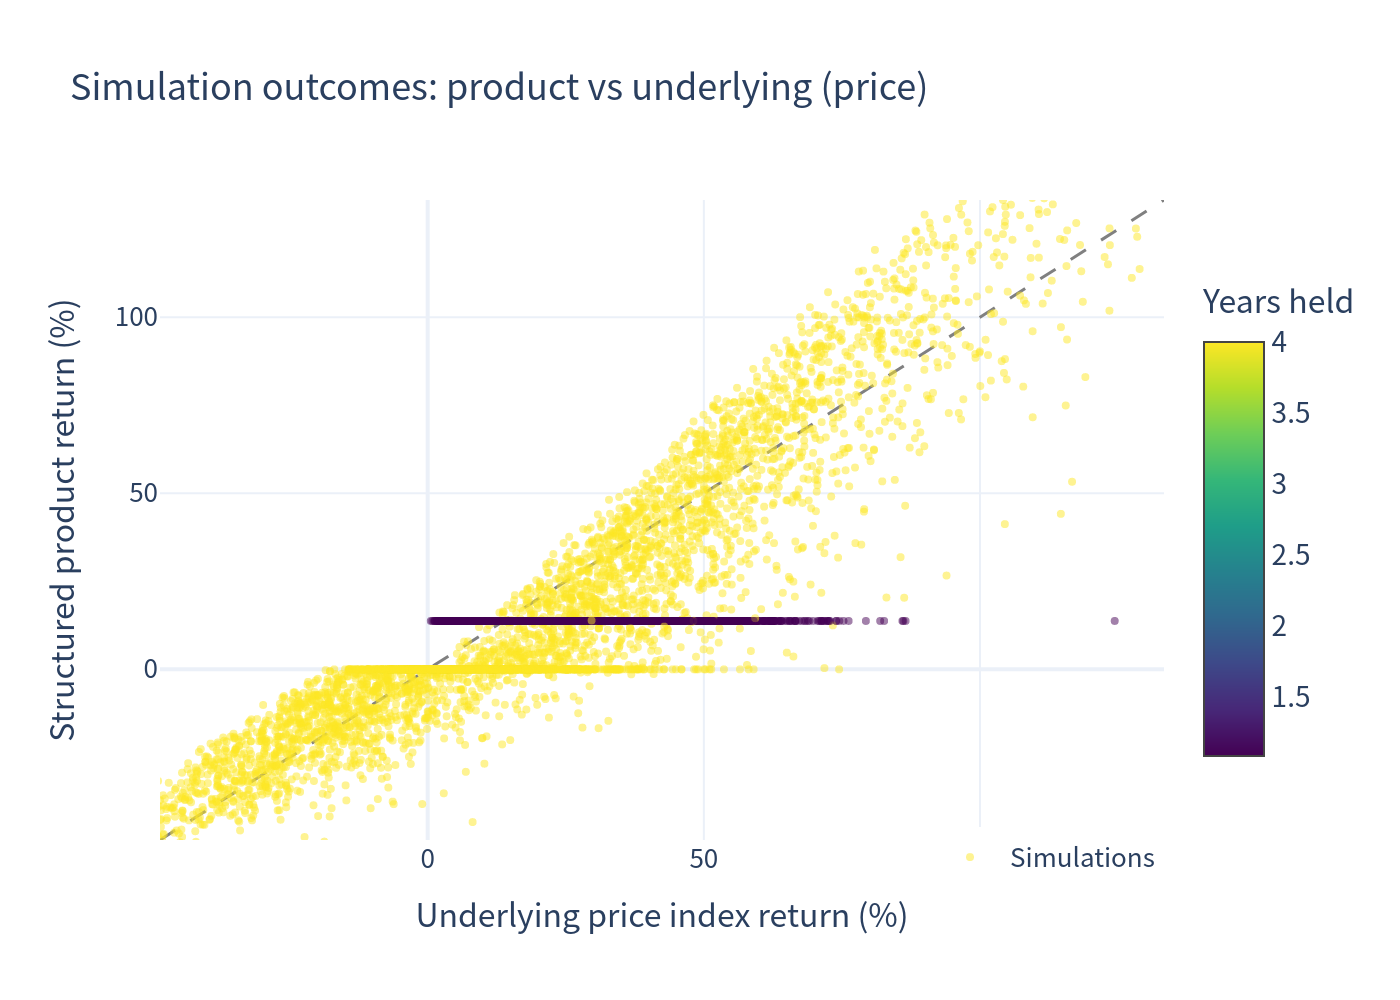
- After about 1 year, if all three market indices (Nasdaq-100 Tech Sector, Russell 2000, S&P 500) are at or above their starting levels, the note is automatically called and you receive about $1,137.50 (≈ +13.75%) — the product ends there.
- If the note is not called, you stay invested to maturity (4 years), where:
- If all three indices finish above their starting levels, you earn 150% participation on the gain of the worst-performing index (uncapped).
- If none of the indices falls more than 20% below its start, you get your $1,000 back (principal protected by the 20% buffer).
- If any index falls more than 20%, you lose 1% of principal for each 1% decline of the worst index beyond the 20% buffer (losses are cushioned by the buffer, with a minimum payment of 20% of principal).
- Because the payoff depends on the worst performer, a large decline in a single index hurts the result even if the others do well.
| Statistic (annualized) | Structured Product | Underlying Benchmark (equal-weight basket) |
|---|---|---|
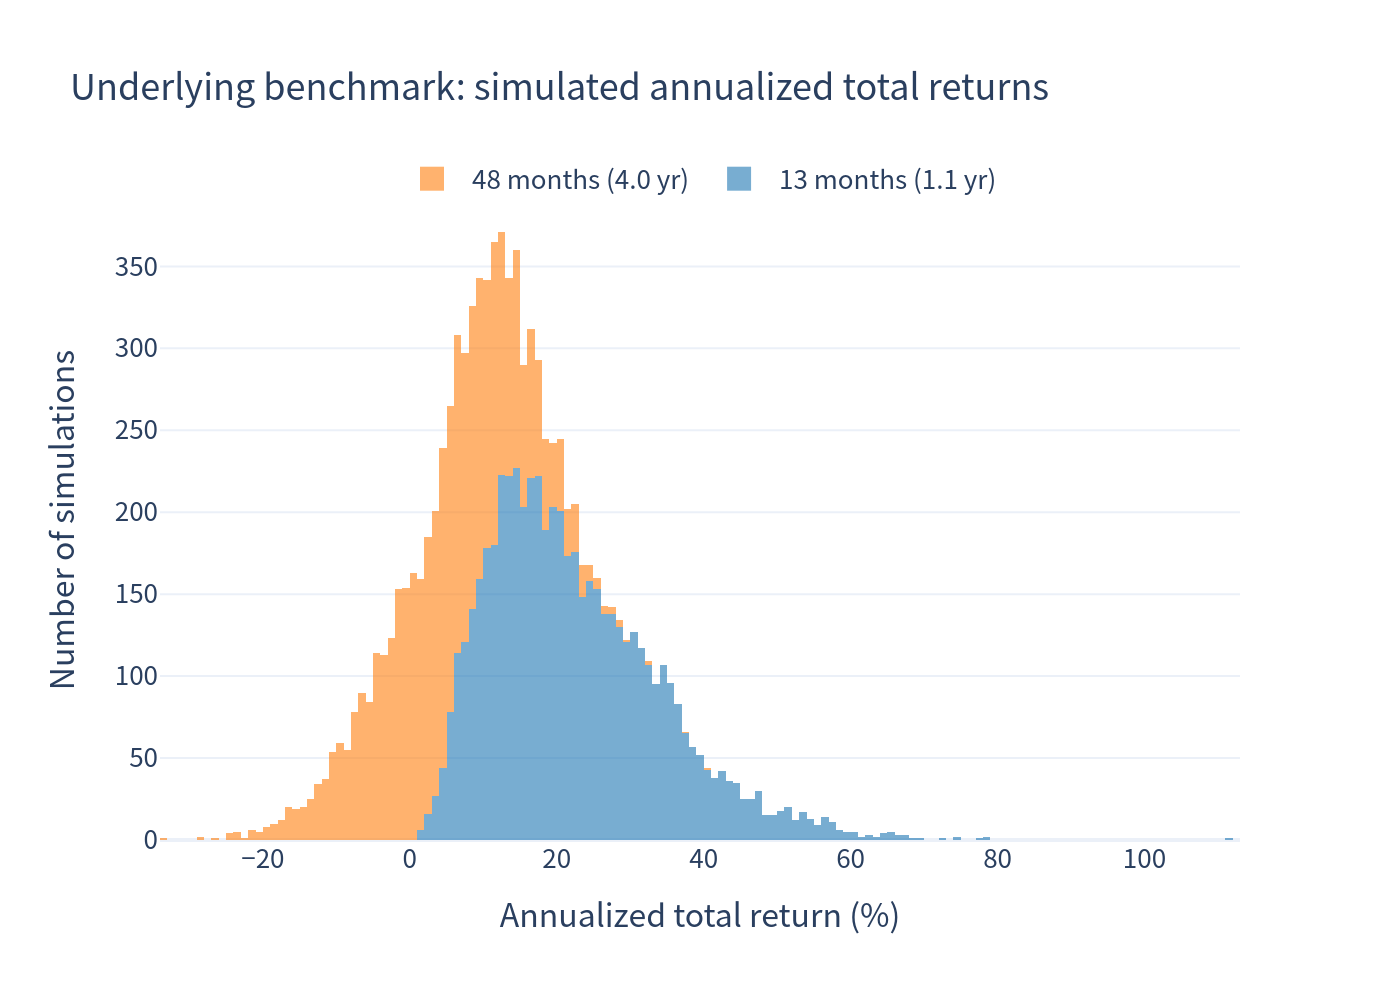
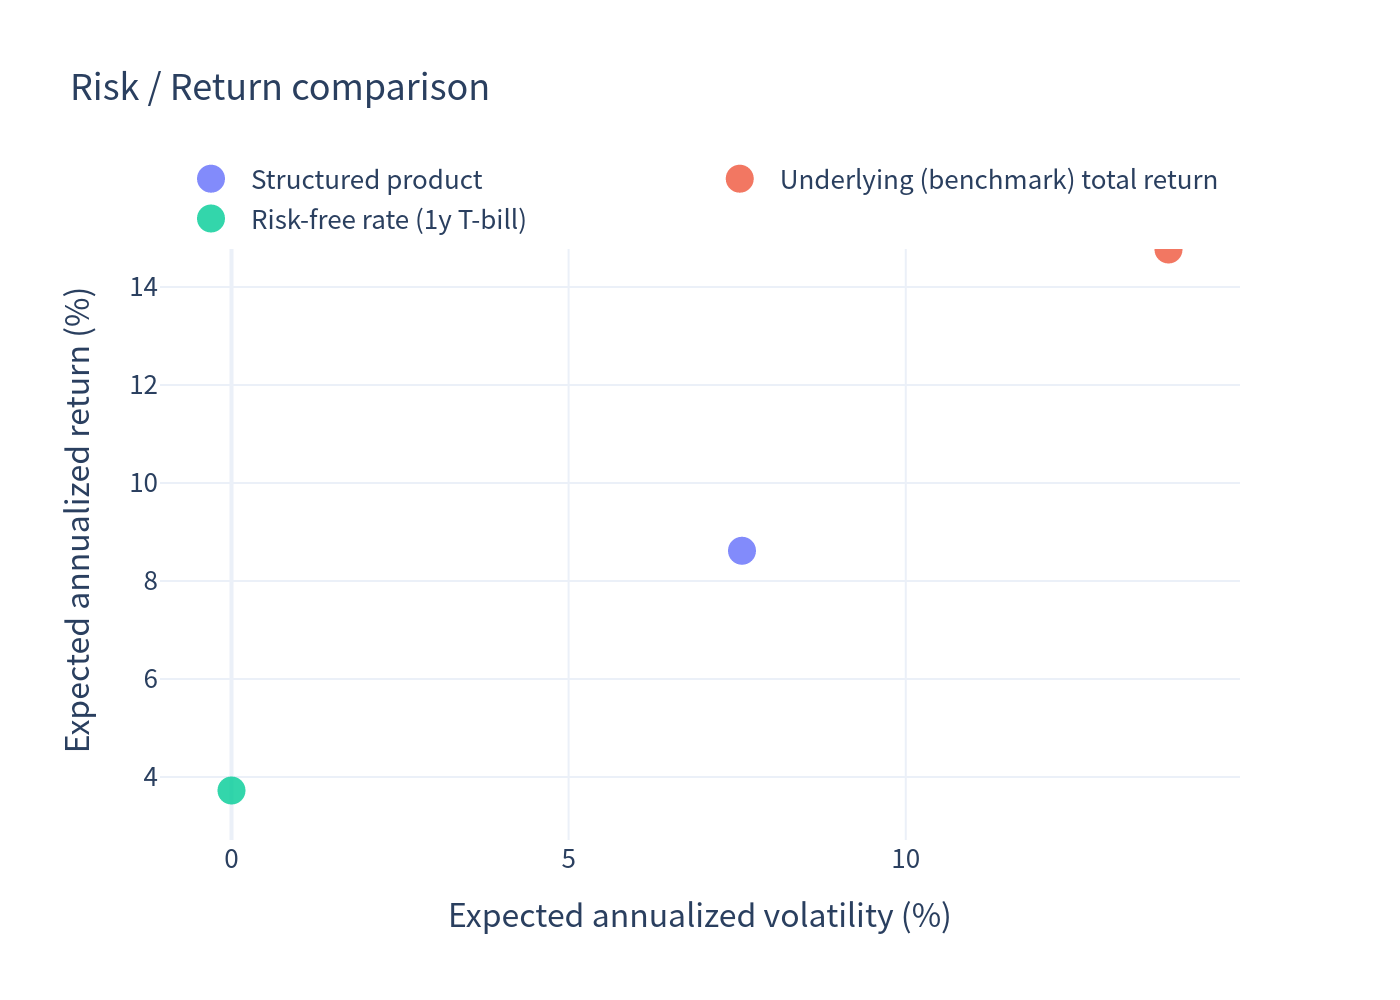
| Expected annualized return | 8.62% | 14.76% |
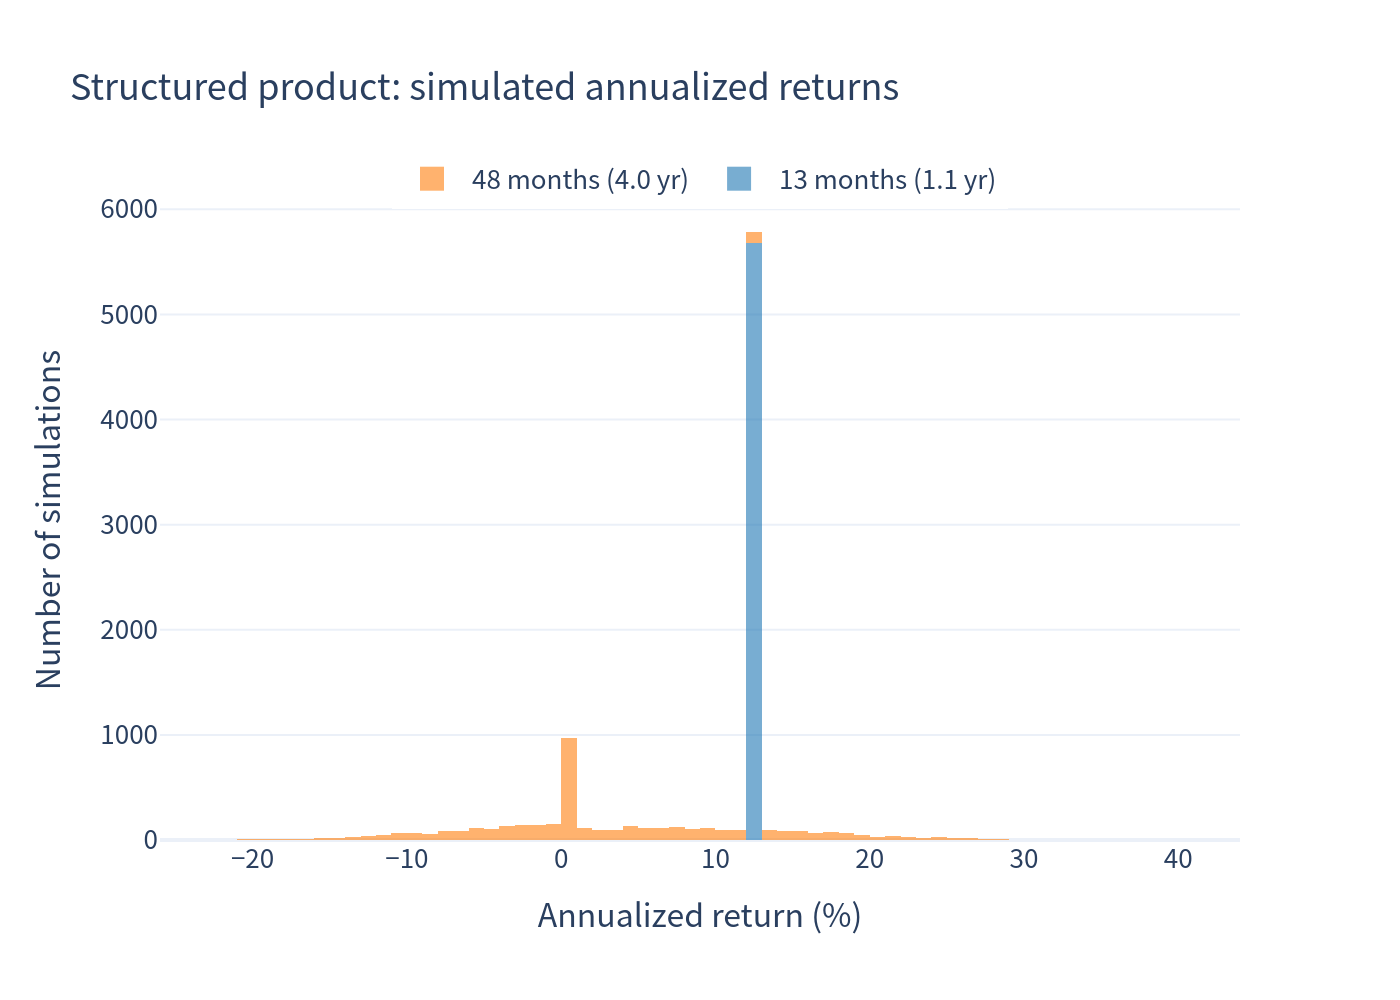
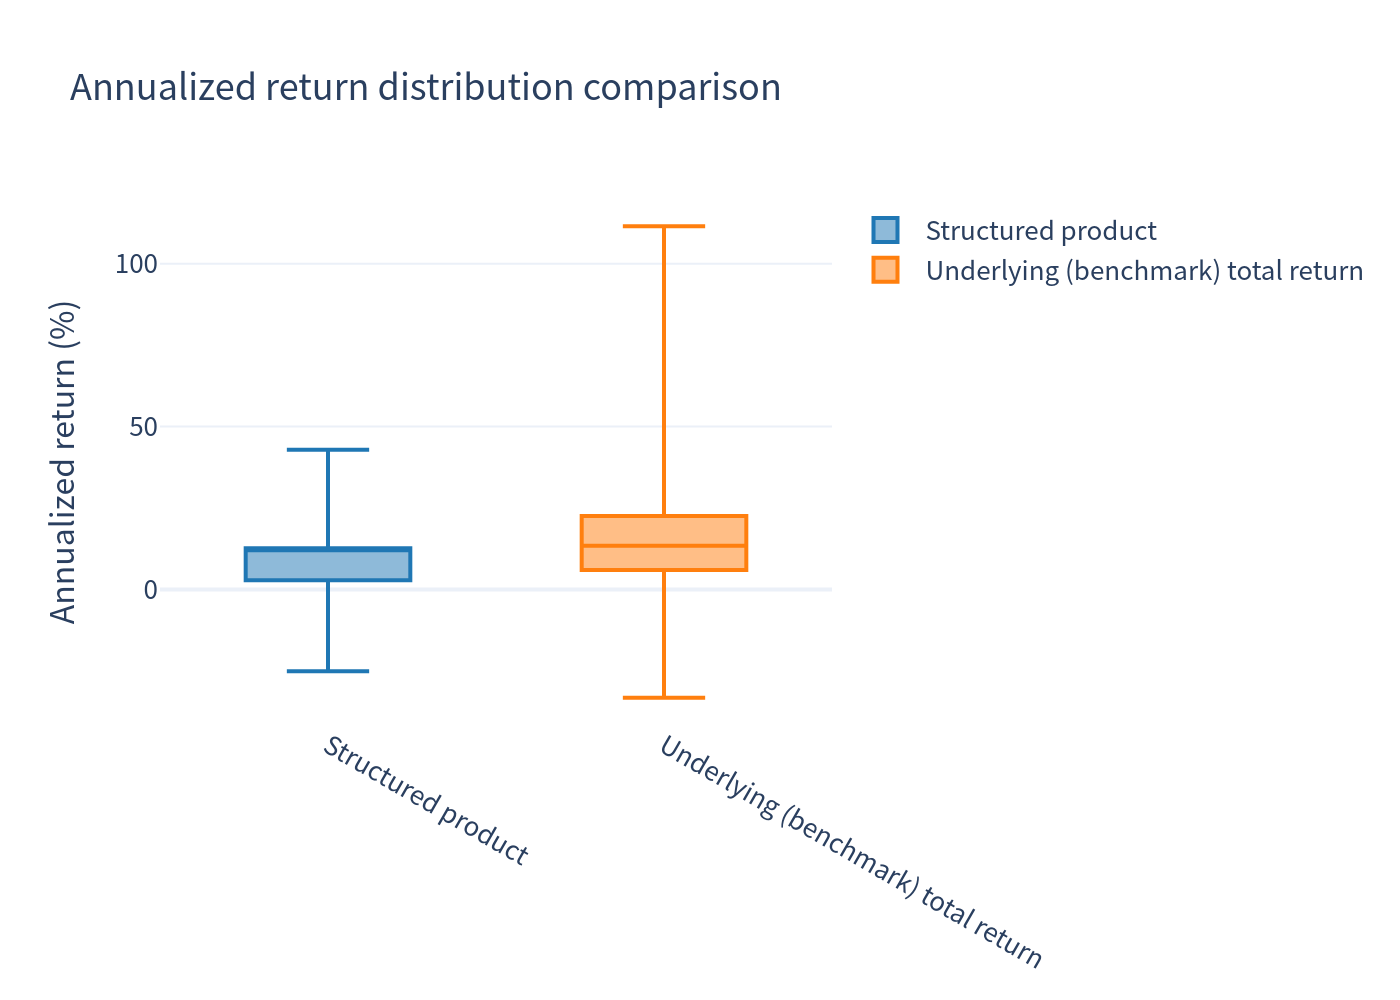
| Median annualized return | 12.63% | 13.45% |
| Expected annualized volatility | 7.57% | 13.90% |
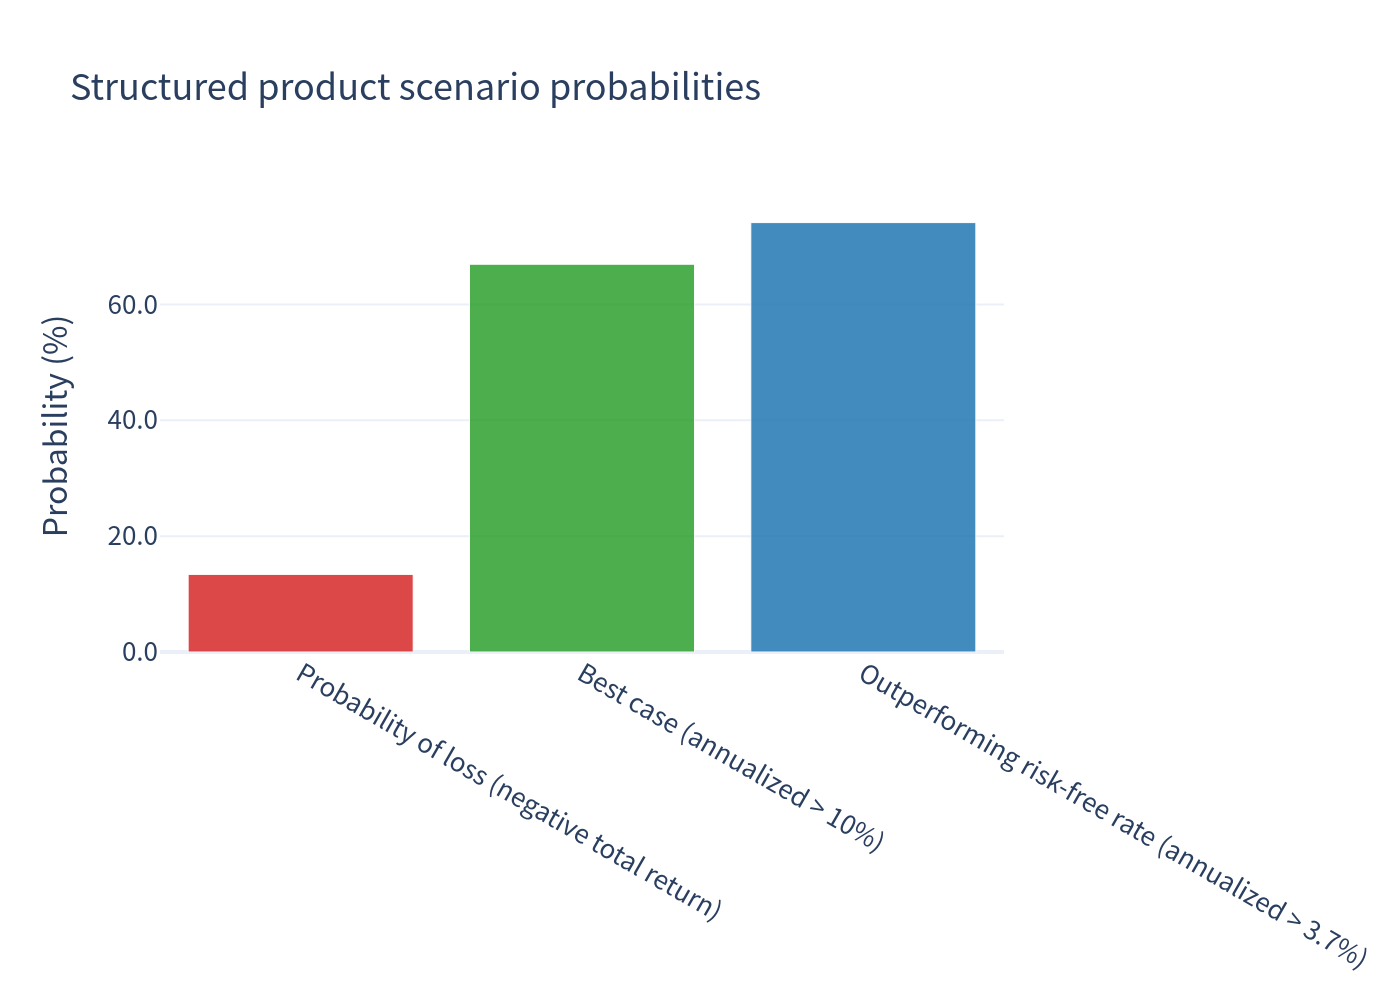
| Probability of negative total return | 13.40% | 13.93% |
| 99% confidence 1-year VaR | -13.03% | -14.64% |
Holding-period perspective
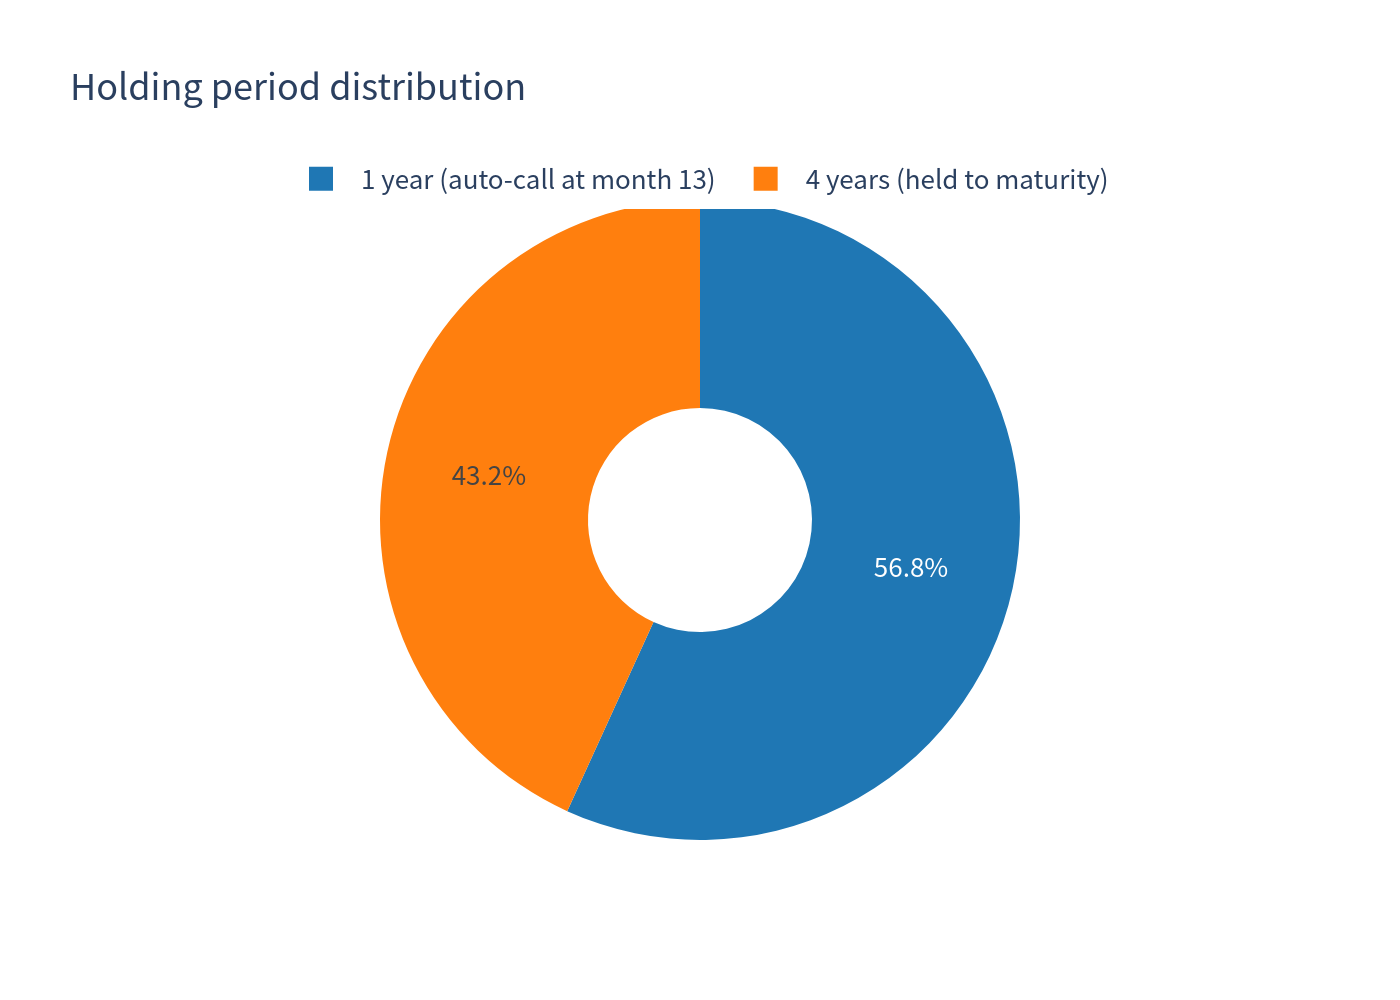
The expected total return over the realized holding period is 16.26% (mean of per-scenario total returns). Roughly 56.81% of scenarios end after ~1 year at the +13.75% call payment, and 43.19% run to 4-year maturity. For maturity-only scenarios the mean annualized return is ~3.34% with a loss probability of ~31%. Because the auto-called bucket locks in a ~12.6% annualized result, the pooled annualized statistics above should be read together with the expected holding period of ~2.34 years.
3.1 Simulation outcomes: structured product vs underlying (price)
Scatter of simulated final prices — structured product versus the equal-weight underlying basket.
3.2 Structured product — annualized return distribution
Distribution of annualized returns for the structured product across simulated scenarios.
3.3 Underlying benchmark — annualized total return distribution
Distribution of annualized total returns for the equal-weight underlying basket.
3.4 Scenario probabilities
Probability of each terminal scenario (auto-call, maturity with buffer, maturity with loss, etc.).
3.5 Risk / Return comparison
Annualized risk versus return positioning of the structured product and its underlying benchmark.
3.6 Annualized return box-plot comparison
Box-plot comparison of annualized returns — structured product versus underlying benchmark.
3.7 Holding-period distribution
Share of scenarios by realized holding period (auto-call at ~1 year versus maturity at 4 years).
Highlights worth noting
- 20% buffer cushion: a decline of up to 20% in the worst index at maturity is absorbed; below that, losses are 1-for-1 beyond the buffer (downside is cushioned, never full participation in the worst loss until very severe declines).
- Attractive early call: in ~57% of simulated scenarios the note is redeemed after ~1 year with a fixed +13.75% gain, a high probability outcome.
- Uncapped upside: if held to maturity and all indices finish above their start, the note pays 150% of the worst index's gain — leverage on the lagging index, with no cap.
- Reduced volatility profile: the simulated annualized volatility (~7.6%) is roughly half that of the underlying basket (~13.9%), reflecting the buffered, capital-at-risk structure, with a lower 99% VaR magnitude than the direct basket holding.
- No currency risk for USD investors (no quanto features).