
Morgan Stanley MSAMP5 Step-Up Jump Notes with Auto-Callable Feature
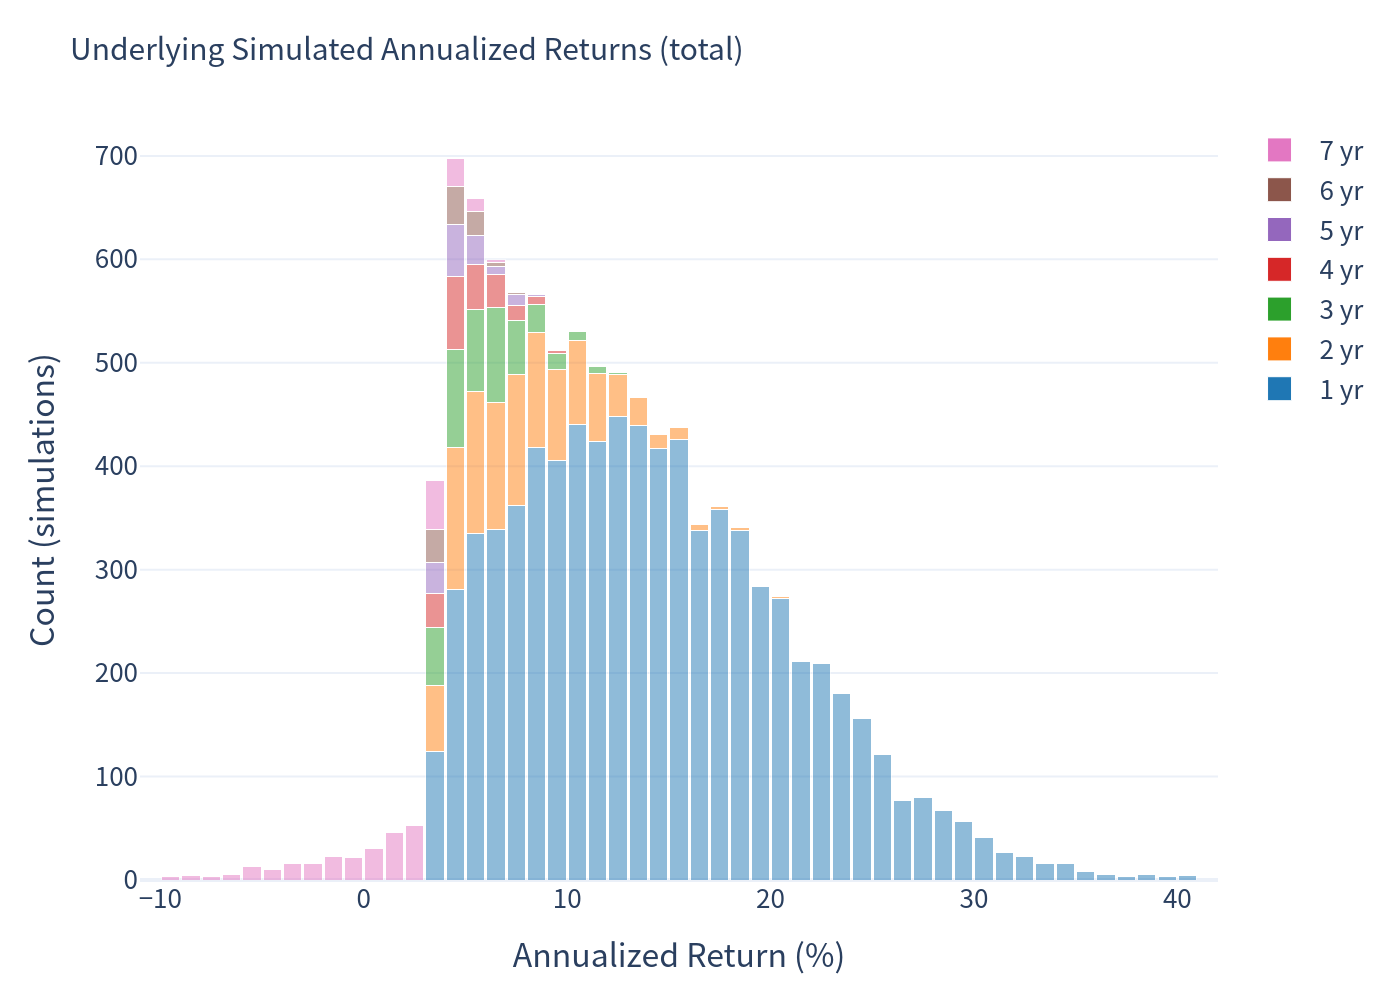
All figures are simulation-based. Underlying proxy: a broad multi-asset allocation benchmark (iShares Core Growth Allocation ETF, AOR), used because the linked Morgan Stanley Amplitude Index is a proprietary, newly launched multi-asset index with no public price history.
1. Headline Simulation Results
| Metric | Result |
|---|---|
| Expected annualized return | 15.13% |
| Probability of a negative return | 0.00% (principal protected) |
| 99% confidence 1-year VaR | 0.00% |
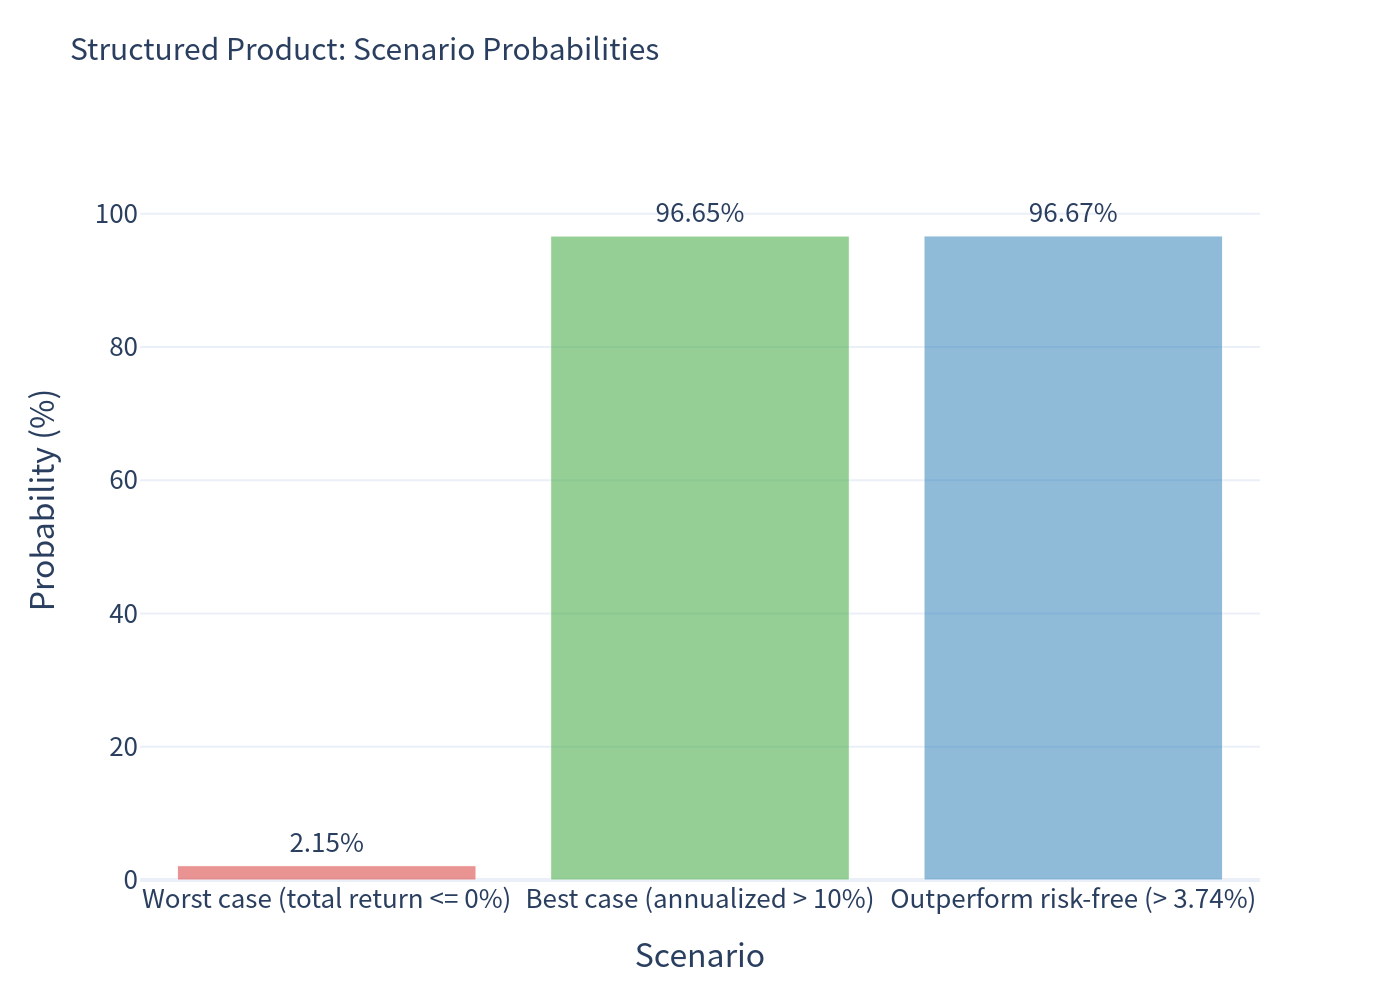
| Probability of automatic early redemption | 96.65% |
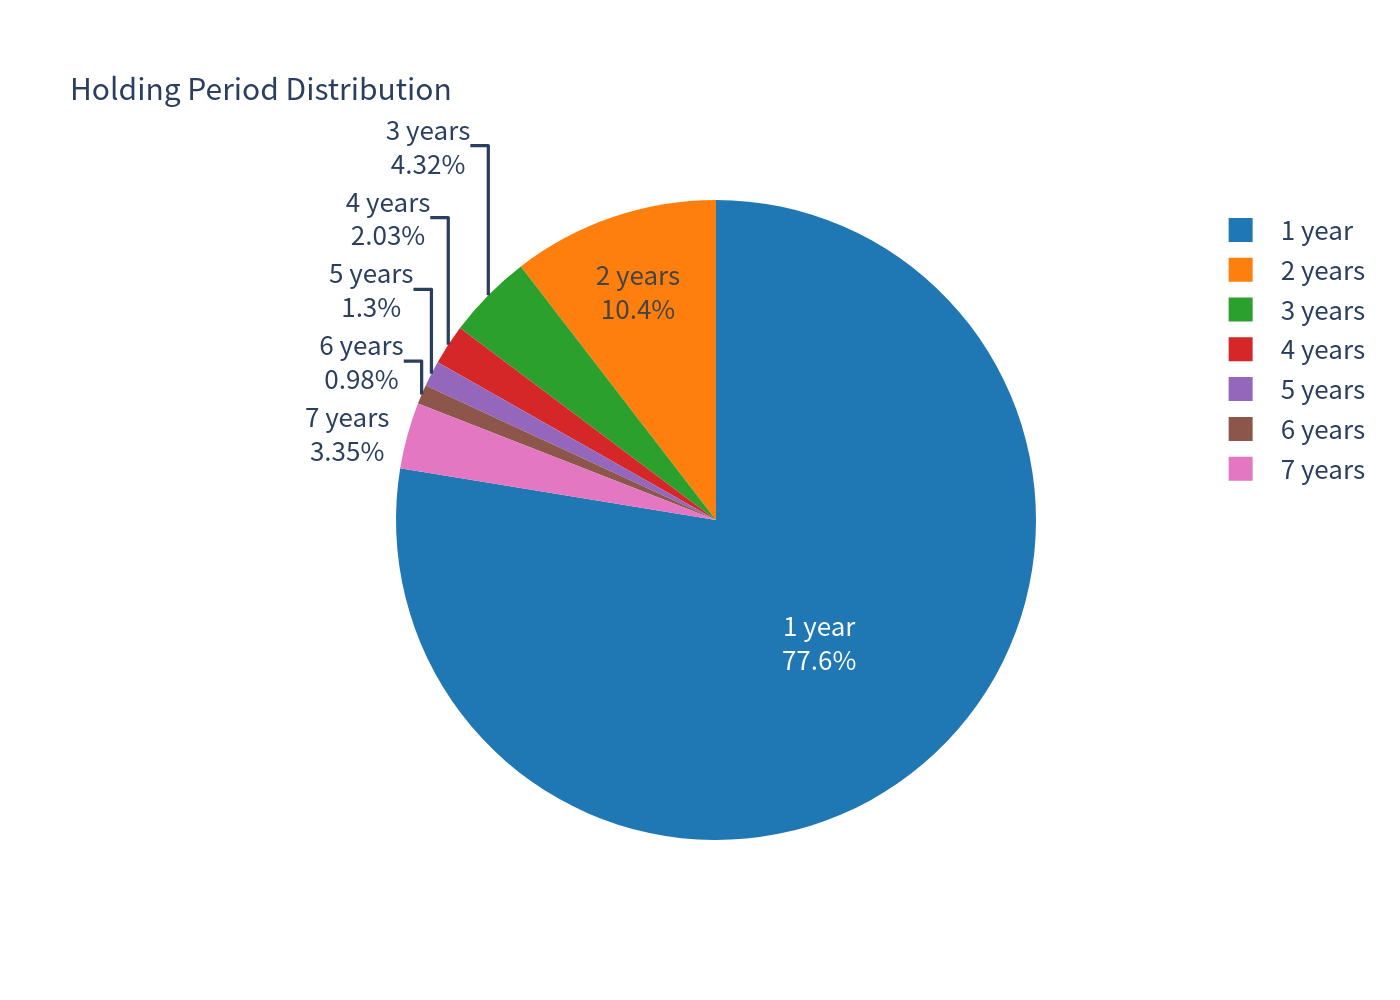
| Expected holding period | ~1.55 years (median 1.0 year) |
| Expected total return over holding period | 21.22% |
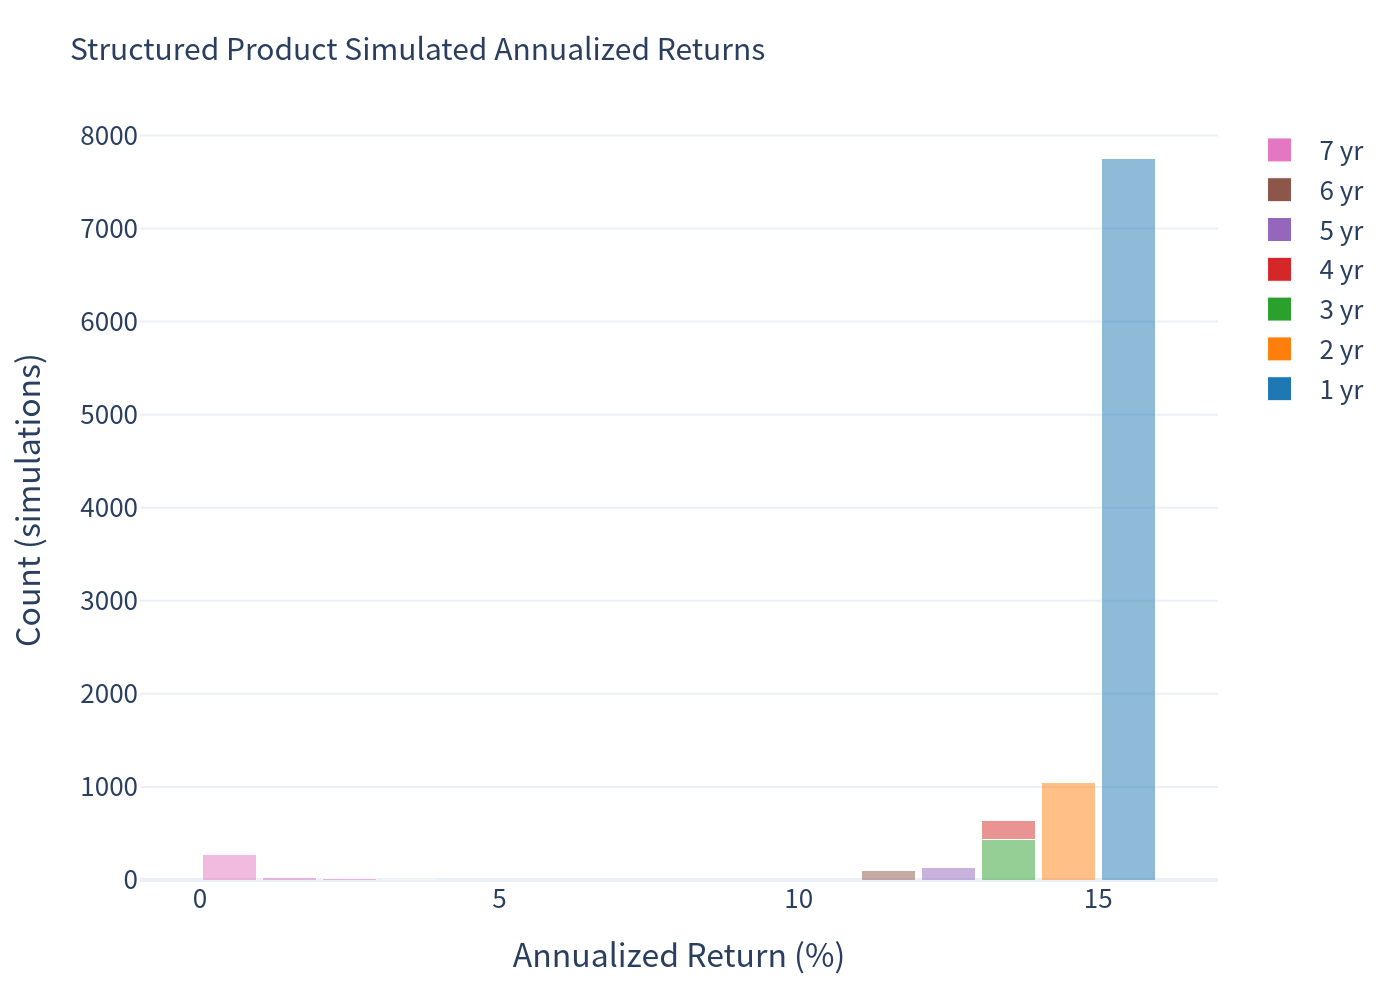
The note is fully principal-protected at maturity, and it auto-calls very early with high probability (77.58% of paths at the first determination date alone). As a result the downside is essentially eliminated in the hold-to-maturity/auto-call analysis, and the central outcome is a step-up redemption at a strong annualized rate.
2. Basic Product Information & How It Works
- Issuer / Guarantor: Morgan Stanley Finance LLC / Morgan Stanley.
- Underlier: Morgan Stanley Amplitude Index — a proprietary multi-asset, momentum-based, volatility-targeted index (inception January 2026).
- Denomination: $1,000 per note, USD.
- Coupon: None (the notes do not pay interest).
- Upside cap: None at maturity (1:1 participation); the early-redemption amount is a fixed step-up.
- Protection: Full principal protection at maturity (no barrier / knock-in).
In plain terms
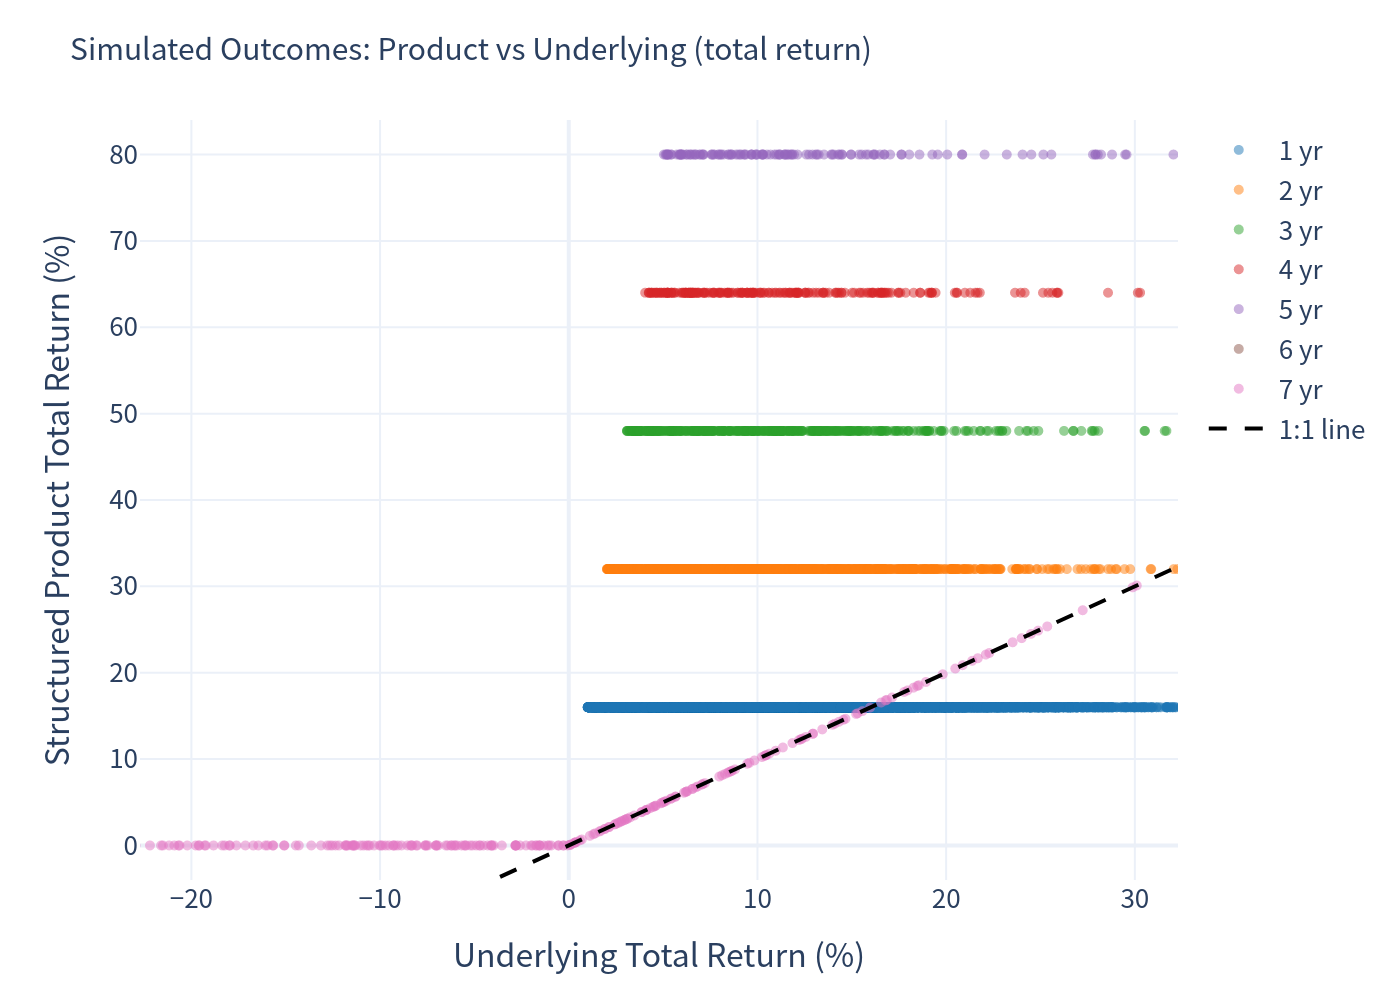
You hold a note that, if the index is at or above a slowly rising trigger level on any one of six annual look-back dates, is redeemed early for a fixed step-up amount equal to roughly a 16%-per-annum total return (e.g., $1,160 after year 1, $1,320 after year 2, … up to $1,960 after year 6). If it is never redeemed early, then at the end of year 7 you receive your $1,000 back plus the index's full percentage gain (no cap) if the index is up, or simply your $1,000 back if the index is flat or down. In other words, the investor swaps away the index's dividends and the very large early-year rallies (which are replaced by a fixed 16%/yr step-up) in exchange for full downside protection and uncapped upside at maturity.
3. Key Statistics
| Metric | Structured Product | Benchmark (total return) |
|---|---|---|
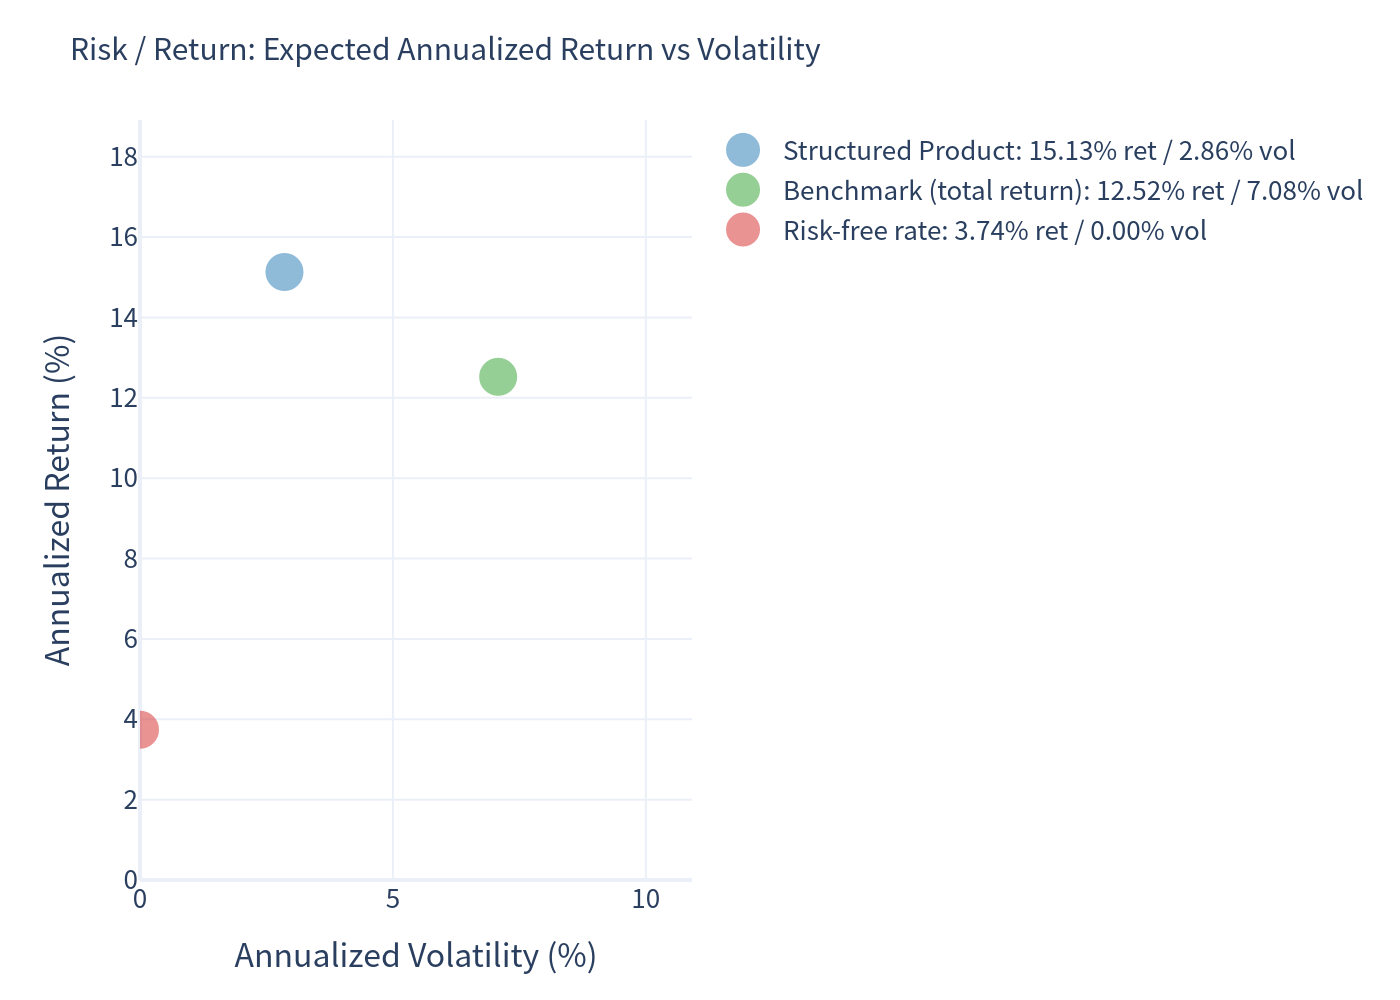
| Expected annualized return | 15.13% | 12.52% |
| Expected annualized volatility | 2.86% | 7.08% |
| Probability of loss | 0.00% | 1.15% |
| 99% confidence VaR (1 year) | 0.00% | -0.65% |
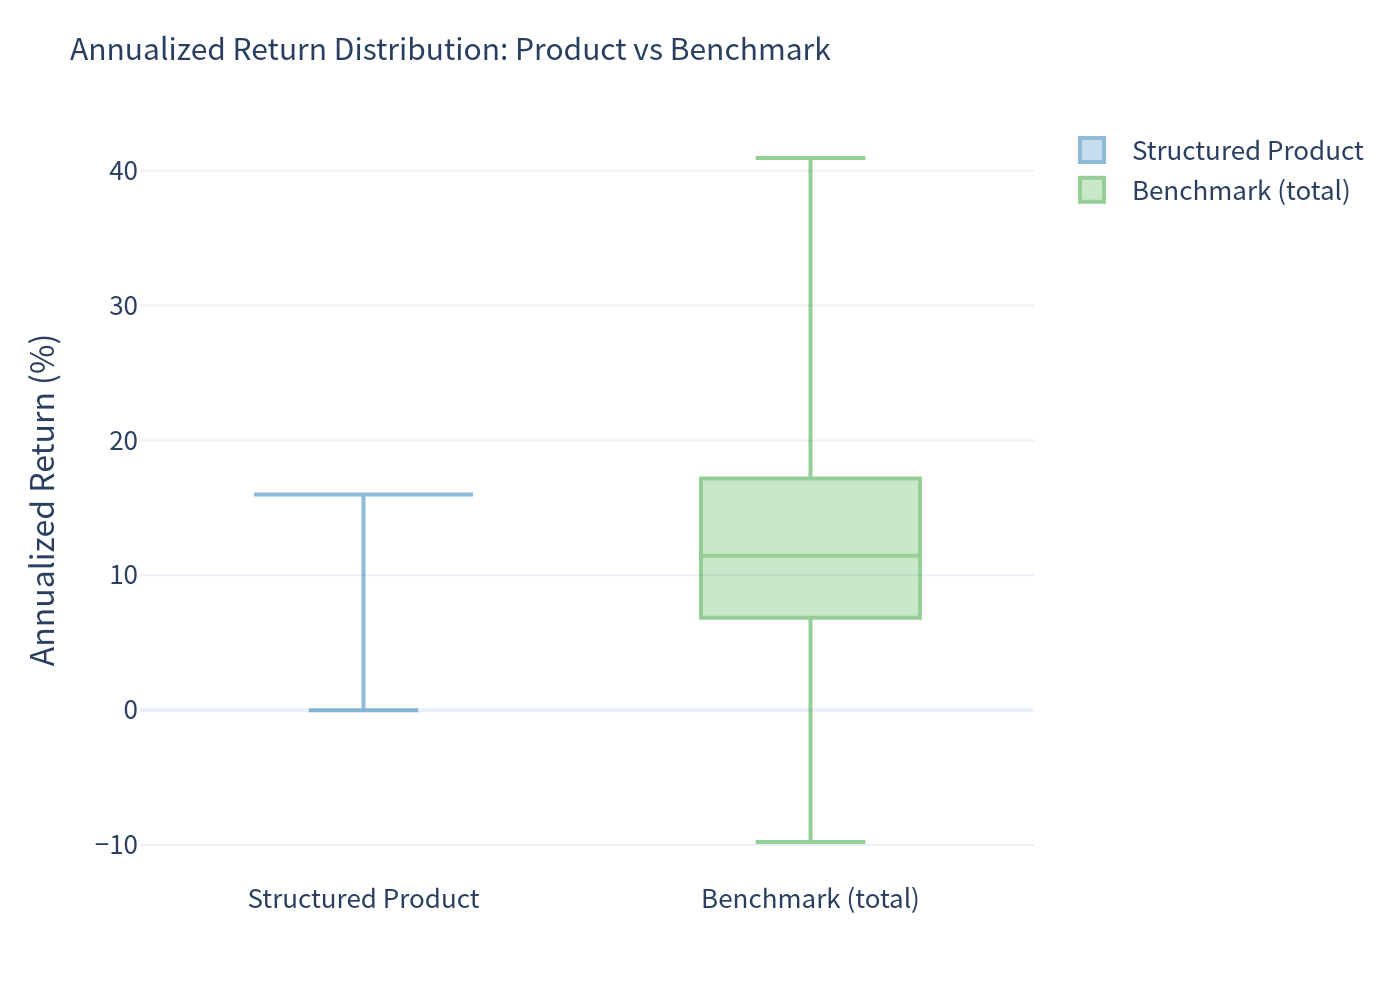
The structured product delivers a higher expected annualized return with materially lower return volatility and no simulated losses, versus the diversified benchmark. The trade-off is that outcomes are concentrated in a narrow band (see the distribution and box-plot charts) and the upside in a strong equity market is capped by the step-up in early years.
4. Charts
4.1 Simulated outcomes — product vs underlying
Each point is one simulation; colour = years held. Points lie on or above the principal-protection floor (0% return).
4.2 Underlying simulated annualized returns
4.3 Structured product simulated annualized returns
4.4 Scenario probabilities
4.5 Risk / return profile
4.6 Annualized return box plot
4.7 Holding-period distribution
5. Investment Commentary
Points in favour
- Capital protection: The most likely unfavourable outcome is simply the return of principal; simulated losses are zero.
- High-probability, high step-up: Automatic early redemption occurs in ~96.7% of simulations, most often after the first year, locking in a ~16% annualised outcome.
- Uncapped upside if held: If the note survives to maturity, the investor keeps 1:1 index upside with no cap.
Considerations
- Upside is capped when it matters most: In a strong early rally the note is redeemed at the fixed step-up, so the investor forgoes the larger index gain.
- Very short holding period: The high annualised return partly reflects that the typical hold is only ~1 year; on a total-return basis the expected payoff is ~21% over ~1.55 years. Annualised figures should be read together with the (short) holding period.
- Concentrated outcomes / reinvestment risk: Because redemption happens early and predictably, the investor faces reinvestment risk after the note is called.
- Novel, complex underlier: Performance depends on a recently launched proprietary index with embedded costs and no proven track record; an investor may not have full, continuous exposure to any single asset class.
- Issuer credit risk: All payments are subject to the creditworthiness of Morgan Stanley.
- Pricing: The note's estimated value at issuance ($876.40 per $1,000) is below par, reflecting structuring costs and the issuer's funding, and is not a secondary-market price.