
Structured Product Evaluator
info@tokenengine.ai
Structured Product Analysis
Headline Simulation Results
Based on a 10,000-path monthly Monte Carlo simulation over the product's term:
| Metric | Structured Product |
|---|---|
| Expected annualized return | 7.53% |
| Expected annualized volatility | 11.09% |
| Probability of a negative return | 13.95% |
| 99% confidence VaR (1-year) | −30.57% |
| Expected holding period | 12.74 months (≈1.06 years) |
| Expected total return over the realized holding period | 6.44% |
| Probability of outperforming the risk-free rate (3.84%) | 85.91% |
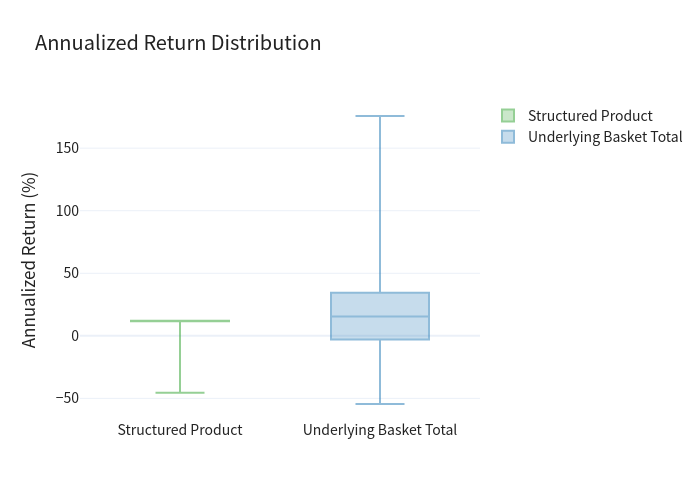
The product offers a 12% p.a. coupon but caps upside at par plus coupons, while retaining a conditional downside that crystallizes only if the worst-performing stock breaches its 55% barrier and finishes below its starting level. Relative to holding the equal-weight basket of the three stocks directly, the product cuts annualized volatility from 28.01% to 11.09% and roughly halves the probability of a loss (13.95% vs. 28.65%), at the cost of giving up most of the upside.
How It Works (in plain terms)
- Three reference stocks: Alphabet (GOOGL), Amazon (AMZN) and Apple (AAPL). The payoff is driven by the worst performer of the three.
- Coupon: A fixed 12% per year, paid quarterly in cash (3% per quarter → up to 18% total over the ~18-month term), regardless of how the stocks perform — provided the product is still alive.
- Barrier protection (55%): If none of the stocks ever trades at or below 55% of its starting level during the observation period, you get your full principal (100%) back at maturity, plus all coupons.
- If the barrier is breached: At maturity you receive principal back only if the worst stock finishes at or above its starting level. If the worst stock finishes below where it started, you are effectively delivered that worst-performing stock and bear its fall (you lose part of your principal). A deep fall can therefore cost a large portion of capital.
- Issuer call (redeemable): The issuer may call the product early on scheduled quarterly dates. When called, you receive par plus the coupon due; no further coupons follow. In practice the issuer calls when the stocks are doing well — so strong-performance scenarios tend to end early with the coupon, whereas weak scenarios are the ones left to run to maturity.
Key Statistics
| Structured Product | Underlying Basket (total return) | |
|---|---|---|
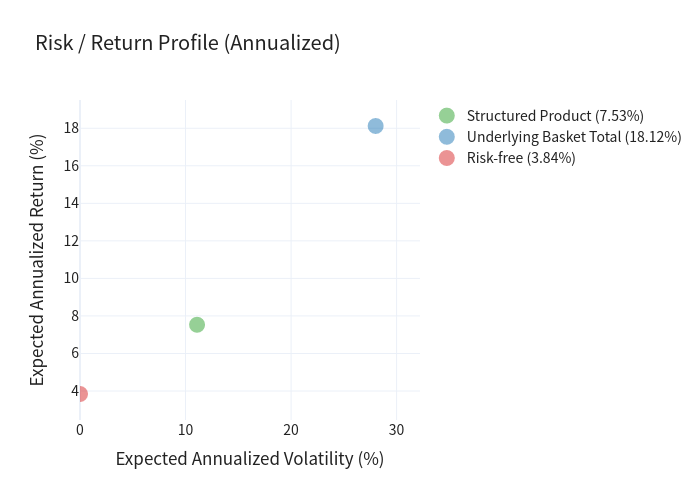
| Expected annualized return | 7.53% | 18.12% |
| Expected annualized volatility | 11.09% | 28.01% |
| Probability of a loss | 13.95% | 28.65% |
| 99% confidence VaR (1-year) | −30.57% | −31.06% |
| Risk-free rate (1-year average T-bill) | 3.84% | — |
Scenario probabilities (product)
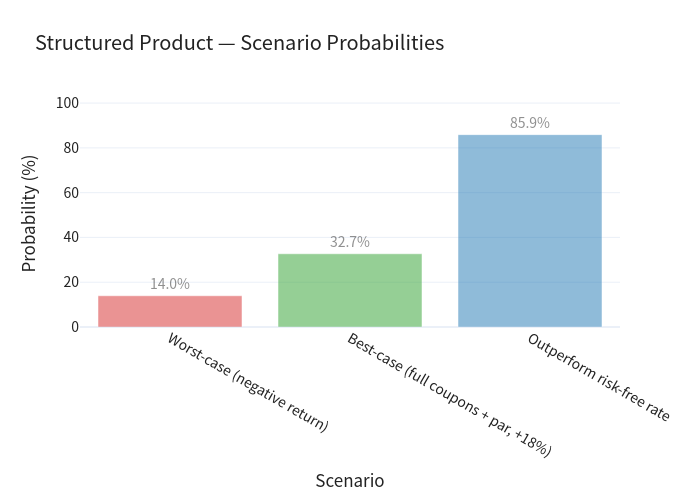
- Worst case — negative return: 13.95%
- Best case — full coupons + principal returned (+18% total): 32.71%
- Outperforms the risk-free rate: 85.91%
Outcome timing
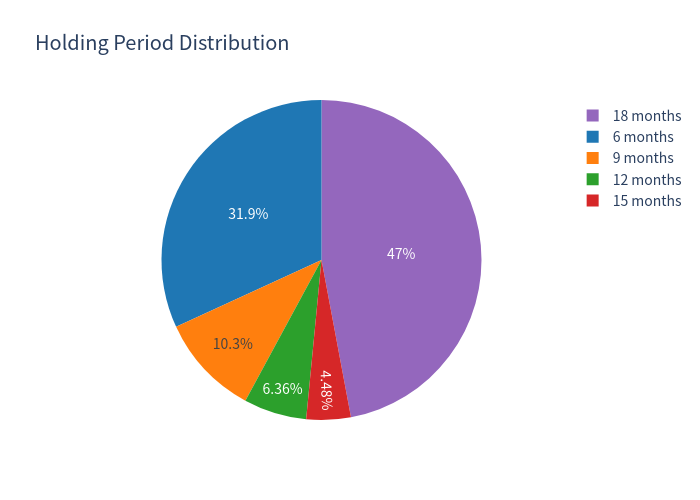
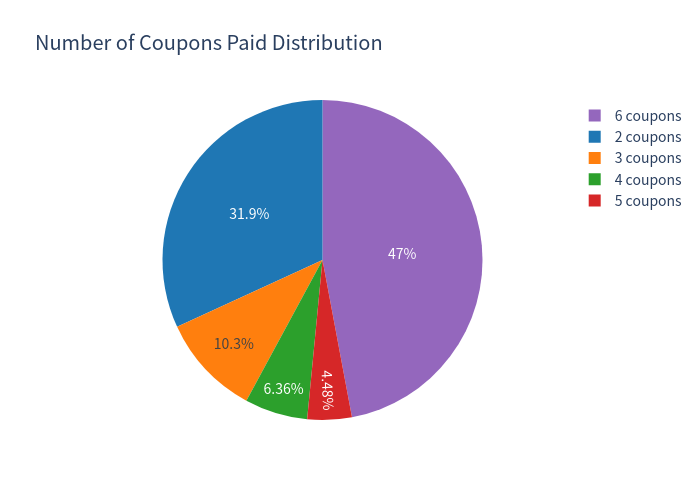
Outcome timing (share of simulations): called at month 6: 31.86% · month 9: 10.25% · month 12: 6.36% · month 15: 4.48% · runs to maturity (month 18): 47.05%. Among the simulations that reach maturity, 30.56% breach the barrier and face stock-delivery downside.
Because the product is callable, a large share of paths (≈53%) ends early. For holdings under 12 months the per-path return is annualized linearly, so annualized numbers can look stretched in either direction. The expected total return over the realized holding period is 6.44% (median 9.00%) across an average holding period of ~12.7 months — the total-return and holding-period figures should be read together, rather than focusing on annualized rates alone.
Simulation Charts
Product return vs. basket return
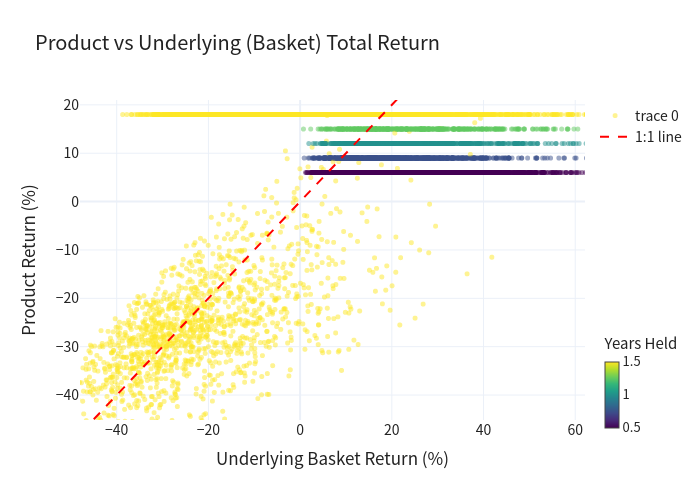
Product return vs. basket return (each dot = one simulation; colour = years held): outcomes cluster on a horizontal line near +12% annualized (the early-redemption coupon cases) and drop into negative territory only when the barrier is breached and the worst stock ends below its strike.
Risk/return profile
Risk/return profile: the product sits far to the left of the underlying basket — materially lower volatility for a lower expected return.
Distribution of annualized returns — underlying basket
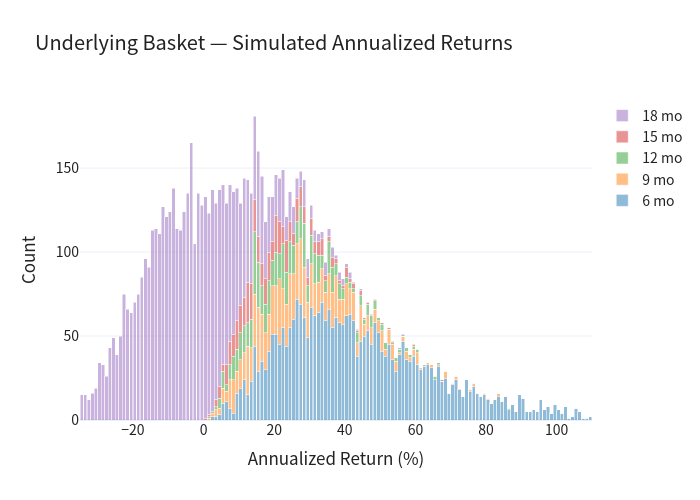
Distribution of annualized returns — underlying basket (stacked by holding period):
Distribution of annualized returns — structured product
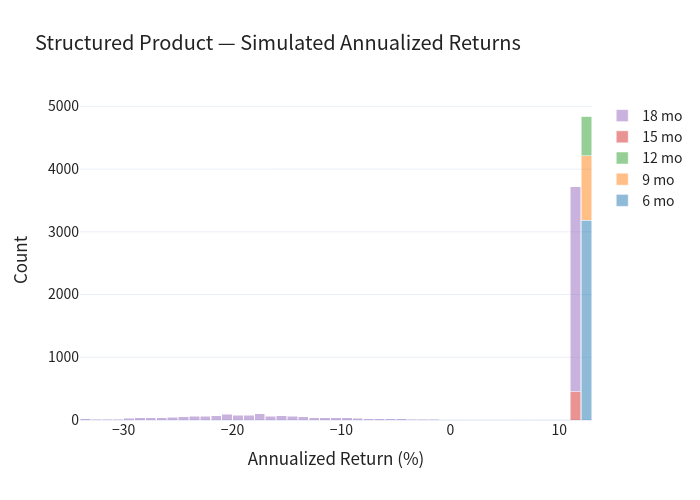
Distribution of annualized returns — structured product (stacked by holding period): a tight cluster near the ~12% coupon level plus a distinct negative tail from the barrier-hit maturity cases.
Scenario probabilities
Box-plot comparison (annualized return)
Holding-period and coupon-count distributions
Investment Commentary
Strengths worth noting
- High headline coupon (12% p.a.) with quarterly cash flow, materially above the ~3.84% risk-free rate.
- Meaningful volatility reduction: 11.09% vs. 28.01% for owning the basket directly — the barrier cushions day-to-day mark-to-market swings if the 55% level holds.
- Wide 55% barrier (a 45% decline from the starting level must occur for protection to fail), applied to a worst-of of three large, liquid, strongly-capitalised technology names.
- High win-rate: ≈86% of simulated paths beat the risk-free rate, and roughly one-third recover full principal plus all six coupons.
- Conditional downside only: losses require both a barrier breach and the worst stock finishing below its starting level — a meaningful double condition.
Trade-offs to be aware of
- Upside is capped at par plus coupons — you do not participate in the stocks' appreciation.
- Because the product is issuer-callable, strong markets lead to early redemption (capped at the coupon), so the full coupon stream is only collected in the weaker / flatter scenarios that run to maturity.
- Worst-of structure concentrates risk in the single weakest name; the ~14% loss probability carries a 99% VaR of −30.57%, reflecting the severe tail when the barrier is breached and the worst stock falls sharply.
- Returns are exposed to the issuer/guarantor's credit standing.
This commentary is descriptive and analytical only; it is not investment advice or a suitability assessment.