
Structured Product Analysis Report
8.00% p.a. Multi Barrier Reverse Convertible on Nestlé, Novartis, Roche (Callable)
Product: CHF-denominated, SSPA 1230 Multi Barrier Reverse Convertible (issuer-callable), worst-of on 3 Swiss large caps, 69% continuous barrier, ~2-year tenor (Sep 2026 – Sep 2028). ISIN CH1593780781.
Headline Simulation Results
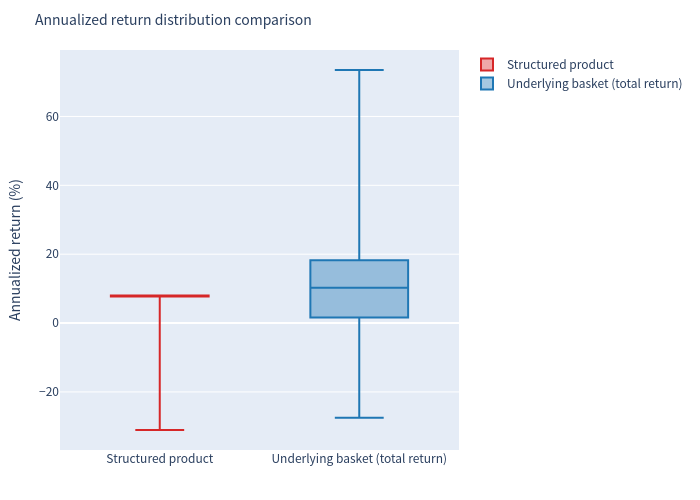
The product's return profile is strongly left-skewed: roughly four out of five simulated outcomes cluster near the full-coupon annualized return of ~7.7–8.0% (median 7.77%), while a minority of scenarios that breach the 69% barrier and end below strike suffer capital losses that pull the mean annualized return down to 4.78%.
1. Basic Product Information
How it works (layman explanation)
- You receive a fixed coupon of 8.00% p.a., paid quarterly (2.00% per quarter = CHF 20 per CHF 1,000 product), regardless of how the three Swiss blue chips (Nestlé, Novartis, Roche) perform.
- The Issuer can call the product early (after 1 year, then quarterly). If called, you get your CHF 1,000 back plus that quarter's coupon and the product ends.
- If no Barrier Event occurs, at maturity (Sep 2028) you receive your capital back in full, no matter how the shares have performed.
- A Barrier Event occurs if at any point during the 2-year life at least one of the three shares has traded at or below 69% of its starting level. A Barrier Event on its own does not cause a loss — it only switches on a conditional capital-at-risk mechanism at maturity.
- That mechanism works as follows: if a Barrier Event has occurred and the worst-performing share finishes below its starting level at maturity, you receive shares of that worst performer instead of cash — i.e., a capital loss proportional to the fall. If the worst performer finishes at or above its starting level, you still receive your capital back in full even after a Barrier Event.
Key characteristics: worst-of payoff; upside fully capped (fixed coupon + par); downside kicks in only via the 69% barrier; issuer-callable (not investor puttable).
2. Key Statistics (simulated, annualized)
| Statistic | Structured Product | Underlying Basket (equal-weight, total return) |
|---|---|---|
| Expected annualized return | 4.78% | 10.66% |
| Expected annualized volatility | 6.72% | 12.44% |
| Probability of loss | 17.85% | 20.73% |
| 99% VaR (1-year) | −17.91% | −14.74% |
| Median annualized return | 7.77% | — |
| Expected total return over realized holding period | 6.48% | — |
| Expected holding period | 18.76 months | — |
Note: the underlying basket figures include an average dividend yield of ~3.16% (added to simulated price returns). Because the product is often terminated early by the Issuer, holding periods vary between 12 and 24 months. The "expected total return over the realized holding period" (6.48%) is not annualized; it is the average cumulative return actually collected before the product ended (many simulations end after only 12 months, collecting 8%).
3. Charts
3.1 Simulation outcomes — product vs underlying
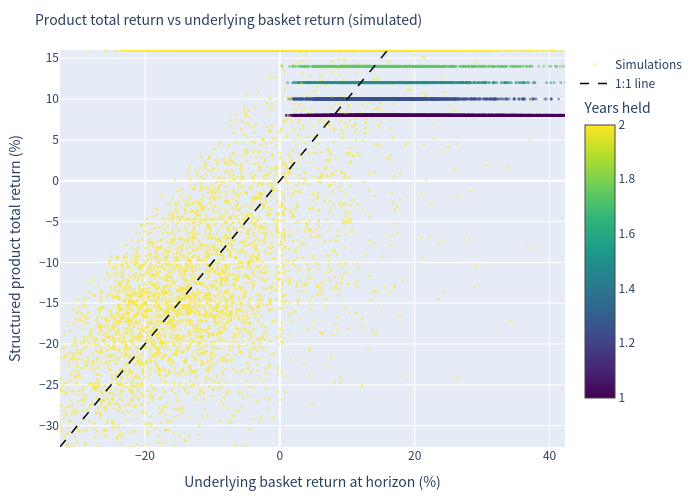
Each dot is one simulation: the x-axis is the equal-weight underlying basket return over the same horizon, the y-axis is the product's total return (coupons included); colour shows how long the product was held. The dashed 1:1 line is shown for reference. Most points sit at/above the coupon-protected plateau, while a downward diagonal cluster (held ~2 years) reflects barrier-triggered share delivery.
3.2 Return distributions
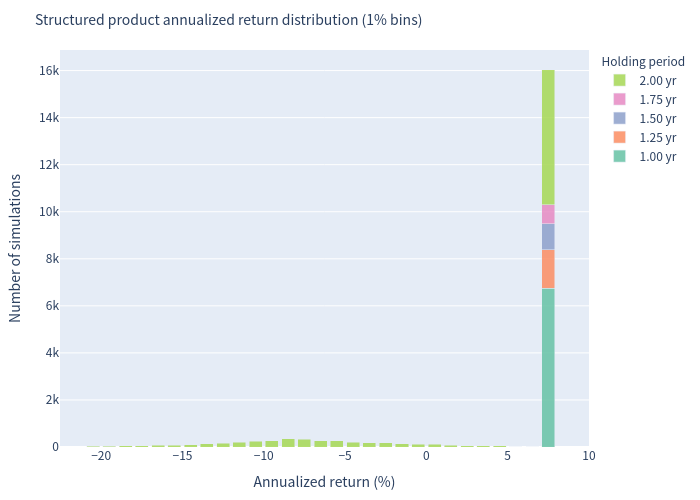
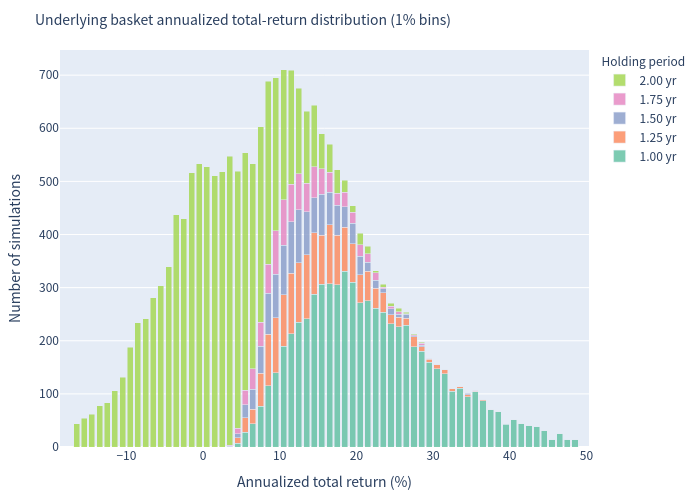
Annualized return distributions (1% bins, coloured by holding period). The product distribution is concentrated near +8% p.a. with a pronounced left tail; the underlying basket distribution is wider and roughly centred lower on a median basis but with higher mean (dividends included).
3.3 Scenario probabilities
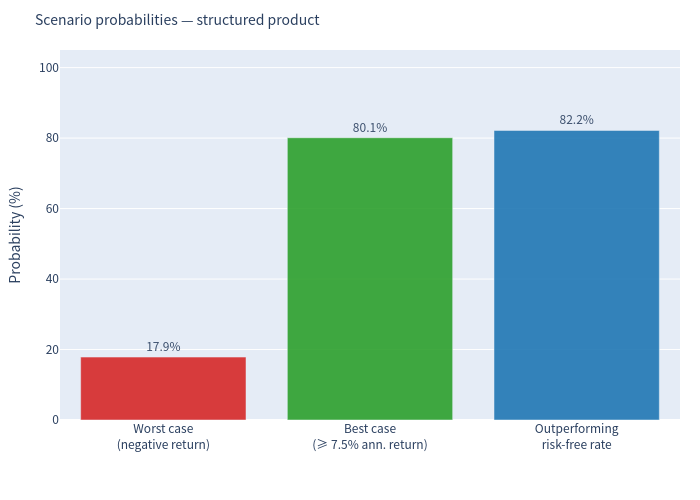
- 17.85% of simulations end with a negative annualized return.
- 80.11% achieve a near-maximum full-coupon outcome (≥ 7.5% p.a. annualized).
- 82.16% outperform the (near-zero) CHF risk-free rate.
3.4 Risk / return profile
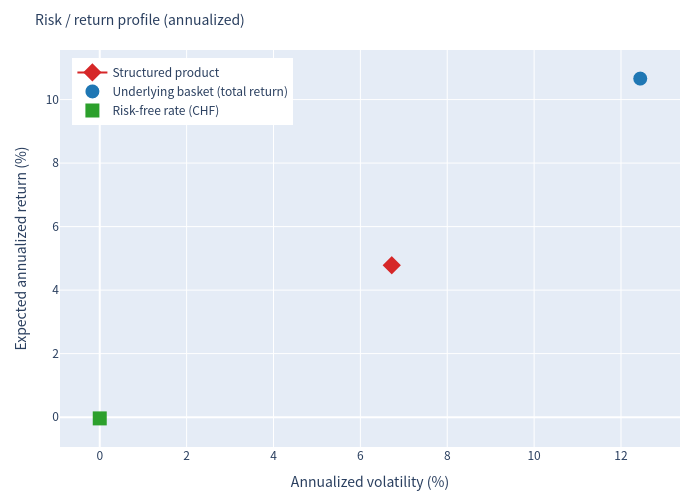
The product offers a higher expected return than the CHF risk-free rate at modest volatility (~6.7%), but a lower expected return than directly holding the underlying basket — the price paid for the fixed coupon and partial downside protection.
3.5 Return distribution comparison
3.6 Holding period & coupons
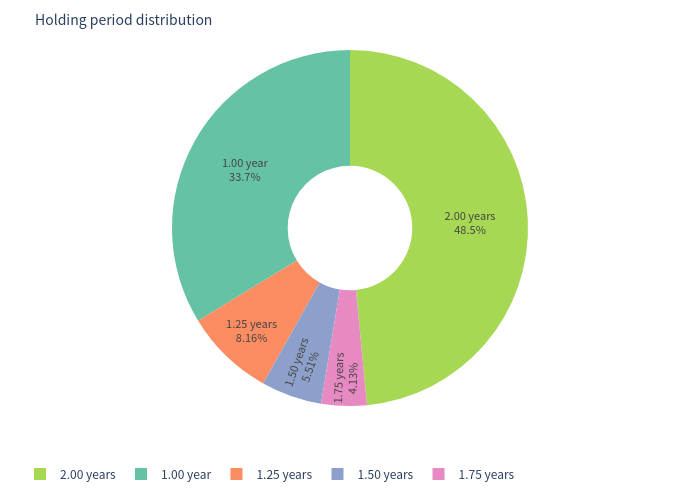
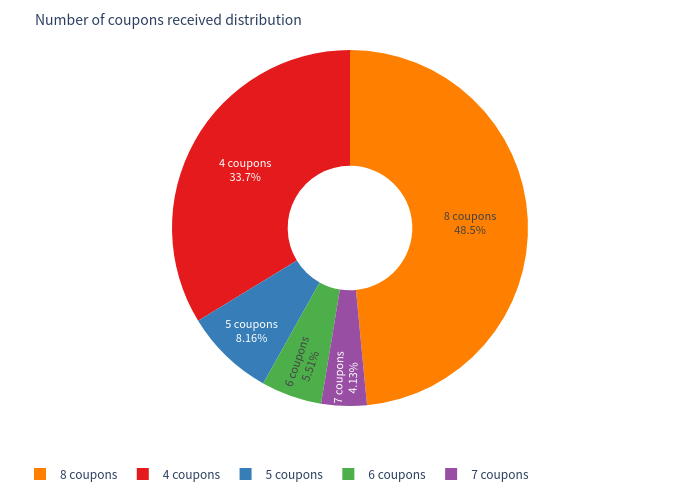
Because the Issuer has a call right, the product is not always held to maturity: ~33.7% of simulations end after 1 year (4 coupons), and 48.5% run to full maturity (8 coupons). Average coupons received ≈ 6.3 of 8 (mean coupon income ≈ 12.51 index points on a 100 notional).
4. Investment Commentary
Attractive features worth noting
- High running yield: an 8.00% p.a. coupon paid quarterly is substantially above CHF money-market rates (~0%), giving the product a high carry if held to a call/maturity without a barrier loss.
- Deep barrier cushion: the 69% barrier means the three underlyings each need to fall more than ~31% from their starting levels before the capital-at-risk feature is activated; with the ~18–22% volatilities of these large caps this is a meaningful but not remote cushion (≈21% modelled probability of any barrier touch over 2 years).
- Downside "buffer" in moderate sell-offs: if no barrier event occurs, capital is returned at par in full even if the underlyings are down as much as ~30%; coupons are still paid throughout.
- High probability of a favourable outcome: ≈80% of simulations achieve an annualized return of at least ~7.5%, and the median outcome (~7.8% p.a.) is close to the headline coupon.
- Diversified reference basket: three of Switzerland's largest, defensive, dividend-paying companies; the worst-of design, however, means the weakest name drives the barrier/conversion risk.
- No FX risk: product and underlyings are all CHF-denominated.
- Early-call feature is not investor-detrimental in expected-value terms: when the Issuer redeems early it is typically with all underlyings at/above their starting levels, locking in ~8% p.a. and removing exposure to later barrier events.
Points to weigh (risk considerations)
- Asymmetric tail risk: although the coupon is fixed, capital is at risk if a barrier event occurs and the worst performer finishes below its start — modelled worst cases (1st percentile) reach about −18% p.a. annualized.
- Worst-of structure: only one of the three names needs to breach the barrier for the capital-at-risk mechanism to switch on.
- Mean vs median: the expected (mean) annualized return (4.78%) is well below the coupon because the left tail is heavy; the median outcome (7.77%) is a better guide to the "typical" case.
- Expected return is below the underlying: over the simulated horizon the product is expected to underperform direct ownership of the basket (10.66% p.a. total return), which is the normal cost of the structure.
Note on assumptions: the issuer-call decision is discretionary in the term sheet and is modelled with a transparent rule (Issuer calls at the first quarterly observation where all three underlyings are at/above their starting levels). A sensitivity shows expected annualized return in the range ≈4.6% (if never called) to ≈7.6% (if the Issuer calls as soon as the underlyings are above the barrier); the base-case 4.78% sits at the conservative end. Barrier observation is continuous in the contract and is approximated on monthly simulated paths with a within-month adjustment.
This report is a quantitative evaluation of the product mechanics and risk/return characteristics based on simulated market scenarios. It does not constitute investment advice or a suitability assessment.